By: Edwin Sarmiento | Updated: 2024-06-28 | Comments | Related: > Query Store
Problem
In a previous tip, SQL Server 2016 Query Store Introduction, we saw how to enable Query Store and find the top resource consumers. We've experienced high CPU utilization recently and wanted to know the root cause and how to fix it. How can we use Query Store to achieve this?
Solution
As described in a previous tip, SQL Server 2016 Query Store Introduction, there is information to help troubleshoot the high CPU utilization issue if you've enabled the Query Store in your database. This tip assumes that SQL Server is causing a high CPU utilization issue on the server and not something external, like your anti-virus software or an intrusion detection system.
The screenshot below shows PerfMon from a server running SQL Server with a high % User Time when an alert was received for a high CPU usage. Knowing that SQL Server is the cause of the high CPU utilization, you can proceed to focus your troubleshooting efforts within SQL Server.
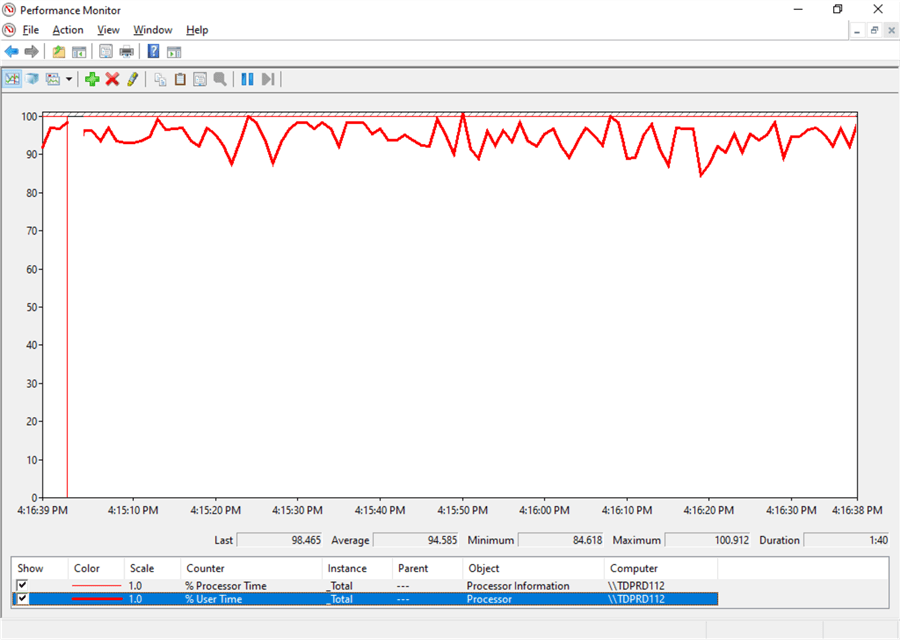
NOTE: It is important to follow a structured troubleshooting process to identify SQL Server performance issues as described in this Microsoft documentation. You don't want to waste time and effort when the issue is caused by something external to SQL Server.
Narrowing It Down Even Further: Find the Specific Database
It's not enough to know that SQL Server is the source of the high CPU utilization issue. If the issue happened recently, you need to find where it is from, specifically within SQL Server. If it was from a query, you need to know which database the query is running on. Since Query Store is a database-level setting, you don't want to waste time checking the Query Store of every single database. You want to zoom in as fast as possible to the one database causing the problem.
The code below can help identify the query using the most CPU time and the database it runs on.
SELECT TOP 5
     DatabaseName       = DB_Name(qt.dbid)
    ,ObjectName         = OBJECT_SCHEMA_NAME(qt.objectid,dbid) + '.' + OBJECT_NAME(qt.objectid, qt.dbid)
    ,TextData           = qt.text
    ,Executions         = qs.execution_count
    ,TotalCPUTime       = qs.total_worker_time
    ,AverageCPUTime     = qs.total_worker_time/qs.execution_count
    ,DiskWaitAndCPUTime = qs.total_elapsed_time
    ,LastExecutionTime  = qs.last_execution_time
FROM sys.dm_exec_query_stats AS qs
CROSS APPLY sys.dm_exec_sql_text(qs.sql_handle) AS qt
ORDER BY qs.total_worker_time DESC
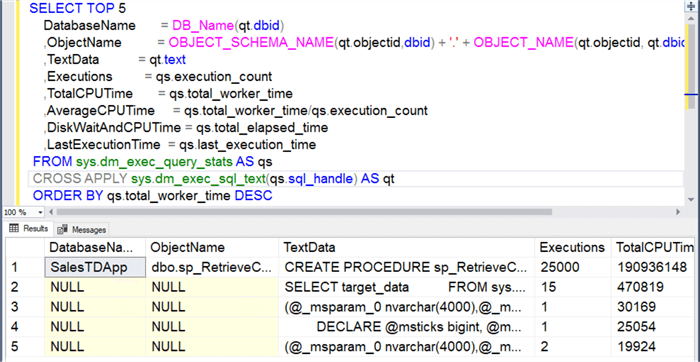
Here, we see that the query using the most CPU time is running inside the SalesTDApp database. Using this information, we can start looking at the Query Store for the SalesTDApp database to analyze the query and why it is causing high CPU utilization.
Using the Query Store in a Specific Database to Start Analyzing the CPU Intensive Query
Within the SalesTDApp database, expand Query Store and double-click Top Resource Consuming Queries. This will open a dashboard containing the top 25 resource consumers for the database.
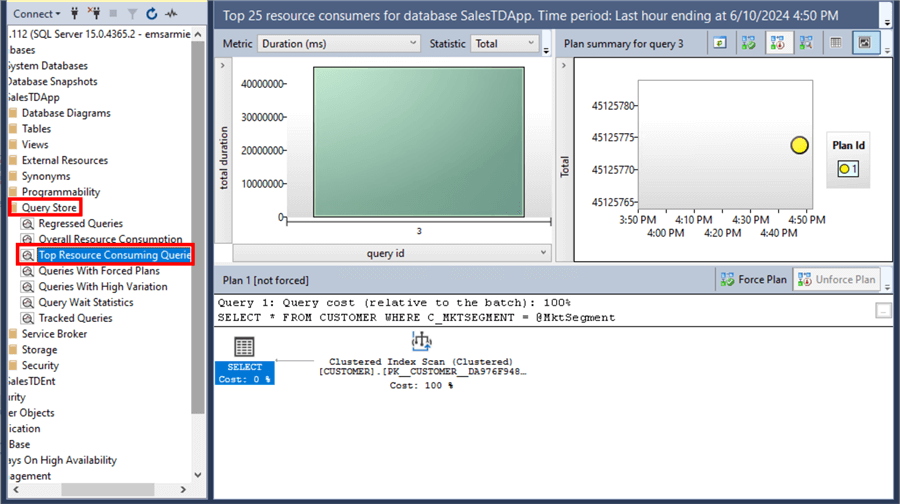
This is consistent with the result received in the previous section. Hovering on the top resource-consuming query (in this example, Query Id 3) gives you additional information.
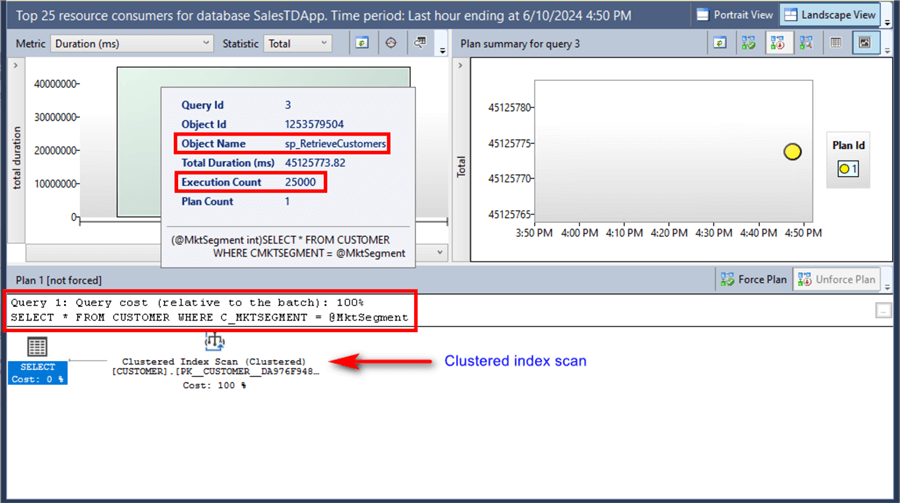
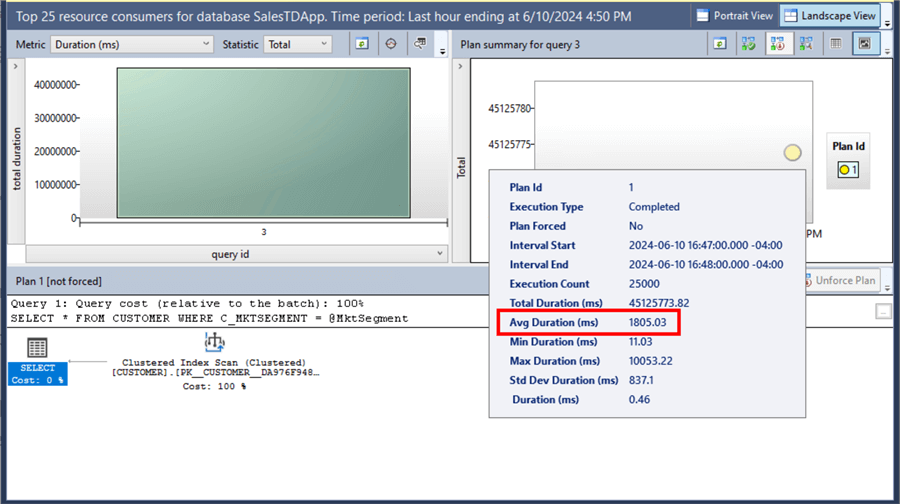
Looking at the dashboard:
- This query is running the sp_RetrieveCustomers stored procedure.
- The stored procedure was called 25000 times.
- The query uses the C_MKTSEGMENT column on the WHERE clause.
- The execution plan shows the query doing a clustered index scan using the primary key value.
- It currently uses a single plan (Plan Id 1).
- The average duration of the stored procedure execution is 1805.03 ms.
You can change the Metric drop-down list to CPU Time (ms) to get additional information.
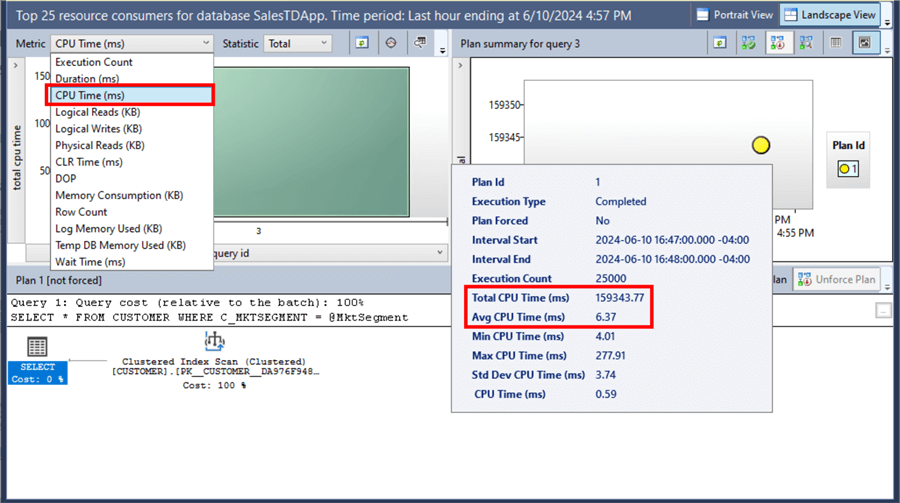
- The average CPU time is 6.37 ms.
- The total CPU time is 159343.77 ms.
The execution plan provides a good hint to improve the query and potentially address the high CPU utilization issue. Typically, SQL Server Management Studio would prompt you with a missing index suggestion. Not in this case. You really need a solid understanding of how the database engine executes queries and uses indexes to identify possible improvements for this query.
Adding a non-clustered index on the C_MKTSEGMENT column of the CUSTOMER table is a possible fix. This can help the query use the non-clustered index instead of only relying on the clustered index.
The query below creates a non-clustered index on the CUSTOMER table using the C_MKTSEGMENT column.
USE SalesTDApp
GO
CREATE UNIQUE NONCLUSTERED INDEX idx_Customer_MKTSEGMENT
ON CUSTOMER(C_MKTSEGMENT)
After the non-clustered index has been created, use the Query Store to see the impact of the change.
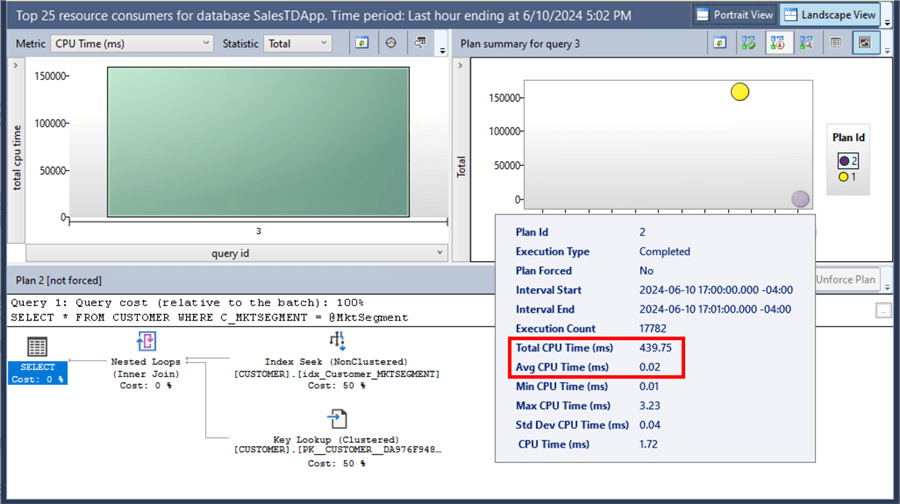
Looking at the dashboard:
- There are now two plans available for the query: the previous Plan Id 1 and the new Plan Id 2.
- Plan Id 2's execution plan shows the query is now doing an index seek based on the newly created non-clustered index (idx_Customer_MKTSEGMENT) with a key lookup using the primary key.
- The average CPU time is now 0.02 ms, down from 6.37 ms or 318x faster.
- The total CPU time is 439.75 ms, down from 159343.77 ms or 362x faster.
Clearly, adding the non-clustered index has improved the query and fixed the high CPU utilization.
NOTE: While query tuning and optimization are more complex than this tip outlines, it provides a great starting point on how to quickly identify high CPU-consuming queries using the Query Store and the possible fix.
In future tips, we will look at other possible reasons why queries cause high CPU utilization using the Query Store.
Next Steps
- Explore how to use the Query Store to identify high CPU-consuming queries and how to fix them.
- Read the Microsoft documentation: Monitor performance by using the Query Store.
- Explore more knowledge on SQL Server Query Store Tips.


About the author
 Edwin M Sarmiento is a Microsoft SQL Server MVP and Microsoft Certified Master from Ottawa, Canada specializing in high availability, disaster recovery and system infrastructures.
This author pledges the content of this article is based on professional experience and not AI generated.
View all my tips
Article Last Updated: 2024-06-28