By: Harris Amjad | Updated: 2024-07-23 | Comments | Related: > Power BI
Problem
In this tip, we will go over the use of logical functions in data analysis using Power BI. Although a use case might not be apparent at a glance, we will soon see that logical functions provide a way to make decisions, filter data based on specific conditions, and perform conditional operations. One way to do this in Power BI is to use specialized DAX logical functions. You will see how these logical functions provide the flexibility and power needed to manipulate, analyze, and interpret data effectively.
Solution
Data-informed decision-making is now everywhere around us—be it for corporate and industry-based use cases or policy analysis in the government and healthcare sectors, the tools utilized are the same. This tip will explore a small subset of these data analysis tools: the logical functions.
We are all familiar with the basic premise of a function. It is simply a relation
and a process that maps its inputs to one output. We are also familiar with many
basic numerical functions and operators. For instance, the + operator
can be considered a function that takes in any two real numbers and outputs the
addition of those numbers. Similarly, MEAN() can also be considered
a function that takes in
 numbers and returns the arithmetic mean of those numbers. Now that we are on this
subject, you can probably recall several other numerical functions and operators
you have often used in different contexts.
numbers and returns the arithmetic mean of those numbers. Now that we are on this
subject, you can probably recall several other numerical functions and operators
you have often used in different contexts.
Building on this concept, we also have another branch of operators and functions that deal with the logical and discrete domain. Logical functions play a crucial role in data analysis by enabling analysts to apply conditional and boolean logic to their data. Particularly in the context of Power BI, logical functions help evaluate an expression as True or False, enabling us to obtain conditional results.

If the concept of logical functions seems abstract to you, do not worry. We will soon expand it, painting a much clearer and more familiar picture. Here are some of the most common logical operators and functions:
| Logical Operator/Function | Description |
|---|---|
| = |
Since you are familiar with this equality
operator, let's evaluate some examples. This operator returns true
if the inputs have the same value. For instance,
 will return true, but
 will
also return true! On the other hand, something like will
also return true! On the other hand, something like
 = 1 will always return false.
|
| > |
This is also a very common comparison operator.
This "greater than" operator takes in two input values and returns
true if a number is strictly greater than the other or not. Note the direction
as
 is true but
 is false. Similar families of operators include <
less than, ≥
greater than or equal, and
≤
less than or equal to. You can easily interpolate the workings of these
operators given the examples above.
is false. Similar families of operators include <
less than, ≥
greater than or equal, and
≤
less than or equal to. You can easily interpolate the workings of these
operators given the examples above.
|
| NOT |
This operator is sometimes also denoted by the !
symbol. It takes in one input, and it essentially acts like an inverter.
If the input is true, NOT will return false and vice
versa. Consider this example:  .
First, we will evaluate the expression within the NOT
statement. Clearly, it returns a false as 3 is neither equal to nor less
than 2. Simplified, our expression has become .
First, we will evaluate the expression within the NOT
statement. Clearly, it returns a false as 3 is neither equal to nor less
than 2. Simplified, our expression has become  ,
which evaluates to true. ,
which evaluates to true.
|
| OR |
This operator is often represented by double or single |
(pipes). It takes in two inputs and returns true if at least one input
evaluates to true. This means that the OR operator only
returns false if both inputs are false. Let's take a look at some
examples:  .
It's clear that the first input evaluates to true, whereas the second
one evaluates to false. We now have .
It's clear that the first input evaluates to true, whereas the second
one evaluates to false. We now have  .
This statement returns true as at least one of our inputs is true. We
would have also gotten a true for the statement .
This statement returns true as at least one of our inputs is true. We
would have also gotten a true for the statement
 . .
|
| AND |
This operator is sometimes represented by the & symbol.
This operator also takes in two inputs and returns true only if both of
the inputs are true; otherwise, it returns false. For instance, if we
consider the previous expression  ,
this will return false as our input ,
this will return false as our input  is false.
|
Note that in several programming languages, "1" is used to represent true, whereas "0" is used to represent false.
Furthermore, now that we have the background for logical algebra, we can expand on the IF statements used in Power BI. IF statements are used to evaluate different expressions constructed by logical operators. They return a different output when the expression is evaluated to be true, and another output if it is false. SWITCH statements are also used for conditional coding. We will see later how it differs from IF statements.
You probably now have a much clearer understanding of logical algebra. To enhance this understanding, let's also take a look at where this type of approach is useful in data analysis:
- Thresholding: Comparison operators like <, >, ≥, and ≤ help us to evaluate whether the data points of a variable surpass a fixed threshold or not. For instance, given that we have the monthly sales data of a particular firm, we can use the comparison operators to obtain information regarding the months in which the sales exceeded the average sales value (which is the threshold in this case).
- Data Filtering: Logical operators can also be used to acquire subsets of our datasets. Clever expressions can be constructed that allow us to filter out outliers, select data within a certain date range, or focus on a particular subset of your dataset that meets specific criteria.
- Data Segmentation: We can also use logical operators and functions to convert a continuous variable into a discrete value based on some conditions. This process is also called discretization.
Creating a Schema in SQL Server
Now that we understand the fundamentals and importance of logical functions in the data analysis process, it is time for a more practical demonstration. For that, we will first create an example dataset using SQL Server that represents the sales and performance metrics of different branches of a hypothetical company.
To get started, we will first create our database.
--MSSQLTips.com
CREATE DATABASE logic;
USE logic;
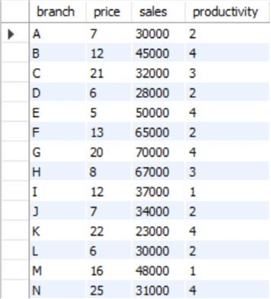
Then, we will construct our table. Assume that this hypothetical firm was initially sold only one good at all of its branches, with a fixed price of 15. It is now trying to gauge the change in its performance after a price discrimination policy was implemented.
--MSSQLTips.com
CREATE TABLE branch_data
(
    branch VARCHAR(255),
    price INT,
    sales INT,
    productivity VARCHAR(255)
);
--MSSQLTips.com
INSERT INTO branch_data VALUES
('A', 7, 30000, 2),
('B', 12, 45000, 4),
('C', 21, 32000, 3),
('D', 6, 28000, 2),
('E', 5, 50000, 4),
('F', 13, 65000, 2),
('G', 20, 70000, 4),
('H', 8, 67000, 3),
('I', 12, 37000, 1),
('J', 7, 34000, 2),
('K', 22, 23000, 4),
('L', 6, 30000, 2),
('M', 16, 48000, 1),
('N', 25, 31000, 4),
('O', 15, 39000, 3),
('P', 14, 46000, 3),
('Q', 5, 50000, 2),
('R', 12, 48000, 4),
('S', 6, 42000, 4),
('T', 24, 38000, 3),
('U', 6, 29000, 1),
('V', 17, 42000, 3),
('W', 8, 35000, 3);
We can visualize this table using the following command:
--MSSQLTips.com
SELECT * FROM logic.dbo.branch_data;
Using DAX Functions in Power BI
Now that we have a dataset to work with, we can import it to Power BI from SQL Server and then analyze it using logical operators and functions. To get started, we will go through the following series of steps:
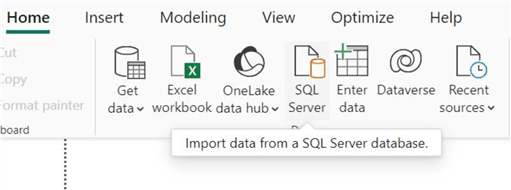
Step 1: Importing the Dataset
In the main interface of Power BI, click on the "SQL Server" icon, as shown below in the Data section of the Home ribbon.
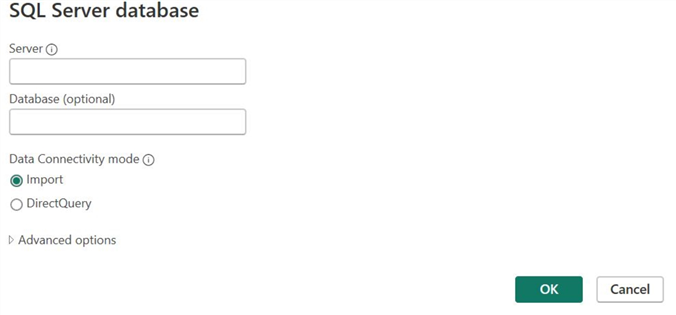
The "SQL Server database" window will pop up. Enter the relevant server and database credentials, then click OK at the bottom.
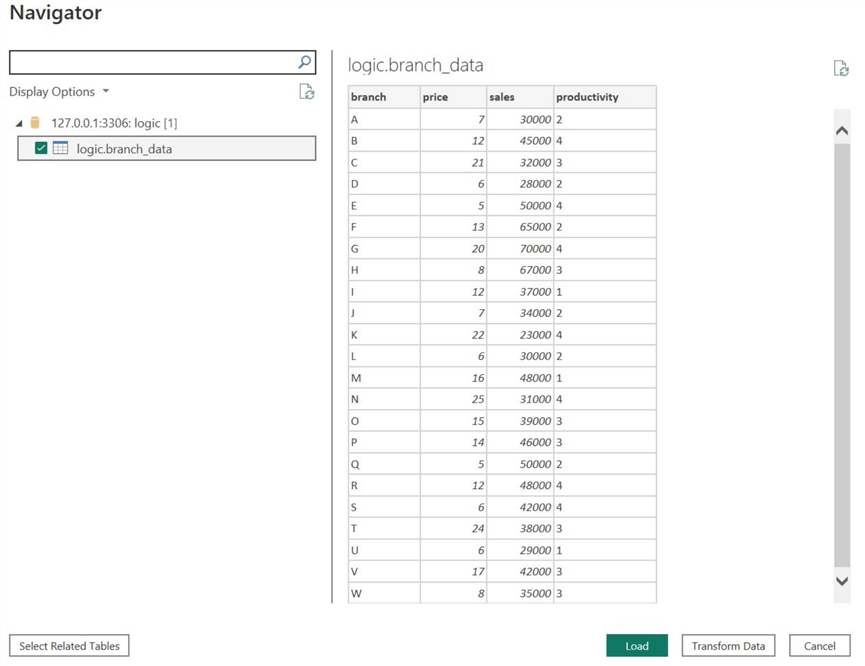
If Power BI successfully establishes a connection with your database, the "Navigator" window will display. Below the "Display Options", select your table. As you can see, Power BI has also given users the option to preview their data at this stage.
Now click Transform Data, as we need to take a slight detour.
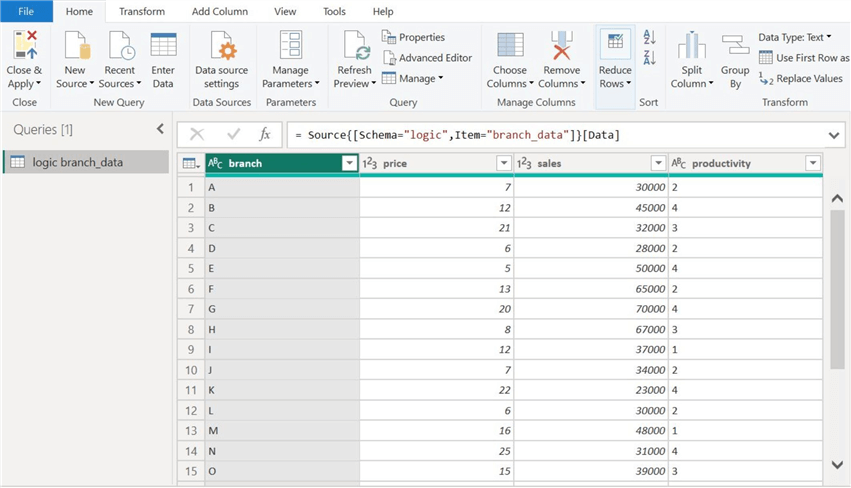
As we can see below, this has opened the Power Query Editor. Here, we have various utilities at hand to clean our data, get rid of any errors, and apply different data manipulation techniques. Fortunately, the only step we need to undertake is to calculate the mean and standard deviation of our sales column, as this will help us segment our data later accordingly.
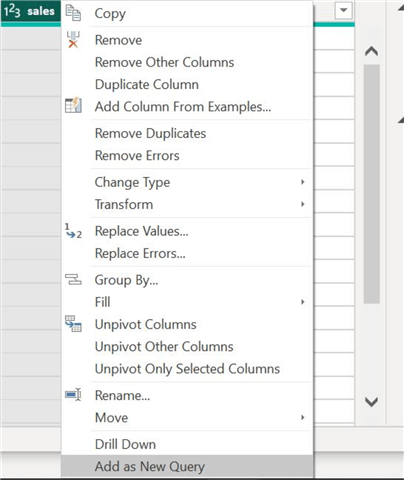
First, duplicate the sales column as a new query, as demonstrated below.
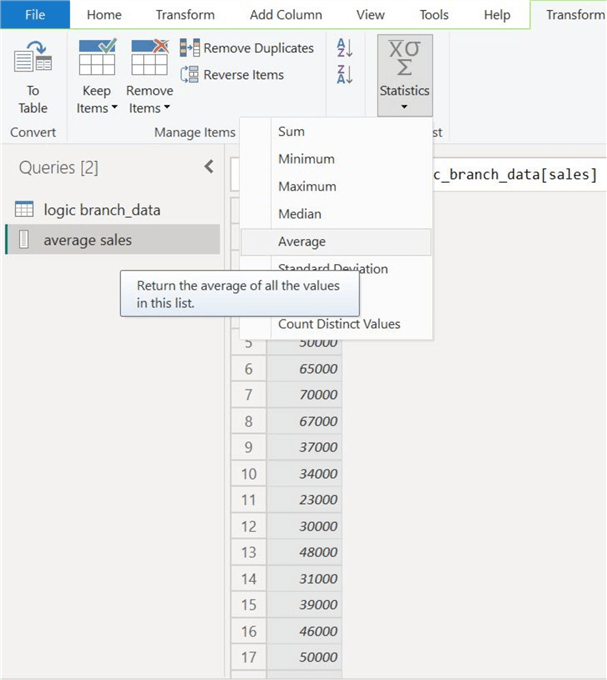
Now, click on this new query. Select the "Statistics" module, where you can choose the "Average" option, as shown below.
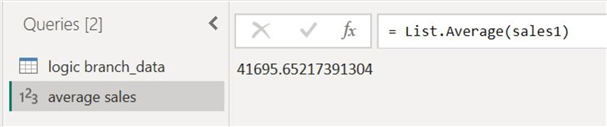
The mean sales will be computed as a new measure.
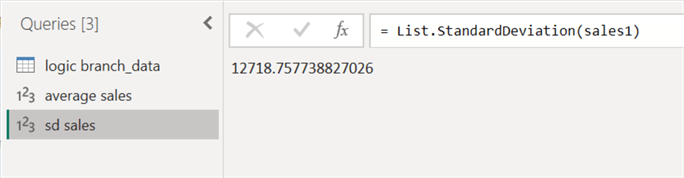
Similarly, we can also calculate the standard deviation of the sales column.
We can explore logical operators and functions now that we are done with these preliminaries.
Step 2: Price Thresholding
Our first objective is thresholding the price around the initial value of 15. If the new price is less than or equal to the initial value, we want to label it "low"; otherwise, we will label it "high."
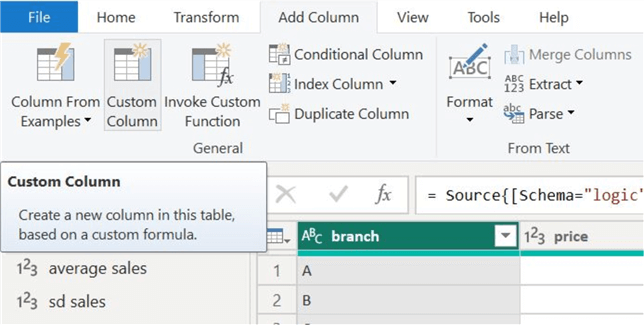
We can do this easily. In the "Add Column" header, select the "Custom Column" option, as shown below.
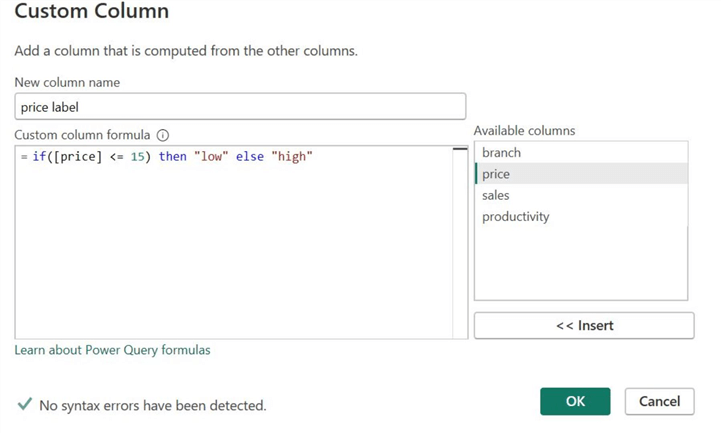
The "Custom Column" window will appear. As you can see below, we
are naming this new column "price label," and its construction is based
on a simple IF statement. We want the column to take the value 'low'
if the corresponding price value is less than or equal to the initial price value.
If this condition returns false, e.g., in the case of  ,
we want the column to take the value "high."
,
we want the column to take the value "high."
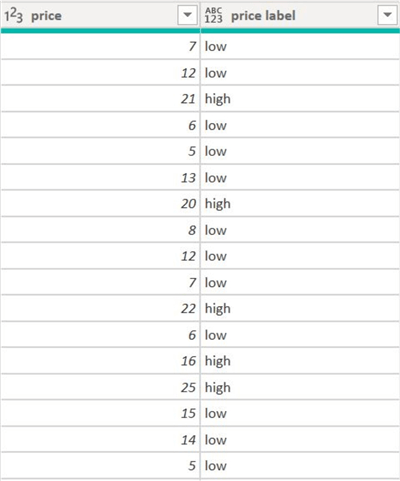
After clicking "OK", we finally have branch-specific data to easily infer where the price discrimination policy led to higher and lower final prices.
Step 3: Sales Segmentation
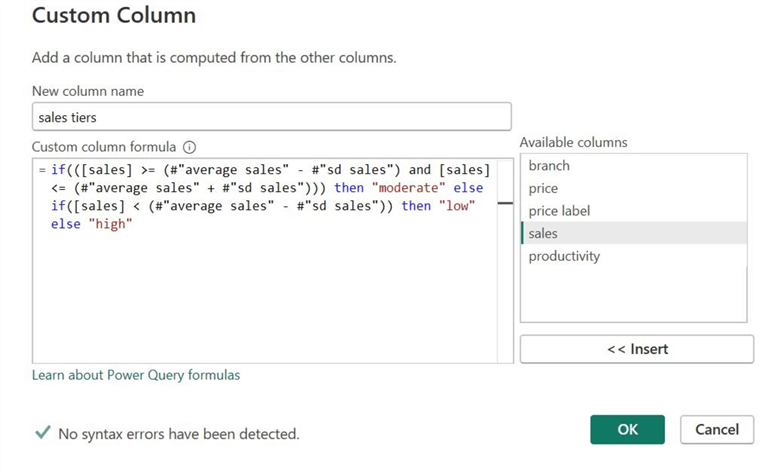
Now, let's do something more interesting. We want to segment our sales column into "good", "moderate", and "low" categories to make it more intuitive. A simple criterion for this can be that a value is moderate if it lies within one standard deviation of the mean. If it is below, it can be labeled as "low"; otherwise, the sales are high. Let's see how we can implement this in Power BI.
Again, open the "Custom Column" window and add the formula shown below. So, what is going on here? If we try to break it down, we will see that the first expression uses the AND operator to label sales values as moderate if they lie within a deviation of the mean. If this expression returns false, we are falling on another IF statement where we evaluate the expression to see whether a value is less than a deviation from the mean. If this is true, we get a "low" tier. If this is false for a particular value, there is only one case left, and we automatically assign it the "high" label without evaluating another expression.
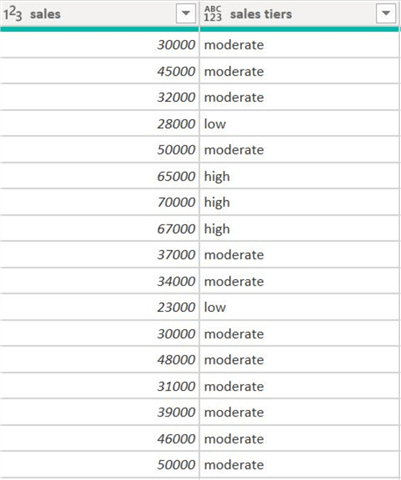
We can observe the correspondence between our columns below.
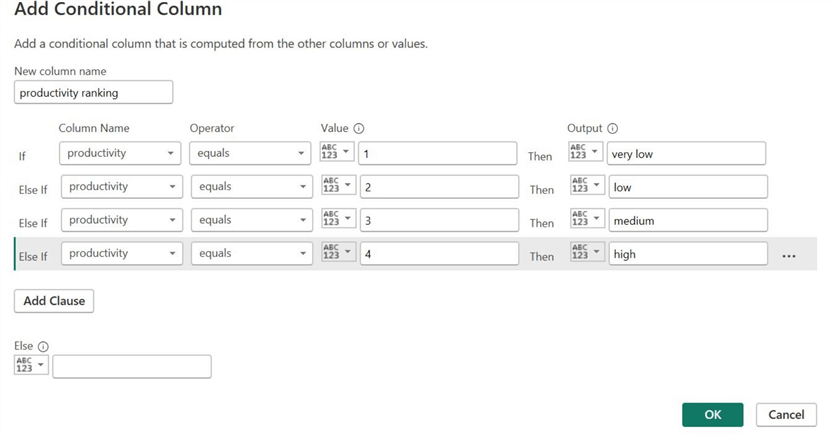
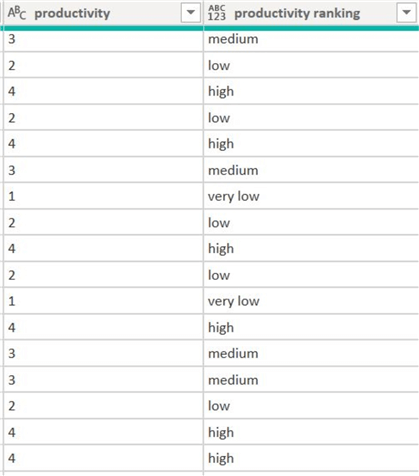
Step 4: Productivity Transformation
Now, let's look at our productivity column. It has been labeled with digits, and we will perform a simple one-to-one transformation on it to give it textual labels for a clearer and more intuitive understanding.
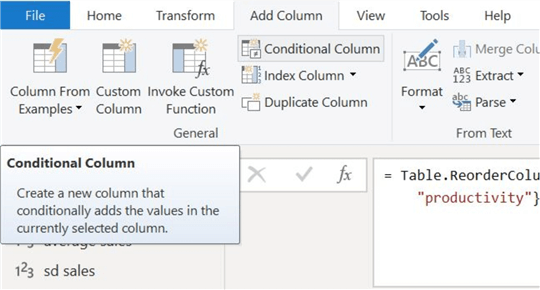
Since Power Query Editor does not natively support switch statements, let's try something different and easy. In the "Add Column," click the "Conditional Column" option. This will allow us to construct a multi-branch IF statement very easily, abstracting away from the syntax.
In the "Add Conditional Column" window below, we have added the relevant clauses with the equality operator in our expression.
We can observe our new column below.
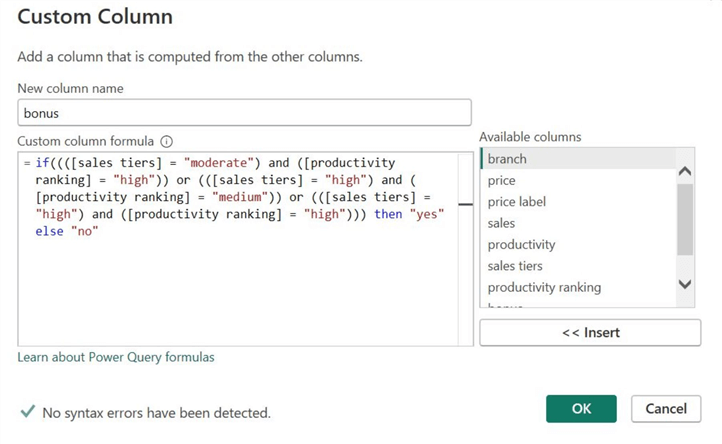
Step 5: Policy Analysis
After finishing our data manipulation, let's see what else we can do. Suppose you, as the general manager, want to allot bonuses to the branch workers based on different criteria: the branch to get a bonus must have high sales and medium productivity or moderate sales or high productivity. Let's create a new custom column to encode this statement.
So, what is happening below? If we notice carefully, we split our main expression into three sub-expressions. The first expression evaluates the condition that "sales tiers" must be moderate and "productivity ranking" should be high. Since our sub-expressions are joined by an OR operator, if the first expression is evaluated as true, we don't need to evaluate the other sub-expressions. In this case, we are giving bonuses to specific branch workers. However, if either of the conditions fails, we will need to move onto the second sub-expression, which only evaluates to true if the "sales tiers" is high and "productivity ranking" is medium. If this is evaluated to true, we again give a bonus to workers. The last expression gives a bonus if both metrics are high. If all three expressions return a false, the branch workers are not getting any bonus.
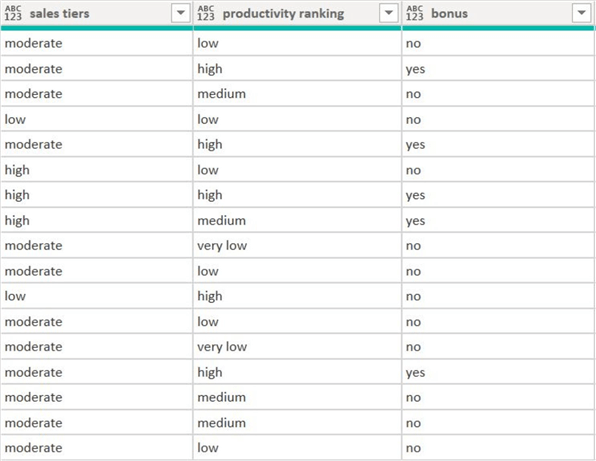
Our final result is shown below.
Conclusion
This tip introduced the concept of logical operators and functions. The workings of different logical operators were thoroughly explained using comprehensive, step-by-step examples, alongside how they are used in conditional IF and SWITCH statements. Also presented were concrete examples where such functions are helpful and essential for data analysis and manipulation. We followed this theoretical understanding with a more hands-on approach using SQL Server and Power BI, whereby we demonstrated a practical application of this topic in a realistic setting.
Next Steps
For interested readers, there is still a lot to explore. There is another branch of operators and functions that we did not discuss in this tip. We are referring to the bitwise operators like BITAND, BITOR, BITLSHIFT and so on. Readers are advised to understand the fundamentals of bitwise operators and where they might be relevant for data analysis.
Furthermore, DAX also has functions like COALESCE, IFERROR, and IF.EAGER, which can also be explored and understand their use cases.
- Check out all the Power BI Tips on MSSQLTips.com.
Learn more about Power BI in this 3 hour training course.


About the author
 Harris Amjad is a BI Artist, developing complete data-driven operating systems from ETL to Data Visualization.
This author pledges the content of this article is based on professional experience and not AI generated.
View all my tips
Article Last Updated: 2024-07-23