By: Jeffrey Yao | Updated: 2024-08-19 | Comments | Related: > Monitoring
Problem
In a database environment, you may find slow SQL Server performance due to high CPU usage. Quite often, this slowness is caused by one or a few SQL Server sessions using high CPU resources, and such queries can even cause the server's CPU to reach 100% for a long period.
As a DBA, how can you proactively monitor high CPU usage by the SQL Server instance and find out which sessions are the culprits for such high CPU?
Solution
When a server machine running SQL Server has high CPU, there are two scenarios causing the issue:
- SQL Server service, or
- Other applications, such as virus scan applications, are installed on the machine.
From a DBA perspective, I am interested in scenario 1, i.e., high CPU caused by the SQL Server service and the "offending" SQL sessions that use high CPU resources.
So, here is my solution for CPU monitoring and session loggings:
- Run PowerShell cmdlet get-counter to get the counters (\PROCESS(_TOTAL)\% Processor Time) and (\PROCESS(SQLSERVER)\% Processor Time) on the target servers and save the collected result into a central table.
- When the SQL Server process CPU value exceeds a predefined threshold [X]%, we will go to the next step. I usually choose X = 85, i.e., the SQL instance process is using more than 85% of the total CPU.
- Run sp_whoisactive on the target SQL Server instance and export the result to another central repository table.
- Send a notification email to the DBA team about the high CPU issue and the corresponding SQL queries collected from the previous step.
To implement the solution, we will first perform the following setup.
All the monitoring work will be set up on a central monitoring server, which has PowerShell V5.1+ and SQL Server PowerShell module installed, together with an SQL Server instance installed (can be a free Express edition). Database mail needs to be set up as well to get notifications.
Source Code
We will first create two tables: one to store the get-counter result and another to store the sp_whoisactive result.
USE DBATOOLS -- change to your own repository database
GO

drop table if exists dbo.CPUCounter, dbo.WhoisActiveResult;
go

CREATE TABLE dbo.CPUCounter (
  ServerName varchar(128)
, CounterInstance varchar(30) -- '_total' or 'sqlservr'
, CounterPath varchar(500)
, CookedValue decimal(8,3)
, LogDate datetime default getdate()
, ID int identity primary key
, BatchID int
);
go
CREATE TABLE dbo.WhoisActiveResult ( [collection_time] datetime
,[dd hh:mm:ss.mss] varchar(20),[session_id] smallint
,[sql_text] xml
,[login_name] nvarchar(128),[wait_info] nvarchar(4000)
,[CPU] varchar(30) ,[CPU_delta] varchar(30)
,[blocking_session_id] int ,[reads] varchar(30) ,[reads_delta] varchar(30)
,[writes] varchar(30) ,[writes_delta] varchar(30) ,[physical_reads] varchar(30)
,[physical_reads_delta] varchar(30) ,[open_tran_count] varchar(30)
,[percent_complete] varchar(30) ,[host_name] nvarchar(128) ,[database_name] nvarchar(128)
,[program_name] nvarchar(128) ,[login_time] datetime , LogDateTime datetime default getdate()
, ServerName varchar(128) ---- the server where these sessions are occurring
, id int identity primary key);
We need to create a monitoring PowerShell script to monitor the CPUs of our designated target servers. The monitoring script will do three things:
- Keep collecting CPU counter values via get-counter and populating the dbo.CPUCounter table.
- After each data collection, analyze whether the CPU is above a predefined threshold on some monitored servers.
- If the CPU usage exceeds the predefined threshold, run sp_whoisactive on those servers, save the results to dbo.WhoisactiveResult, and send an email alert to the DBA team.
The following script makes a few assumptions:
- PowerShell V5.1 or higher and sqlserver module are installed on the monitoring server, which can connect to all the monitored servers.
- On the monitored server, we have a SQL Server instance installed, and the database mail is set up as well.
- Sp_whoisactive v12.00 is installed on the monitored servers.
- For simplicity, we assume only default SQL Server instances, i.e., not named instances, are installed on the monitored servers.
We first create the PowerShell script shown below.
#NOSQLPS
#part 1, collect CPU perf counters from monitored servers
Import-Module SqlServer;

$central_svr ='CentralSvr';  #  pls change the name for your server
$central_db = 'dbatools'; #central repository db
$svr_list = ‘svr_1', ‘svr_2', ‘svr_3'; # this is the list of the monitored servers
#we assume default sql instance ‘\Process(sqlserver)' in this case, you may need to change to your named sql instance when necessary
$counters = '\Process(_total)\% Processor Time', '\Process(sqlservr)\% Processor Time'; #perf counter names, default sql instance is assumed here

$cpu_threshold = 0.85; #we can set a low value for test purpose
$interval = 5; # report cpu every 5 min

try {
    $rslt = get-counter -Counter $counters -ComputerName $svr_list -SampleInterval 5  |
    Select-Object  -ExpandPropert countersamples #-ComputerName uw2psql14

    $dt = new-object System.Data.DataTable;
    $col = New-Object System.Data.DataColumn('ServerName', [System.String]);
    $dt.Columns.add($col);

    $col = New-Object System.Data.DataColumn('CounterInstance', [System.String]);
    $dt.Columns.add($col);

    $col = New-Object System.Data.DataColumn('CounterPath', [System.String]);
    $dt.Columns.add($col);

    $col = New-Object System.Data.DataColumn('CookedValue', [System.Decimal]);
    $dt.Columns.add($col);

    foreach ($r in $rslt)
    {
      $dr = $dt.NewRow();

      $i = $r.path.IndexOf('\process');
      $dr.ServerName = $r.path.Substring(2, $i-2);
      $dr.CounterInstance = $r.InstanceName;
      $dr.CounterPath = $r.Path;
      $dr.CookedValue = $r.CookedValue;
      $dt.Rows.add($dr);
    }
    Write-SqlTableData -ServerInstance $central_svr -DatabaseName $central_db -SchemaName dbo -TableName CPUCounter -InputData $dt -TrustServerCertificate;
    $qry = @"
    update t
    set batchid = (select max(isnull(batchid,0))+1 from dbo.CPUCounter)
    from dbo.CPUCounter t
    where batchid is null;
"@
invoke-sqlcmd -ServerInstance $central_svr -Database $central_db -Query $qry -TrustServerCertificate;
}
catch {
    write-error $_;
}
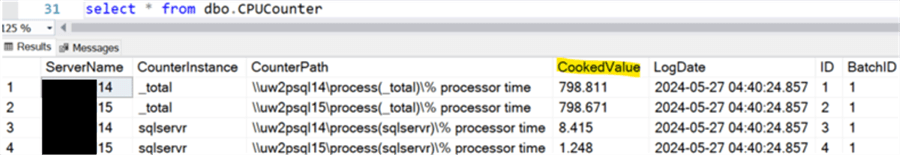
If I run the PowerShell script, I can see the CPU performance data is collected in the table dbo.CPUCounter.
If we want to send an alert if the SQL Server service CPU is more than 85% within the last 5 minutes (assuming we collect CPU counters every minute), we need to calculate the average CPU usage by the SQL Server for the last 5 minutes. If it exceeds the defined threshold, we will send an alert via database mail.
We need to expand the previous PowerShell code to include the logic to find whether the threshold is reached on which server instances and then send an alert email if true.
#part 2 –- find whether CPU has reached the defined threshold
$qry = @"
declare @cpu_threshold decimal(5,2)=$cpu_threshold; -- threshold above which an alert will be sent
declare @interval int = 5; -- interval (minutes) that is used to evaluate the
declare @batchid int, @diff_minutes int, @cnt int;

select  @batchid= max(batchid)
from dbo.CPUCounter;

select  @diff_minutes = datediff(minute, min(logdate), max(logdate)), @cnt = count(distinct batchid)
from dbo.cpucounter
where batchid >= (@batchid - @interval);
drop table if exists #t;
create table #t (servername varchar(128), perc decimal(6,2));

if @diff_minutes >= @interval-1 and @cnt >= @interval
begin
   ; with c as (select servername, counterinstance, cnt=count(*), CV=avg(cookedvalue)
   from dbo.CPUCounter
   where batchid > (@batchid - @interval) and BatchID <= @batchid
   group by servername, counterinstance )
   insert into #t (servername, perc)
   select c.servername, perc = c.cv/c2.cv
   from c
   inner join c as c2
   on c.ServerName = c2.ServerName
   and c.CounterInstance = 'sqlservr' and c2.CounterInstance = '_total'
end

select Servername, Perc from #t
where Perc >= @cpu_threshold;

"@
$rslt = invoke-sqlcmd -ServerInstance $central_svr -Database $central_db -Query $qry -OutputAs DataRows -TrustServerCertificate;

#part 3, if CPU threshold is reached, take a snapshot of the environment with sp_whoisactive
$qry2=@"
drop table if exists #whoisactiveresult;

CREATE TABLE #WhoisActiveResult ( [collection_time] datetime
,[dd hh:mm:ss.mss] varchar(20) ,[session_id] smallint
,[sql_text] xml
,[login_name] nvarchar(128),[wait_info] nvarchar(4000)
,[CPU] varchar(30) ,[CPU_delta] varchar(30)
,[blocking_session_id] int ,[reads] varchar(30) ,[reads_delta] varchar(30)
,[writes] varchar(30) ,[writes_delta] varchar(30) ,[physical_reads] varchar(30)
,[physical_reads_delta] varchar(30) ,[open_tran _count] varchar(30)
,[percent_complete] varchar(30) ,[host_name] nvarchar(128) ,[database_name] nvarchar(128)
,[program_name] nvarchar(128) ,[login_time] datetime)

EXEC SP_WHOISACTIVE --@HELP=1
  @not_filter='NT AUTHORITY\SYSTEM', @not_filter_type='login'
, @get_outer_command=1
, @output_column_list = '
[collection_time]
,[dd hh:mm:ss.mss]
,[session_id]
,[sql_text]
,[login_name]
,[wait_info]
,[CPU]
,[CPU_delta]
,[blocking_session_id]
,[reads]
,[reads_delta]
,[writes]
,[writes_delta]
,[physical_reads]
,[physical_reads_delta]
,[open_tran_count]
,[percent_complete]
,[host_name]
,[database_name]
,[program_name]
,[login_time]'
, @delta_interval = 2
, @destination_table='#whoisactiveresult';

SELECT * from #whoisactiveresult;
"@

#we will need to capture the sp_whoisactive and save to central repository
If ($rslt -ne $null) #some server has CPU perf exceeding the specified threshold
{
  Foreach ($r in $rslt)
  {
    $svr_tmp = $r.Servername
    Write-Host "$svr_tmp" -ForegroundColor Green;
    $whoisactive = invoke-sqlcmd -ServerInstance $svr_tmp -Database master -Query $qry2 -TrustServerCertificate -OutputAs DataTables -MaxCharLength 65534;
    if ($whoisactive -ne $null)
    {
        Write-SqlTableData -ServerInstance $central_svr -DatabaseName $central_db -SchemaName dbo -TableName WhoisActiveResult -force  -InputData $whoisactive -TrustServerCertificate;
        invoke-sqlcmd -ServerInstance $central_svr -Database $central_db -Query "update dbo.WhoisActiveResUlt set ServerName='$svr_tmp' where ServerName is null" -TrustServerCertificate;
    }#$whoisactive -ne $null
  }
  #we also get the current max(id) after the insert to dbo.Whoisactive
  $rd = invoke-sqlcmd -ServerInstance $central_svr -Database $central_db -Query "select starttime=convert(datetime, dateadd(minute, -$interval,max(collection_time)), 101),  endtime =convert(datetime, dateadd(second, 1, max(collection_time)), 101) from dbo.WhoisactiveResult with (nolock)" -OutputAs DataRows -TrustServerCertificate;
  $rid_st = $rd.starttime;
  $rid_et = $rd.endtime;

  #compose sql statements for alert email
    $cpu_perc = $cpu_threshold * 100;
    $qry ="
    exec MSDB.DBO.sp_send_dbmail @recipients='your-email'
    , @subject='High CPU Detected (above $cpu_perc%)  for the past [$interval] minutes'
    , @body = 'For details, please run the following query against $central_svr `n

select * from DBATOOLS.dbo.WhoisactiveResult
where collection_time between ''$rid_st'' and ''$rid_et''
order by cast(replace(replace(cpu_delta, '','', ''''), '' '', '''') as int) desc;'
"
    invoke-sqlcmd -ServerInstance $central_svr -Database msdb -TrustServerCertificate -Query $qry;
}#if
We can put the whole PowerShell script into a SQL job on the center server, as shown below.
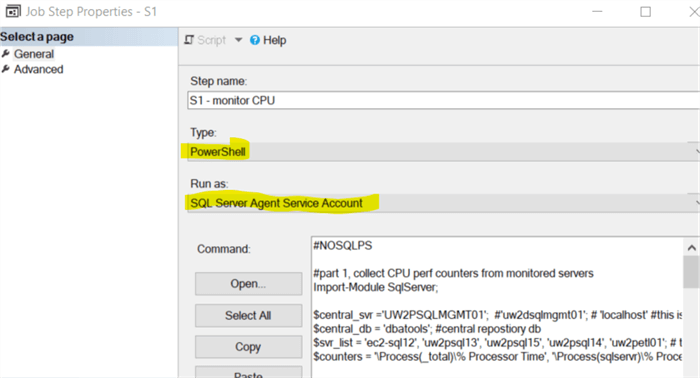
Note: My central server is SQL Server 2019 standard edition, and the key point is in the first line of the PowerShell script. It should be #NOSQLPS to avoid loading the default SQLPS module. Please see the reference link below for details.
Testing
To test the script, we can purposely set a low threshold value:
$cpu_threshold = 0.10; #we can set a low value for test purpose
We also need to give the correct computer names for $svr_list:
$svr_list = ‘svr_1', ‘svr_2', ‘svr_3'; # this is the list of the monitored servers
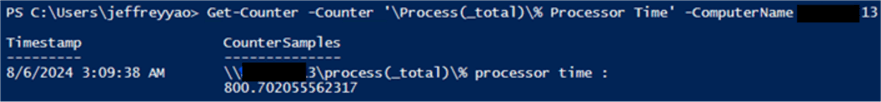
For each server, please make sure that the CPU performance counter can be collected from the central server by running the following quick PowerShell cmdlet:
Get-Counter -Counter '\Process(_total)\% Processor Time' -ComputerName "servername" # see an example below
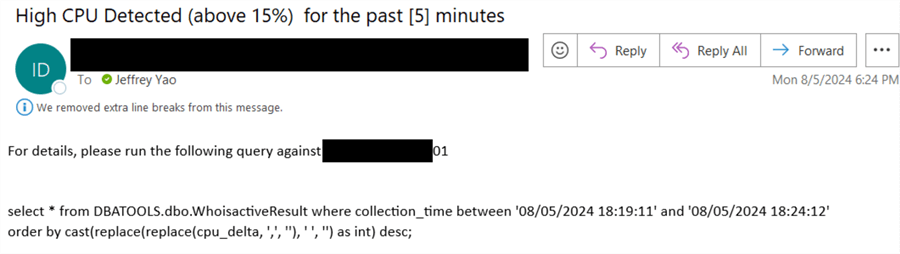
I have scheduled the job to run every minute, and here is the sample alert email I received when the CPU of the SQL Server process on one or more monitored servers exceeded the predefined threshold, which is 15% (for test purposes).
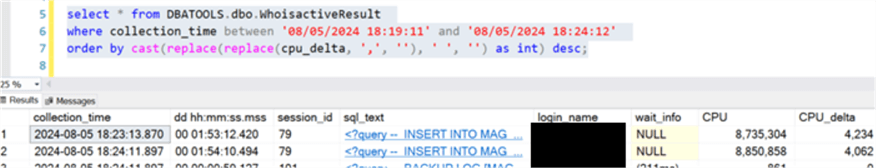
I can copy and paste the SELECT query in the alert email and run it against the central server, and the result is as follows. The key point to check the query result is column [CPU_delta], which is automatically calculated by sp_whoisactive between 2 seconds. This is done by providing @delta_interval = 2 parameter to sp_whoisactive (which you can see in the code above). Of course, we can change the value of @delta_interval to meet our own needs.
Summary
This tip describes a simple, near real-time monitoring of the SQL Server process CPU usage and the queries running at the time of high CPU.
Since the monitoring is based on the CPU usage of each process, it minimizes the potential false alarms about the SQL Server process as a culprit for high CPU usage. If high CPU usage is caused by another process other than the SQL Server process, this monitoring will not send an alert to the DBA team.
Next Steps
This framework can be extended to monitor other SQL Server performance issues. For example, if the tempdb data file keeps expanding or a database log file keeps growing, we DBAs may want to determine which queries could be the culprits for such issues. We can monitor the default SQL trace file, find the data file or log file expanding events, and then run the sp_whoisactive on the target server to capture the current query running status.
- Run PowerShell from SQL Server Agent
- Sp_whoisactive documentation
- Using the SQL Server Default Trace to Audit Events
- SQL Server High CPU Query Use Monitoring with PowerShell


About the author
 Jeffrey Yao is a senior SQL Server consultant, striving to automate DBA work as much as possible to have more time for family, life and more automation.
This author pledges the content of this article is based on professional experience and not AI generated.
View all my tips
Article Last Updated: 2024-08-19