By: Edwin Sarmiento | Updated: 2024-09-03 | Comments (1) | Related: > Performance Tuning
Problem
In a previous tip on SQL Server 2016 Query Store Introduction, we've seen how to enable Query Store and find out the top resource consumers. We've experienced high CPU utilization recently and wanted to know the root cause and how to fix it. How can we use Query Store to achieve this?
Solution
As described in a previous tip noted above, you have information that can be used to troubleshoot the high CPU utilization issue if you've enabled the Query Store in your database. The assumption here is that it is indeed SQL Server that is causing a high CPU utilization issue on the server and not something external like your anti-virus software or an intrusion detection system.
The screenshot below shows PerfMon from a server running SQL Server with a high % User Time. This was when we got an alert about high CPU usage. Knowing that SQL Server is the cause of the high CPU utilization, you can proceed to focus your troubleshooting efforts within SQL Server.
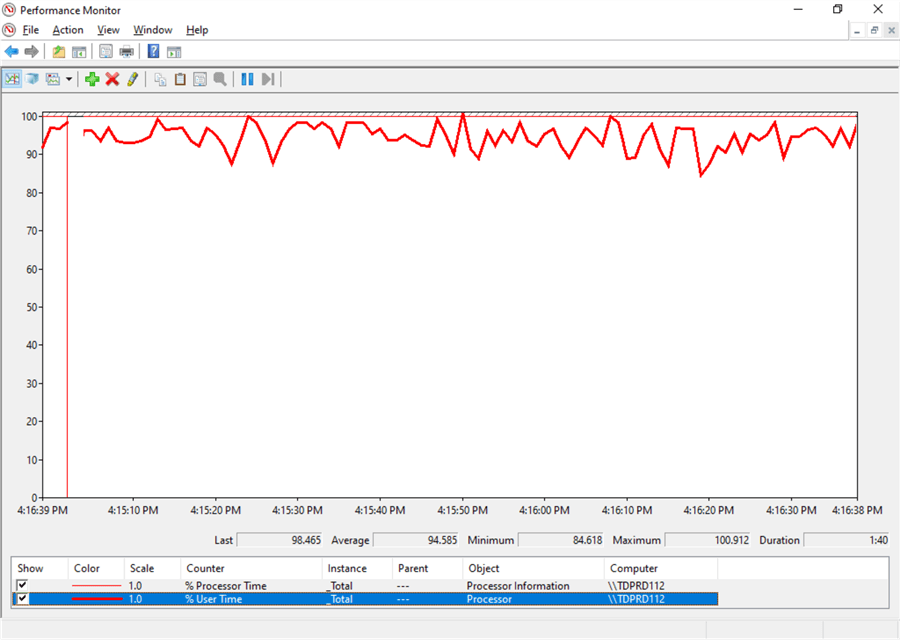
NOTE: It is important that you follow a structured troubleshooting process to identify SQL Server performance issues as described in this Microsoft documentation. You don't want to be wasting time and effort when the issue is caused by something external to SQL Server.
When an Index Doesn't Improve Query Execution
In the previous tip about Using Query Store to Identify CPU Intensive Queries: A Tale of Creating Proper Indexes, adding a unique non-clustered index on a column helped improve the query execution and relieve the high CPU utilization issue.
But what if adding a non-clustered index does not make any difference in the query execution?
Below is the execution plan for a CPU-intensive query taken from the Query Store.
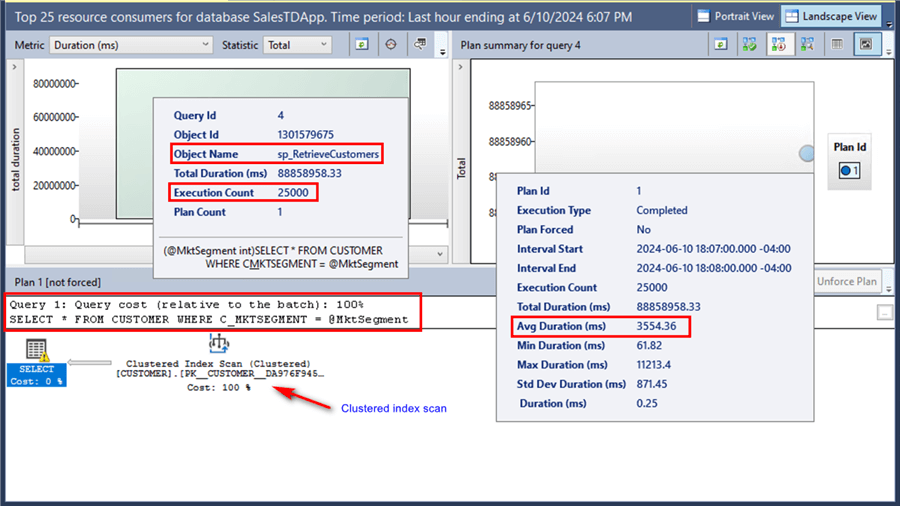
Looking at the dashboard:
- This query is running the sp_RetrieveCustomers stored procedure.
- The stored procedure was called 25000 times.
- The query uses the C_MKTSEGMENT column on the WHERE clause.
- The execution plan shows the query doing a clustered index scan using the primary key value.
- It currently uses a single plan (Plan Id 1).
- The average duration of the stored procedure execution is 3554.36 ms.
You can change the Metric drop-down list to CPU Time (ms) to get additional information.
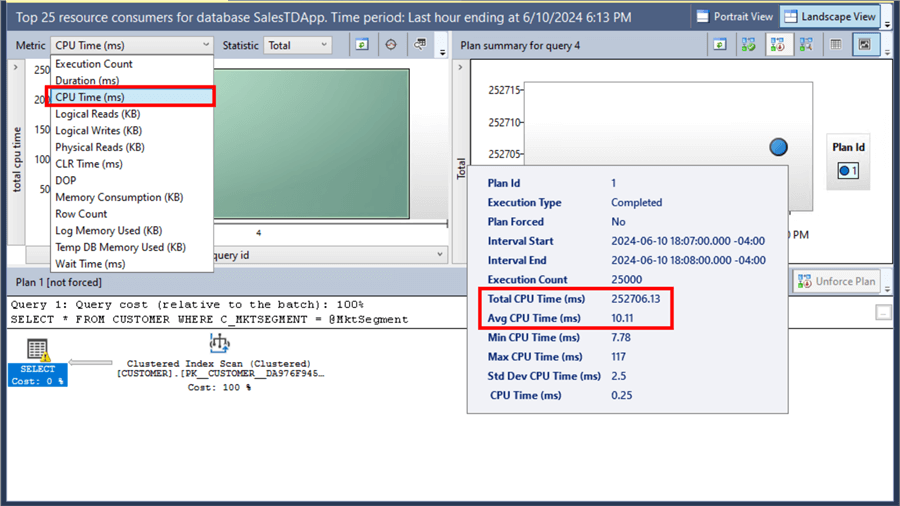
- The average CPU time is 10.11 ms.
- The total CPU time is 252706.13 ms.
In the previous tip, adding a non-clustered index on the C_MKTSEGMENT column of the CUSTOMER table helped improve the query and fixed the high CPU utilization. While adding indexes can help improve query execution, looking at the execution plan from the Query Store after adding the non-clustered index says otherwise.
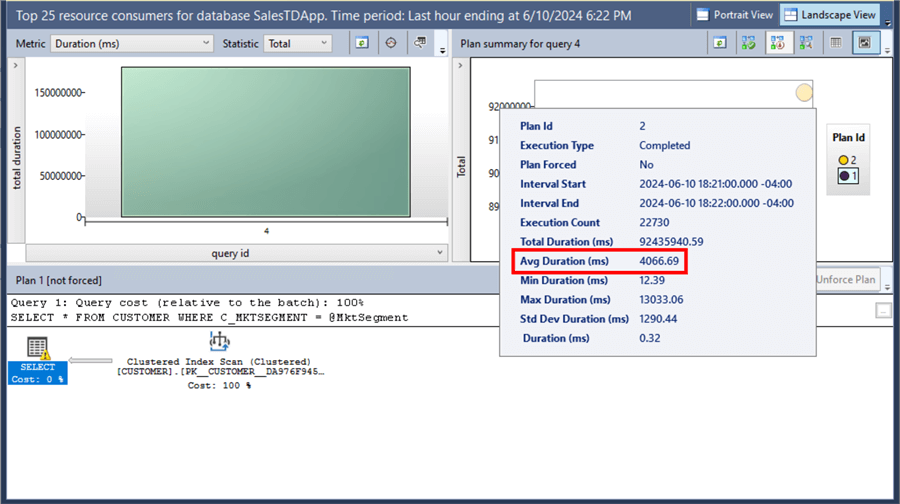
In fact, the non-clustered index made the average duration worse – from 3554.36 ms up to 4066.69 ms – a 12% DECREASE in performance as the query ran longer.
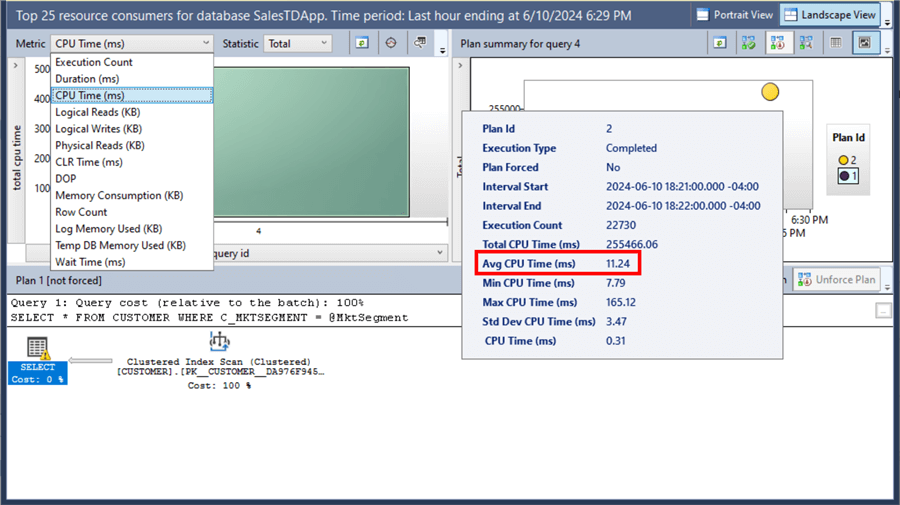
Or the average CPU time from 10.11 ms to 11.24 ms – a 10% DECREASE in performance.
This is not the kind of result we want to see when optimizing a query, similar to the previous tip, to eliminate high CPU utilization.
What's going on here?
Identifying Implicit Conversions
You can use the Top Resource Consuming Queries report on the Query Store to identify the offensive query. You can then look at the different execution plans that the query used to understand what the database engine is doing to run the query. Refer to this tip, How to read SQL Server graphical query execution plans, to read the execution plans of your CPU-intensive queries.
From the execution plan, you can see that SQL Server is using a clustered index scan despite having a non-clustered index on the C_MKTSEGMENT column.
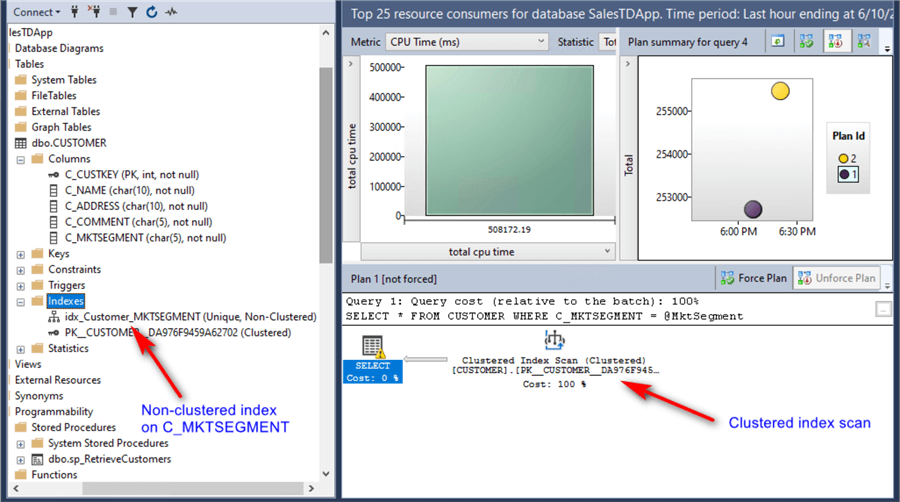
That's because SQL Server thinks it is more costly to use the non-clustered index than it is to use the clustered index based on the primary key.
But why?
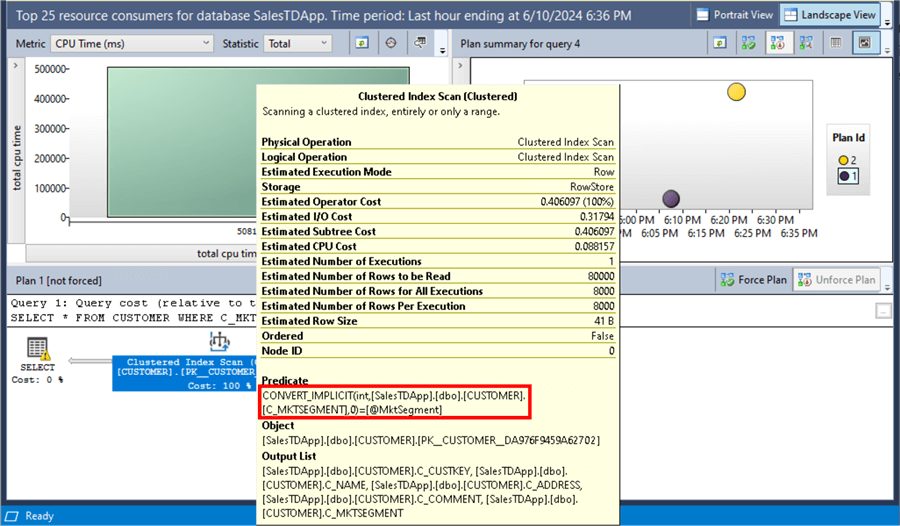
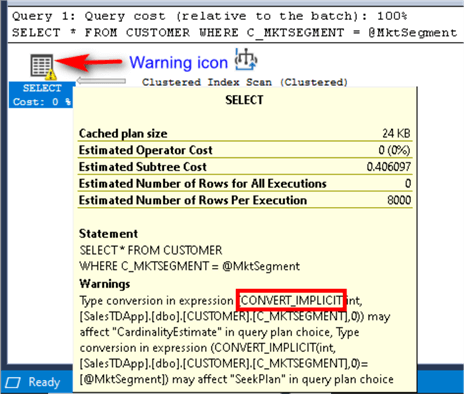
Looking at the execution plan, there are two ways to find out. One way is by looking at the Clustered Index Scan operator. Hovering over the Clustered Index Scan operator shows the CONVERT_IMPLICIT function. SQL Server is modifying all of the C_MKTSEGMENT column values to a compatible data type before it compares it to the @MktSegment parameter value. This is known as an implicit conversion.
Looking at the data type of the C_MKTSEGMENT column of the CUSTOMER table reveals a CHAR(5) data type.
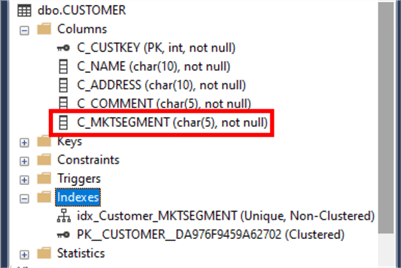
The sp_RetrieveCustomers stored procedure definition reveals an incompatible data type for the @MktSegment parameter.
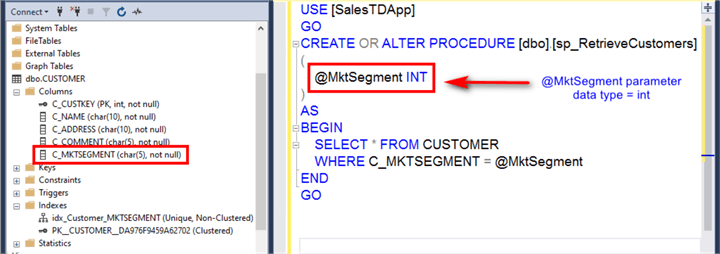
SQL Server is modifying all of the C_MKTSEGMENT column values of CHAR(5) data type before it is compared to the @MktSegment parameter value of an INT data type. This is why the CONVERT_IMPLICIT function is being called.
The other way to find out is by looking at the SELECT operator in the execution plan. Notice that the SELECT operator includes a warning icon. Hovering over the SELECT operator shows the same CONVERT_IMPLICIT function.
Since implicit conversion is an expensive operation, eliminating it would definitely improve the query. In this example, modifying the data type of the @MktSegment parameter in the sp_RetrieveCustomers stored procedure to match that of the C_MKTSEGMENT column's data type will do the trick.
USE SalesTDApp
GO
CREATE OR ALTER PROCEDURE [dbo].[sp_RetrieveCustomers]
(
   @MktSegment char(5) –-using the same data type as the C_MKTSEGMENT column
)
AS
BEGIN
   SELECT * FROM CUSTOMER
   WHERE C_MKTSEGMENT = @MktSegment
END
GO
After the stored procedure definition has been modified, you can use the Query Store to see the impact of the change.
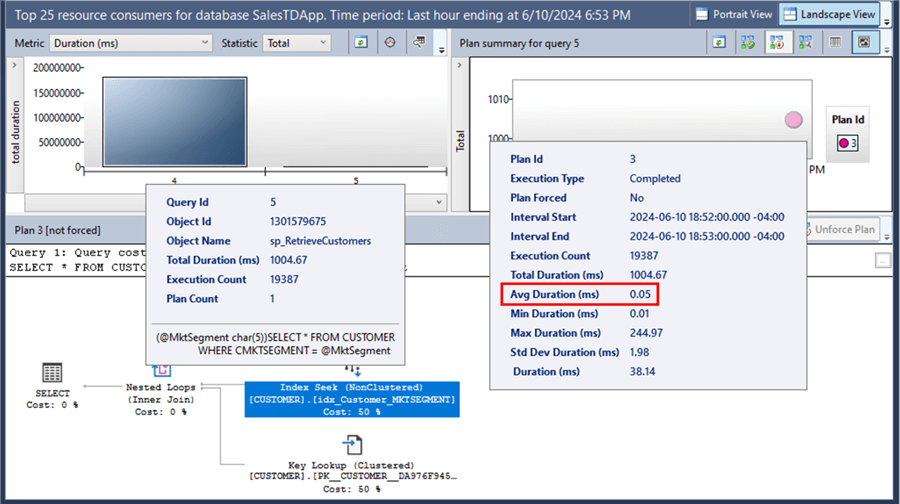
Looking at the dashboard, the average duration is now 0.05 ms, down from 4066.69 ms after adding the non-clustered index - that's more than 81000x faster.
What about the CPU time between the two executions?
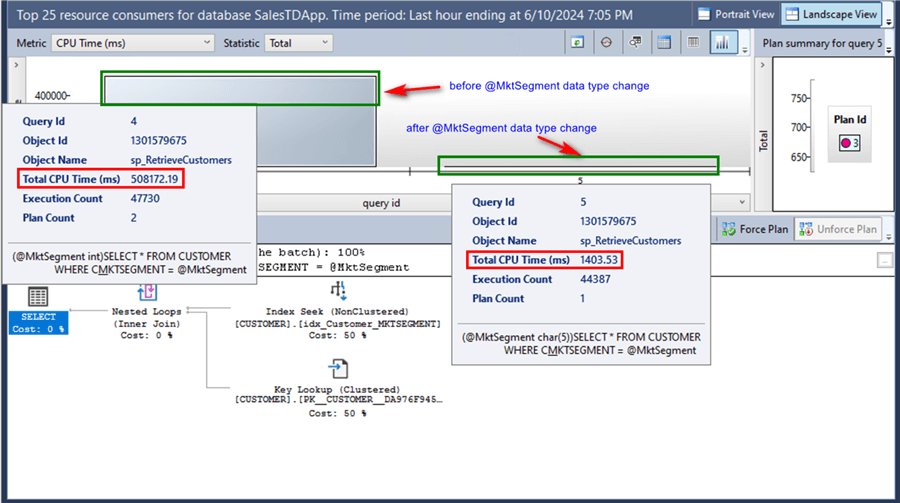
The total CPU time is 1403.53 ms, down from 508172.19 ms - that's 362x faster. This is the kind of improvement we want to see when optimizing a query.
Clearly, eliminating the implicit conversion by changing the stored procedure parameter data type to match that of the column has significantly improved the query and fixed the high CPU utilization. Because of this, it can also take advantage of the non-clustered index created on the C_MKTSEGMENT column.
NOTE: While query tuning and optimization are more complex than this tip outlines, it provides a great starting point concerning how to identify high CPU-consuming queries quickly using the Query Store and the possible fix.
In future tips, we will look at other possible reasons why queries are causing high CPU utilization using the Query Store.
Next Steps
- Explore how to use the Query Store to identify high CPU-consuming queries and how to fix them.
- Read the previous tip on Using Query Store to Identify CPU Intensive Queries: A Tale of Creating Proper Indexes
- Read the previous tip on How to read SQL Server graphical query execution plans.
- Read the previous tips on Implicit Conversion Concerns for SQL Server Performance and Convert Implicit and the related performance issues with SQL Server.
- Read the Microsoft documentation: Monitor performance by using the Query Store.
- Explore more knowledge on SQL Server Query Store Tips.


About the author
 Edwin M Sarmiento is a Microsoft SQL Server MVP and Microsoft Certified Master from Ottawa, Canada specializing in high availability, disaster recovery and system infrastructures.
This author pledges the content of this article is based on professional experience and not AI generated.
View all my tips
Article Last Updated: 2024-09-03