By: Greg Robidoux | Updated: 2024-10-22 | Comments (2) | Related: > Performance Tuning
Problem
How many times have you said "There's got to be a better way."
For years and years, the typical approach for database performance management is to seek out and tune slow queries, add new hardware, address a specific problem that users or management complain about, or randomly pick things that you think you could improve. There is merit to all of these approaches, because in the end they can yield a better product. The one thing that is still unknown is how cost-effective that change was. Sure, there are things you cannot put a dollar value on like making a customer or your boss happy, but there are true costs and benefits associated with tuning databases.
To make enhancements, performance tuning still requires the same steps you have followed to implement improvements, but the real difference is how you can identify what really should be addressed that can have both a performance and financial impact.
In addition, more and more database systems are being implemented or migrated to the cloud. Just about every cloud resource has some cost tied to it and therefore tuning from a cost-based approach can be extremely beneficial.
From a different perspective, we need to stop looking at isolated code sets and address issues from an enterprise level. One possible change could have rippling effects across multiple instances and databases, but typically DBAs approach things one database or instance at a time.
Approaching database tuning with these concepts can be quite difficult, because aggregated data, associated costs, an enterprise view, and the ability to make sense of all of this data are needed.
So, what if there was a way to approach database performance management from a true cost-benefit approach?
Solution
The time has come and Fortified WISdom is a new approach for database performance management. WISdom goes beyond traditional monitoring by connecting performance with cost, resource efficiency, and code optimization, which sets it apart.
WISdom still addresses the concepts of database tuning like blocking, deadlocks, slow queries, wait statistics, etc. but the real difference is helping you identify what changes have both a performance and financial impact across the enterprise, instance or database level.
By addressing performance related issues at both a cost and performance perspective you can improve the overall performance as well as save money which can be used for other projects or tools. Just because a piece of code is slow doesn't always mean that fixing it will yield the biggest cost benefits. By having these additional metrics available, you can start making better decisions on what needs to be optimized.
Let's take a look at some of the features of WISdom.
Enterprise View
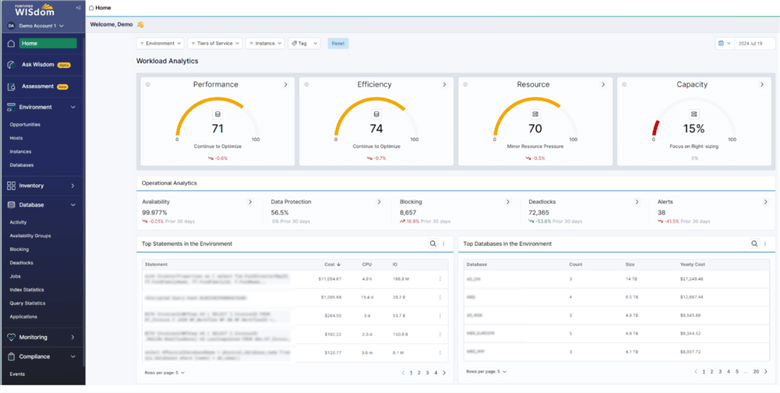
The home screen gives you an overview of your environment, either enterprise wide or a segmented view of servers or databases depending how you configure WISdom and filter the data. This view quickly lets you see how efficient things are and where there is room for improvement, along with the cost of code. So instead of taking the approach of what is the slowest code or what code gets run the most, it lets you also see what code is inefficient from a cost aspect. This lets you look at performance tuning based on what is going to yield the biggest value, not just the fastest code.
The home screen provides key performance indicators, operational stats, top statements with the highest cost as well as the databases with the highest operating costs.
Filtering, Sorting and Grouping Resources

Each part of WISdom allows you to customize your resources so you can sort and filter at the environment, tier, instance, or tag level, basically giving you an easy way to slice and dice your SQL Server inventory based on how you want to view the data. Once your servers have been added and put into the appropriate categories, these breakdowns can be used throughout WISdom.
Workload Analytics
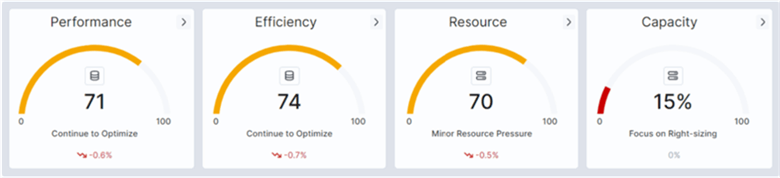
These are key performance indicators that allow you to quickly see the health of your systems. These KPIs are based on how you filter this page, either from an overall view or specific instances you want to focus on. The higher the value, the more optimized your systems are and also the better utilization of available resources.
- Performance – Performance indicates whether your database systems are meeting expected operational benchmarks and handling workloads effectively.
- Efficiency – Measures how optimized your code and queries are in utilizing available resources. Efficiency helps identify areas where processes can be streamlined, reducing execution time, resource consumption, and overall costs while improving performance.
- Resource – Examines how well system resources (CPU, memory, disk I/O) are being consumed and managed. This includes detecting resource contention issues that could slow down database performance and identifying potential inefficiencies in resource allocation.
- Capacity – Evaluates the usage of critical resources (CPU, memory, and storage) against the system's overall capacity. Capacity management highlights whether the system is over-provisioned (wasting resources and increasing costs) or under-provisioned (leading to performance bottlenecks).
Operation Analytics
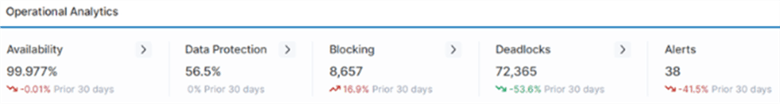
The provides metrics as well as trend information to show if these values are improving or degrading over a specified period of time.
These metrics include:
- Availability – Represents the percentage of uptime for your database servers over a given period, reflecting the reliability and accessibility of your systems. Availability metrics help ensure business continuity and minimize downtime risks.
- Data protection – Refers to the strategies and systems in place for safeguarding data integrity, focusing on backup and recovery mechanisms.
- Blocking – Tracks the frequency and duration of blocking events, where one transaction prevents others from accessing the same data, potentially impacting performance. High blocking occurrences can signal inefficiencies in query design or resource allocation.
- Deadlocks – Monitors the number of deadlock occurrences, where two or more processes block each other indefinitely. Identifying deadlocks helps mitigate critical performance issues that can severely affect system operations.
- Alerts – Represents the number of WISdom-triggered notifications, alerting you to potential issues related to performance, efficiency, resource contention, or other operational thresholds. Alerts provide proactive insights to prevent problems before they escalate.
Top Statements in the Environment
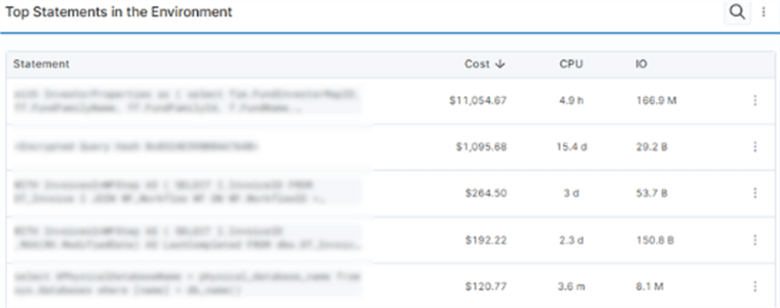
This shows the top SQL statements that should be addressed. In this view the statements are sorted based on overall cost, which is a very different metric than what most DBAs are used to seeing.
Cost is calculated based on resource usage such as CPU, memory, and IO and also how often this piece of code is being used. The costs are based on internal metrics that WISdom provides based on what these resources cost in a cloud environment, but these can also be adjusted for your own particular needs. In addition, the costs take into consideration licensing and cloud costs.
Top Databases in the Environment
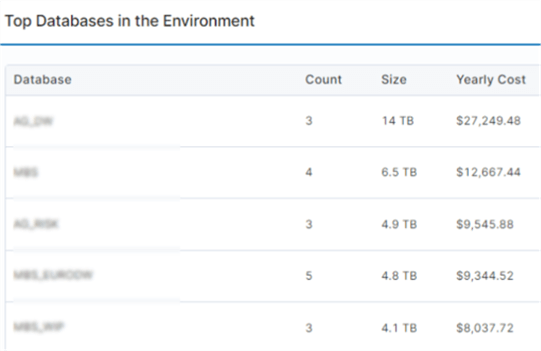
This section provides metrics at a database level and includes how much this database costs based on the same items listed above.
So based on the cost information, you can start looking at database tuning from a completely different perspective.
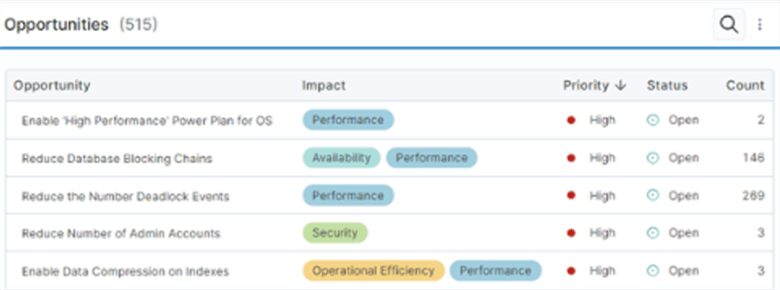
Opportunities
The opportunities screen identifies what items you should address, such as slow code, misconfigured options, blocking or deadlocking issues, resource contention, and more. You can look at this data across the enterprise, segmented servers, databases, etc. This is a great place to start to find recommendations for improvements, versus jumping right into trying to optimize SQL code.
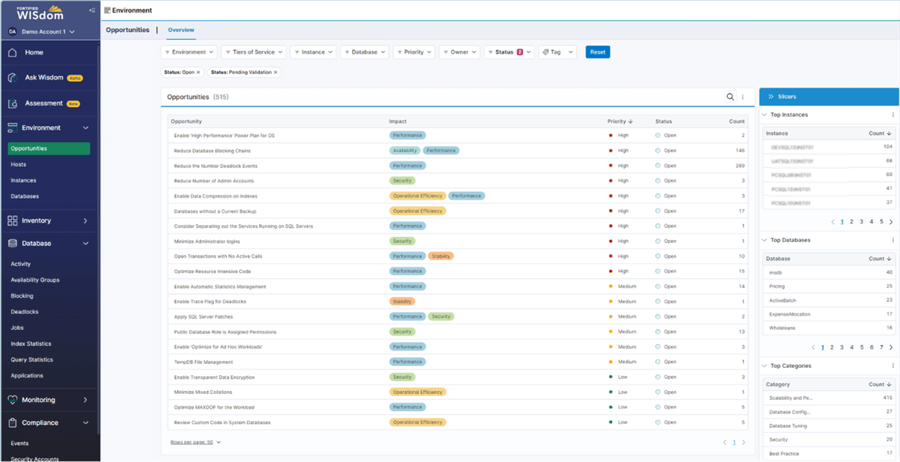
Here is a closer look at some of these opportunities that WISdom identified. These are built-in metrics that WISdom looks for and identifies for each system in your environment. By drilling into these items, you can see what instances, databases, and statements need to be addressed to take care of the recommendation. Some of these items may be obvious, but others are probably things that you are just overlooking or didn't even know they should be addressed.
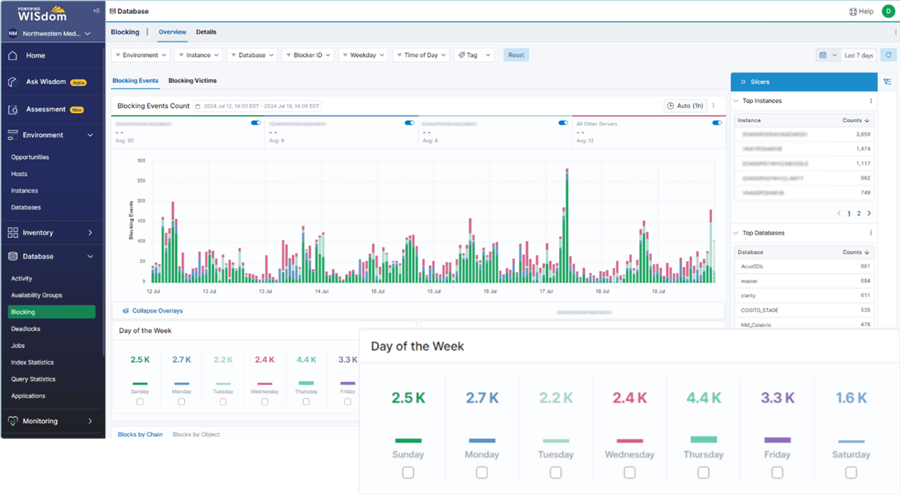
Blocking
Locking and blocking are built in features in SQL Server to ensure data integrity. When there is excessive blocking, this causes slowdowns and inefficiencies. WISdom allows you to see blocking information such as lead blockers, victims, etc. but you can also get aggregated data for the day of the week and time of day to help you focus on what blocking issues can be fixed that will yield the biggest payback.
You can drill into these blocking issues to help you see what code is causing the issues and what can be done to modify the code to reduce the occurrences and length of blocking.
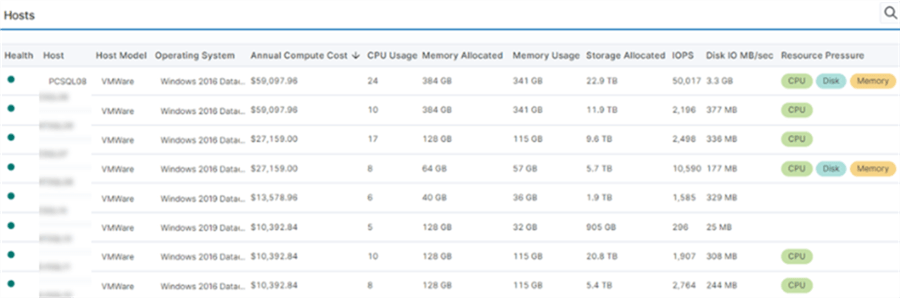
Inventory Management
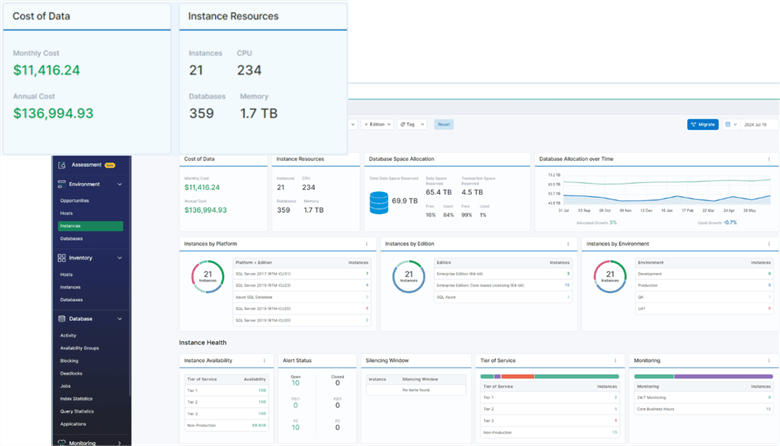
This page allows you to see your overall environment and some key metrics such as cost, resource usage and resource pressure. From this view, WISdom provides overall costs of running this instance, resource usage and resource pressure.
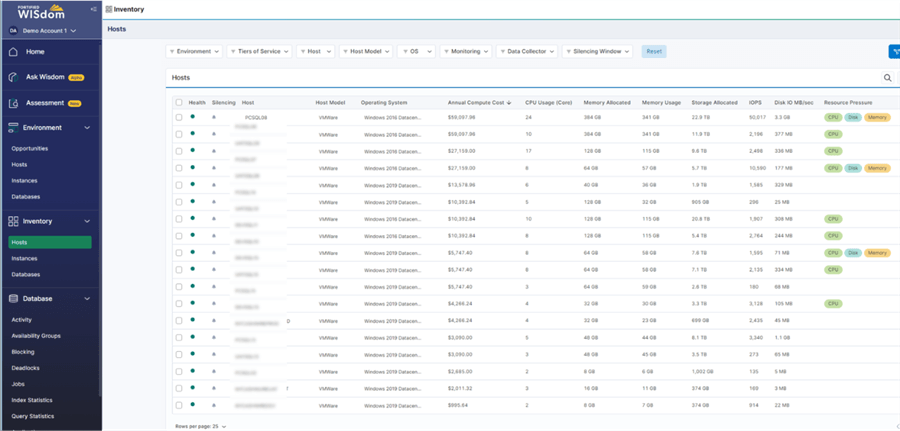
If we look closer, we can see the "Annual Compute Cost" column. This is determined by the same metrics discussed earlier in the article and this allows you to see which systems have the biggest cost impact. Also, another important column is the "Resource Pressure" where you can see potential bottlenecks at the resource level for each instance. So, if you are able to reduce the resource pressure and optimize the instance you can reduce the resources that are allocated and therefore improve performance and reduced operating cost.
Query Statistics
To optimize poor performing code, you first need to find the problematic code. WISdom not only provides information about each statement, along with the cost of these statements, you also get some high-level workload analytics.
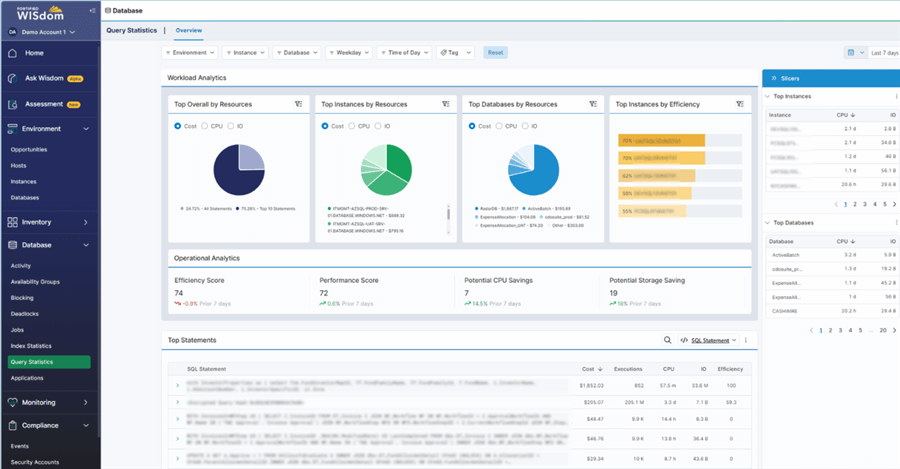
Here is a close-up of these metrics. The "Top Overall by Resources" chart below shows that the Top 10 statements are utilizing 75% of the resources. This can be looked at from a cost, CPU or IO perspective. In addition, the "Top Instances by Resources" shows which instances are using the most resources.
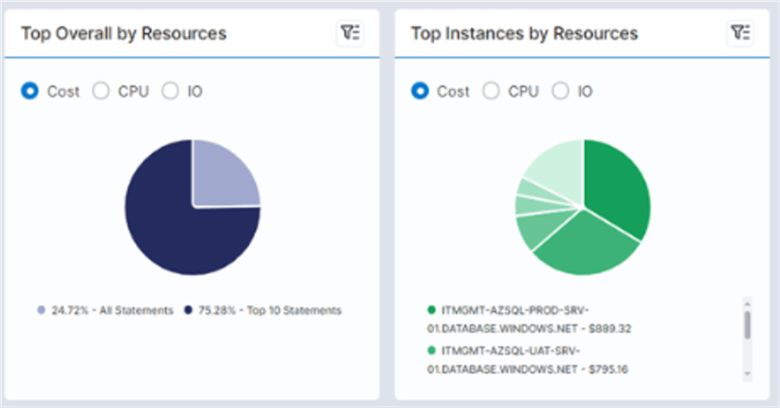
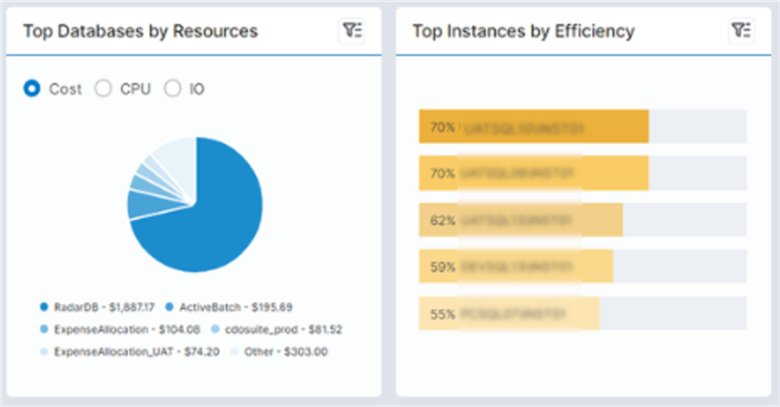
Here are some additional views based on databases and efficiency.
Reporting
There are several reporting metrics that WISdom provides to help you better manage your SQL Server environment as well as provide necessary reporting metrics for management, planning and identifying opportunities for cost reduction and performance improvements.
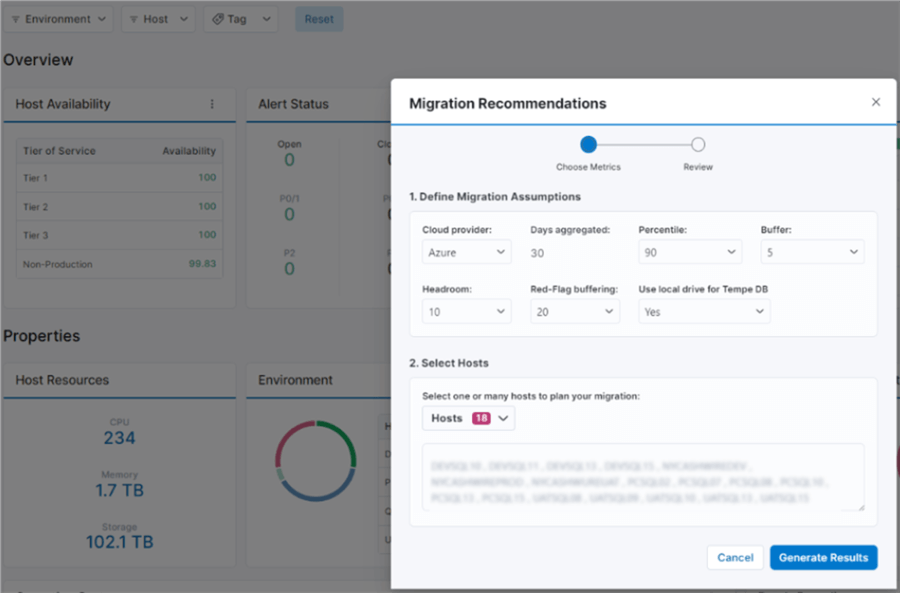
Cloud Migration Recommendations
As we all know, there has been a huge shift towards cloud-based computing and running database systems in the cloud. The infrastructure is already in place, so provisioning a new server can be very fast. Also, the cloud offers the ability to quickly scale up or down depending on the compute needs. The downside is that these added features come at a cost. So, before migrating to the cloud WISdom can help you determine the cost of migration based on its internal pricing metrics that it uses based on real costs of using resources in AWS or Azure and also based on your past resource usage to give you a better sense of the migration costs before you actually make the move.
Summary
We covered just a few of the features of WISdom to give you an idea of some of the differences that exist compared to other performance tuning approaches. There are many other features that we have not explored, so take some time to learn how you can approach database performance management from a cost / performance perspective.
WISdom is new to the database market and with that, this allows Fortified to take a different approach to addressing performance management for SQL Server environments. Most tools take the same approach for performance monitoring and tuning and now there is a better way.
WISdom is completely cloud and browser based, so you can get up and running quickly and also manage your SQL Server environment from anywhere. Also, since it is cloud based you are always guaranteed to have the latest version and features.
Whether your SQL Servers exist in Azure, AWS or on-premises, WISdom has you covered.
Next Steps
If you're curious to see how Fortified WISdom can transform your data management and optimization, we highly recommend joining a Live Public Preview. It's a great opportunity to see the tool in action, explore its features, and ask any questions you may have. Click here to register.
About the author
 Greg Robidoux is the President and founder of Edgewood Solutions, a technology services company delivering services and solutions for Microsoft SQL Server. He is also one of the co-founders of MSSQLTips.com. Greg has been working with SQL Server since 1999, has authored numerous database-related articles, and delivered several presentations related to SQL Server. Before SQL Server, he worked on many data platforms such as DB2, Oracle, Sybase, and Informix.
This author pledges the content of this article is based on professional experience and not AI generated.
View all my tips
Article Last Updated: 2024-10-22