By: Rajendra Gupta | Updated: 2024-10-15 | Comments (2) | Related: > Python
Problem
Have you heard about Pandas in Python? It is widely used open-source library for analyzing and manipulating data in the Python programming language. Let's explore it with use cases and examples.
Solution
Pandas is a revolutionary, open-source library for analyzing and manipulating tabular data in Python. Pandas is built on the NumPy library and is used for data cleaning, data manipulation, data analysis, data visualization, and time series data.
A few key features of Pandas library are:
- Offers simpler syntax with rich functionality to deal with data structures in a straightforward manner valuable for data science and machine learning.
- Can integrate with various data formats, such as Excel files, CSV files, and SQL databases, with multiple data sources increasing flexibility.
- Provides rich support for data cleansing and transformations, such as finding invalid and missing values, duplicates in additionl to group by and sorting data logic.
- Works with incomplete datasets with data handling and alignment with existing values.
- Integrates with Python libraries for advanced calculations, such as MatPlotlib and Scikit-Learn.
Let's start exploring Pandas in Python with various use cases valuable for beginners and experienced developers.
Installing Pandas Module
Run the command below and it will install the latest version of Pandas and its dependencies.
pip install pandas
To verify the Pandas installation, import it and check the version using the code below. If it is not installed, an error will be returned.
import pandas as pd
print("Pandas version", pd.__version__)

Pandas Series
This one-dimensional array can hold any data type, such as integer, float, or string. We can use the function pd.series to create the series().
mydata = ['Apple','Banana','Orange']
s = pd.Series(mydata)
print(s)
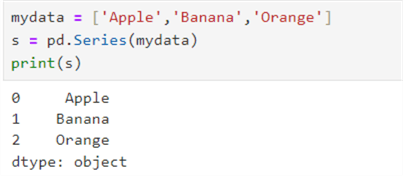
Pandas data frame default indexing starts with 0,1,2, and so on. You can create a Pandas series with a custom index as well.
mydata = ['Apple','Banana','Orange']
s = pd.Series(mydata,index=['Fruit1','Fruit2','Fruit3'])
print(s)

Arithmetic Operations
You can perform the arithmetic operations and filter on the series.
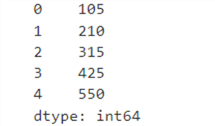
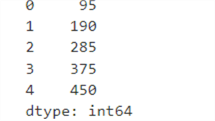
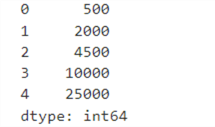
First, let's create two series, s1 and s2, as shown below.
s1 = pd.Series([100, 200 , 300 , 400, 500])
s2 = pd.Series([5, 10, 15, 25, 50])
Addition
print(s1 + s2)
Subtraction
print(s1 - s2)
Multiplication
print(s1 * s2)
Division
print(s1 / s2)
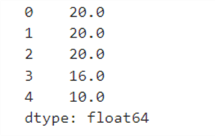
Similarly, the aggregations, such as sum, mean, median, and standard deviation, are performed in a series as follows.
| Aggregation | Code | Output |
|---|---|---|
| Sum | print(s1.sum()) | 1500 |
| Mean | print(s1.mean()) | 300.0 |
| Median | print(s1.median()) | 300.0 |
| Standard deviation | print(s1.std()) | 158.11388300841898 |
| Min | print(s1.min()) | 100 |
| Max | print(s1.max()) | 500 |
Indexing and Slicing
The Pandas series elements start with index position 0. You can access an element based on its indexing position.
| Aggregation | Code | Output |
|---|---|---|
| First element | print(s1[0]) | 100 |
| Second element | print(s1[1]) | 200 |
Pandas Dataframe
Organized into rows and columns, a dataframe consists of data that is:
- Two-dimensional,
- Mutable (size can be changed or modified after it is created) and
- Heterogeneous (can hold different types of data in the same structure).
You can create a dataframe from a list, dictionary, or NumPy array.
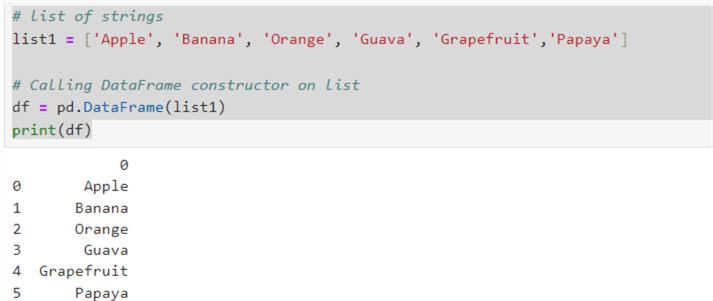
For example, the code below shows a list of strings and uses the pd.dataframe() function to construct a Pandas dataframe.
# list of strings
list1 = ['Apple', 'Banana', 'Orange', 'Guava', 'Grapefruit','Papaya']

# Calling DataFrame constructor on list
df = pd.DataFrame(list1)
print(df)
Similarly, the example below creates a dataframe from a list of lists. The pd.dataframe() also contains the column names for the mapping.
data = [
    ['Raj', 31, 'India'],
    ['John', 25, 'New Jersey'],
    ['Peter', 29, 'Chicago']
]
df = pd.DataFrame(data, columns=['Name', 'Age', 'City'])
print(df)
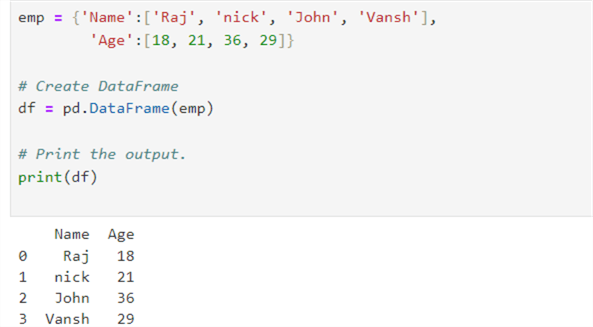
You can create a dataframe from the dictionary, as shown in the following code.
emp = {'Name':['Raj', 'nick', 'John', 'Vansh'],
        'Age':[18, 21, 36, 29]}

# Create and print DataFrame
df = pd.DataFrame(emp)
print(df)
Let's explore a few useful functions to work with the Pandas dataframe.
df.head(n)
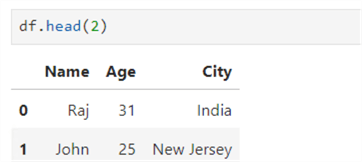
This function returns the first n number of rows from the dataframe. For example, specify df.head(1) to get the first row. If we do not specify a value, it returns the first five rows from the dataframe by default.
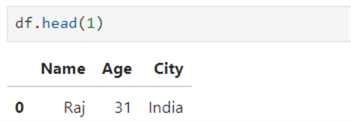
Similarly, to get the first two rows, specify df.head(2).
df.tail(n)
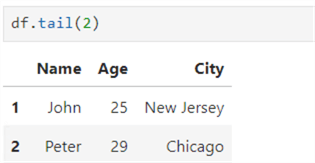
The next function returns the n number of rows from the bottom. For example, df.tail(n) returns the last two rows from the dataframe. It returns the last five rows if no value is specified in the tail() function.
Get a Specific Row from the Dataframe
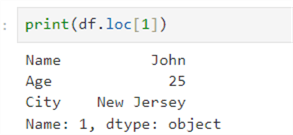
The df.head() and df.tail() returns rows from the top or bottom of the dataframe. However, suppose you need a specific row based on its index position. You can use the df.loc[index] function. For example, suppose we need to get the second row from the dataframe:
print(df.loc[1])
Boolean Indexing
Suppose we have a large employee dataframe, but we are interested in only those employees whose age is greater than 30 years. In this case, we can use the Boolean indexing shown below.
print(df[df['Age']>30])

df.describe()
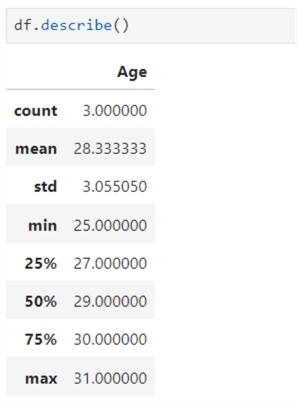
This function returns helpful information about the data in the dataframe. For example, as seen below, it returns count, mean, standard deviation, minimum, 25th percentile,50th percentile,75th percentile, and maximum value.
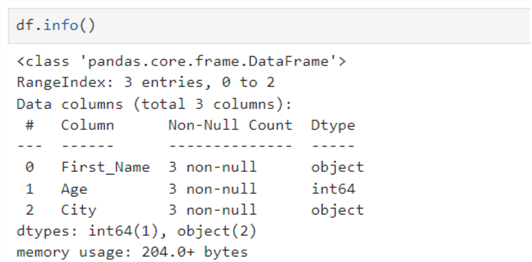
df.info()
This is another function, and it returns data frame details, such as the data types, size, total number of columns, count of non-null values for each column, index range of the dataframe, showing the starting and ending index values, and memory usage.
Selecting a Specific Column or Multiple Columns
We can specify the columns required in the output to fetch those columns instead of all the columns. For example, if your dataframe consists of 50 columns, and you need three columns in the output, you can specify those columns by name.
- df['Name'] returns only the Name column from the data frame.
![df['Name']](/tipimages2/8110_pandas-in-python-17.png)
- df[['Name','City']] returns the name and city columns from the data frame.
![df[['Name','City']]](/tipimages2/8110_pandas-in-python-18.png)
Add a New Column in the Existing Dataframe
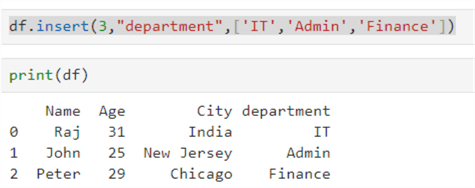
Let's add a new column, department, in the existing dataframe. We can use the df.insert() function with the following arguments:
- Column position
- It is the index position in the dataframe where we want to add the new column. So, my dataframe consists of three columns, and to add the new column in the last position, I need to specify the index position as 3.
- Column name
- Values
df.insert(3,"department",['IT','Admin','Finance'])
print(df)
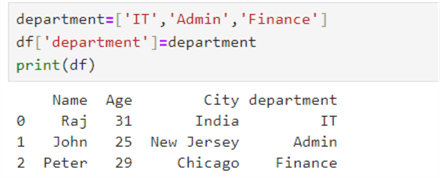
Alternatively, you can add a new column using the list below.
department=['IT','Admin','Finance']
df['department']=department
print(df)
Drop the Column
We can use the function df.drop('column') to drop one or multiple columns from the Pandas dataframe. Specify the parameter inplace=true to do the operation and return the modified data frame.
df.drop('department', axis=1, inplace=True)
print(df)

Rename a Column
To rename a dataframe column, use the function df.rename() like so:
df.rename(columns={'old_name': 'new_name'}, inplace=True)
Let's rename the column Name to FirstName.
df.rename(columns={'Name':'First_Name'},inplace=True)
print(df)

Modify an Existing Value
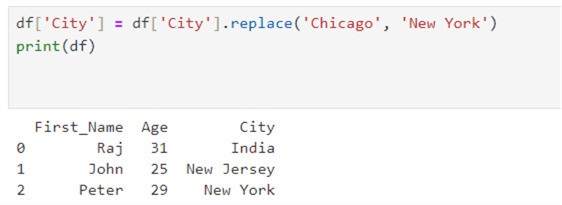
Suppose Peter is transferred to New York, and you need to update the value in the dataframe. To update the value, use the replace function as below.
df['City'] = df['City'].replace('Chicago', 'New York')
print(df)
Insert New Data in the Existing Dataframe
We can use the concat() function to insert a new row in the Pandas dataframe.
new_row = pd.DataFrame({'Name': ['David'], 'Age': [40], 'City': ['Houston']})

# Appending the new row to the DataFrame using pd.concat
df = pd.concat([df, new_row], ignore_index=True)
print(df)

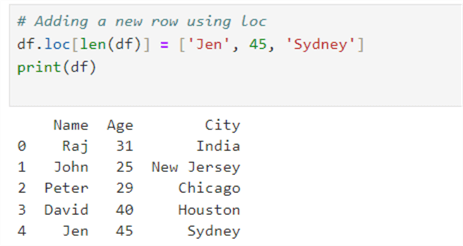
We can also use the loc indexer to insert a new row.
# Adding a new row using loc
df.loc[len(df)] = ['Jen', 45, 'Sydney']
print(df)
Delete a Row
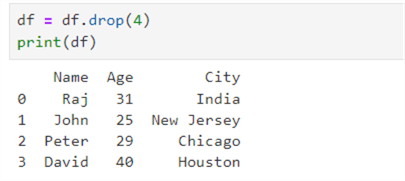
We can use df.drop() function to delete a row from the dataframe. Let's drop the row for Jen with index position 4.
df = df.drop(4)
print(df)
Or use the following method to delete a row based on its value:
- df['Name'] != 'Peter' creates a boolean series for all rows where the Name is not 'Peter'.
- df[df['Name'] != 'Peter'] filters the dataframe to keep only those rows where the Boolean series is True.
df = df[df['Name'] != 'Peter']
print(df)
Suppose you have the below dataframe. Here, there are two Peters, one from Chicago and the other from Sydney.
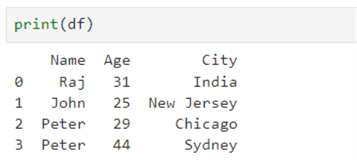
To delete Chicago Peter's record, specify the condition with the Boolean operator. The relevant row is removed from the dataframe if the condition is satisfied.
df = df[~((df['Name'] == 'Peter') & (df['City'] == 'Chicago'))]
print(df)

Next Steps
- We will identify and explore more cases of Pandas dataframe use. Stay tuned for more Python tutorials.
- Explore more Python tips on MSSQLTips.
About the author
 Rajendra Gupta is a Consultant DBA with 14+ years of extensive experience in database administration including large critical OLAP, OLTP, Reporting and SharePoint databases.
This author pledges the content of this article is based on professional experience and not AI generated.
View all my tips
Article Last Updated: 2024-10-15


