By: Edwin Sarmiento | Updated: 2024-10-30 | Comments (1) | Related: > Query Store
Problem
Using a previous tip, we learned how to enable Query Store to find the top resource consumers. This past week, we noticed one of our applications started performing poorly. How can we use Query Store to find out the performance history of the application queries so we can begin tuning them?
Solution
As described in the tip SQL Server 2016 Query Store Introduction, you can identify the performance history of your queries if you've enabled the Query Store in your database. In another tip, Using Query Store to Identify CPU Intensive SQL Queries and Creating Proper Indexes, you used the Top Resource Consuming Queries report as a starting point for identifying queries that are taking up a lot of resources.
One clue that a query performance changed – either improved or worsened – is the presence of multiple execution plans. An example of a query with multiple execution plans is shown below. This example uses the modified version of the AdventureWorks database using Adam Machanic's script.
Looking at the timestamp, you can see the history of the query with different execution plans, giving you the performance history of the query.
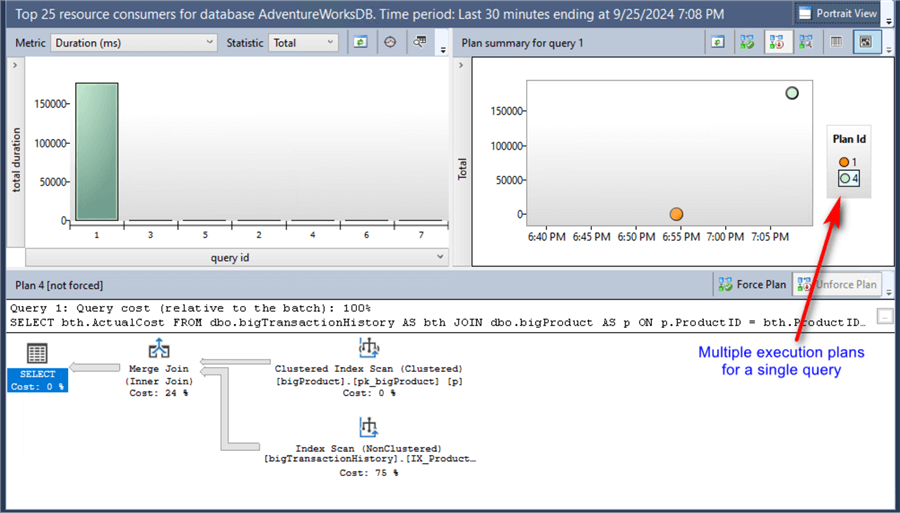
A common reason for this is a parameter sniffing issue, described in Analyzing SQL Server Performance Impact of Parameter Sniffing article.
Looking at the history of the query execution, you can compare the two execution plans. The screenshot below is edited to compare the execution plans' metrics side-by-side.
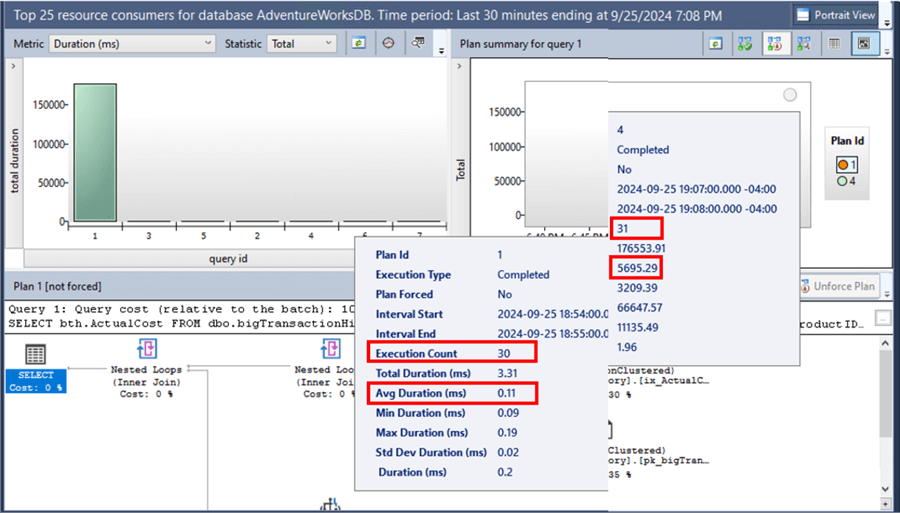
- Plan Id 1:
- The query was called 30 times.
- The average duration (ms) during the execution is 0.11.
- Plan Id 4:
- The query was called 31 times.
- The average duration (ms) during the execution is 5695.29.
That's a huge difference in the average duration between the two plans.
Using the Regressed Queries Report to Identify Queries with Multiple Plans
Another way to identify queries with multiple execution plans is using the Regressed Queries report.
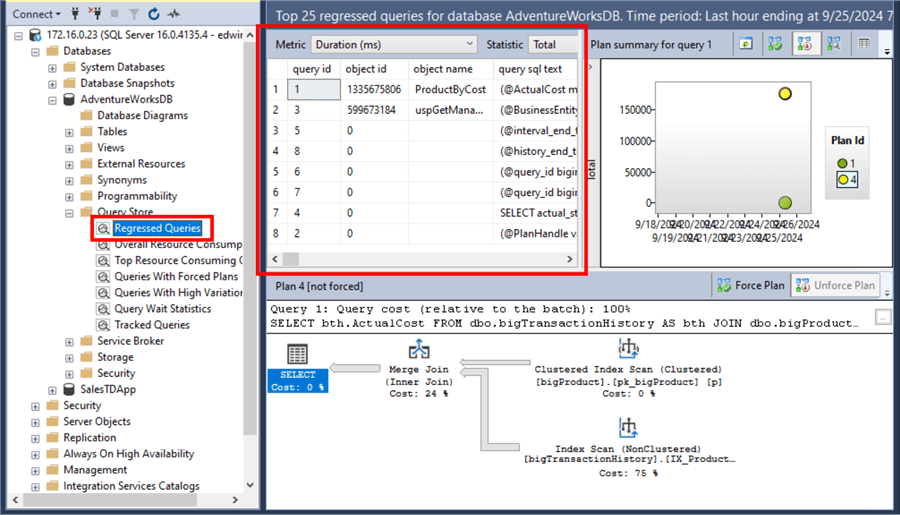
But, instead of using the default graph view, switch to the grid format that provides additional details.
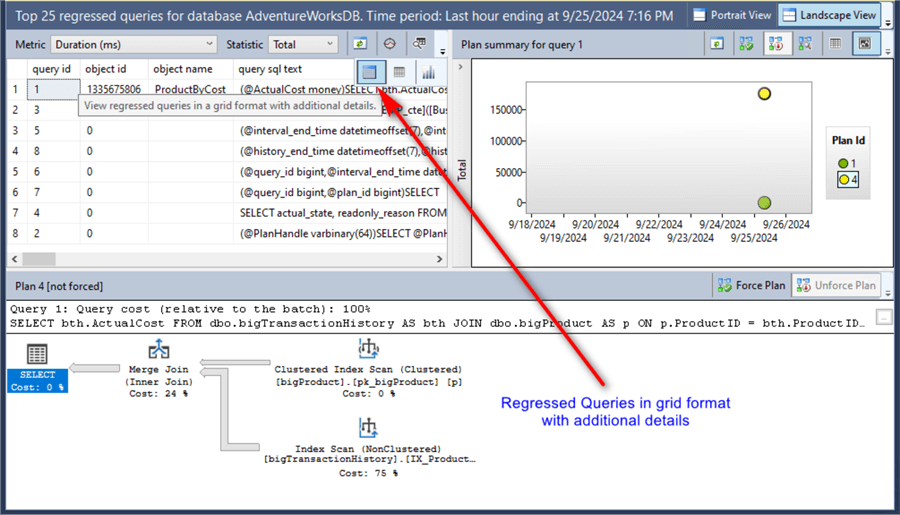
You can find queries with multiple execution plans when you scroll to the plan count column.
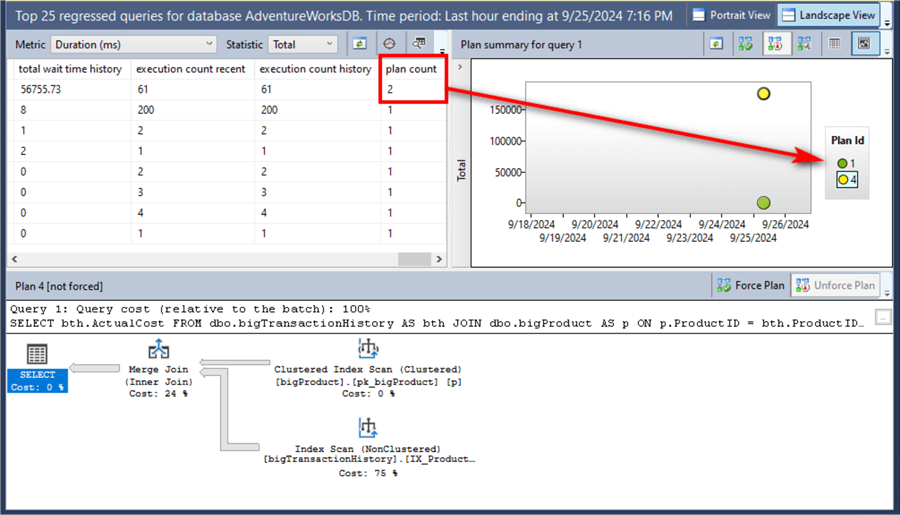
Now that you've seen the performance history of the queries, the next step is to compare the execution plans and figure out a way to improve the query.
Comparing Execution Plans
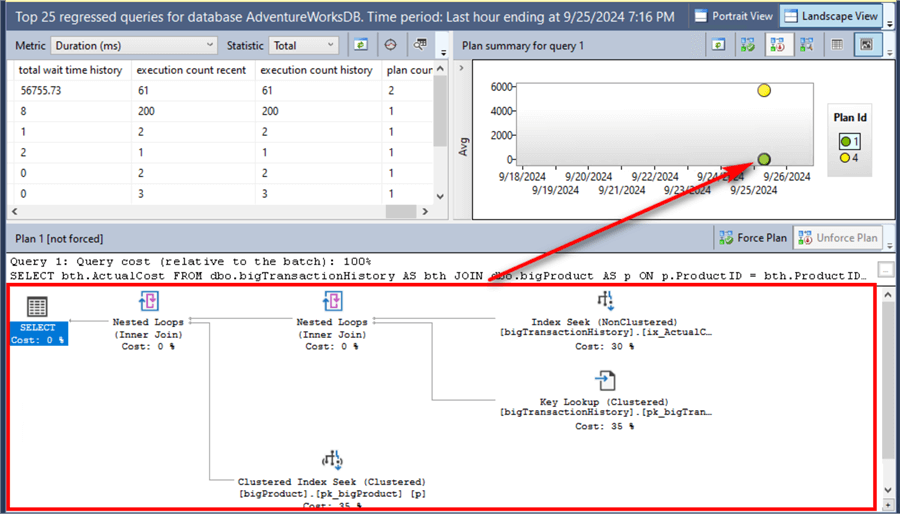
You can manually compare the execution plans by clicking on each individual plan and looking at the graphical query plan.
Plan Id 1, the one with the average duration (ms) of 0.11 during the execution, shows an execution plan with an Index Seek, Key Lookup, Nested Loops, and Clustered Index Seek operators.
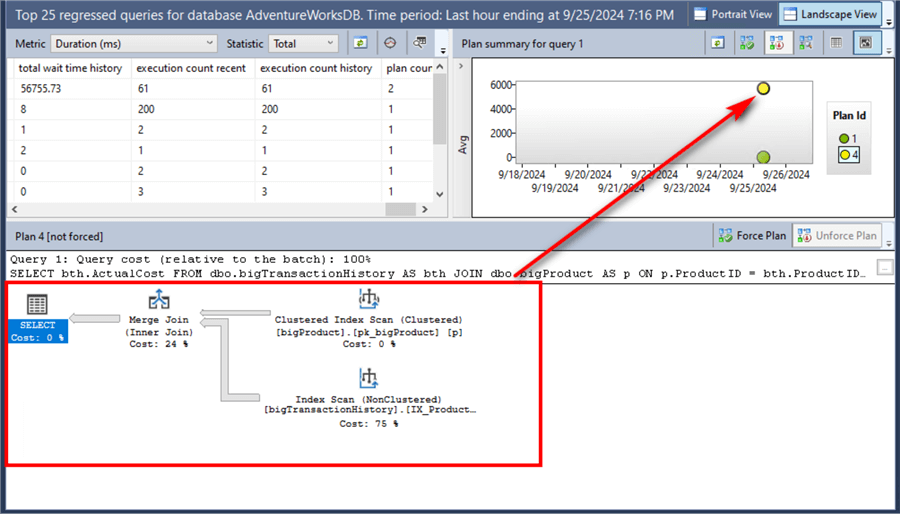
Plan Id 4, with the average duration (ms) of 5695.29 during the execution, shows an execution plan with an Index Scan, a Clustered Index Scan, and a Merge Join operators.
Refer to this tip to analyze the execution plans further: How to read SQL Server graphical query execution plans.
A better way of comparing the two execution plans is by selecting both and choosing the option to compare the plans for the selected query.
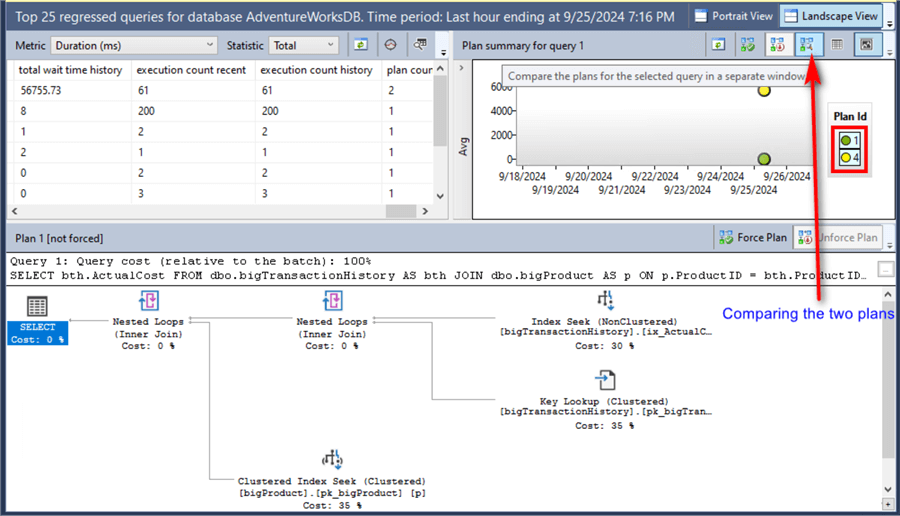
This will open two windows: the Showplan Comparison and the plans' Properties windows.
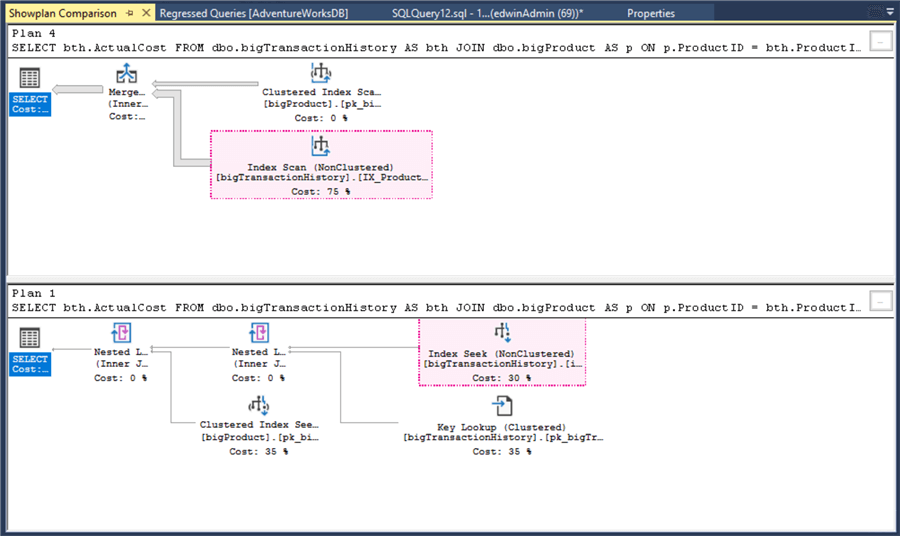
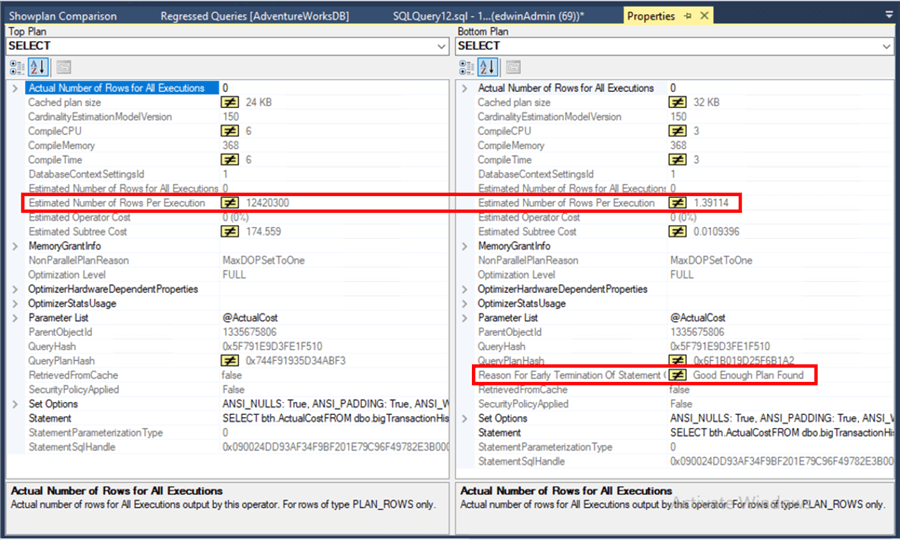
You can move the Properties window beside the Showplan Comparison window to select any operator and compare the difference between the two.
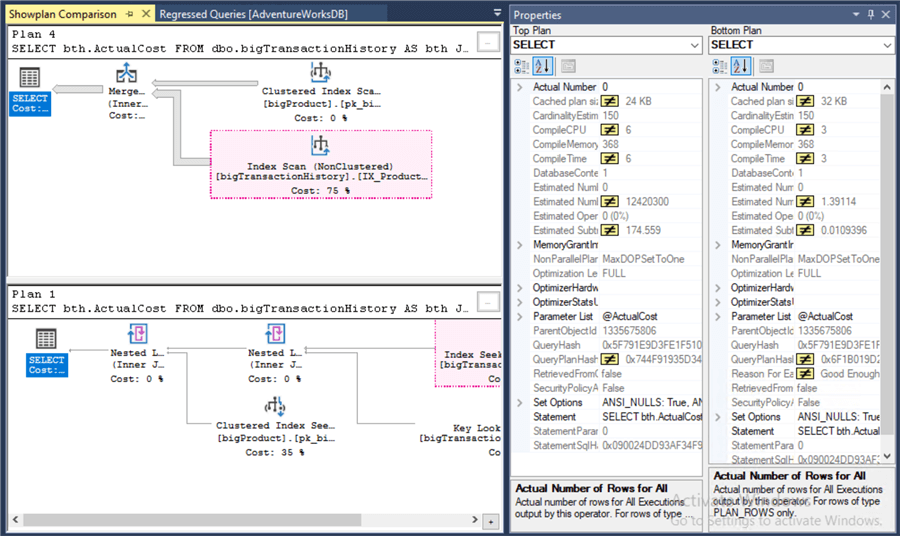
I highlighted two properties of the SELECT operator on both plans for comparison:
- Estimated number of rows per execution. Plan Id 1 has a value of 1.39114 compared to Plan Id 4, with a value of 12420300.
- Reason For Early Termination of Statement Optimization. Plan Id 1 has a value of Good Enough Plan Found. Plan Id 4 has none.
Based on the metrics retrieved from the execution plans, Plan Id 1 is clearly the better plan for this query.
As a temporary fix, you can force Plan Id 1 for this query as described in the tip Plan Forcing with the Query Store in SQL Server 2016. I say temporary because SQL Server's choice of execution plan is affected by statistics, schema changes (adding or removing indexes), or data distribution. As a DBA, you need to constantly monitor query performance and implement the proper optimization where applicable.
NOTE: In SQL Server 2017 and higher, you can use the sys.dm_db_tuning_recommendations DMV to get detailed recommendations for automatic tuning. The query below generates the T-SQL script to force a good plan for a query Id value of 1.
SELECT
   JSON_VALUE(details, '$.implementationDetails.script') AS script,
   reason,
   score,
   details.*
FROM sys.dm_db_tuning_recommendations
CROSS APPLY OPENJSON(details, '$.planForceDetails') WITH (
        [query_id] INT '$.queryId',
        regressed_plan_id INT '$.regressedPlanId',
        last_good_plan_id INT '$.recommendedPlanId'
        ) AS details
WHERE JSON_VALUE(STATE, '$.currentValue') = 'Active'
AND [query_id]=1;
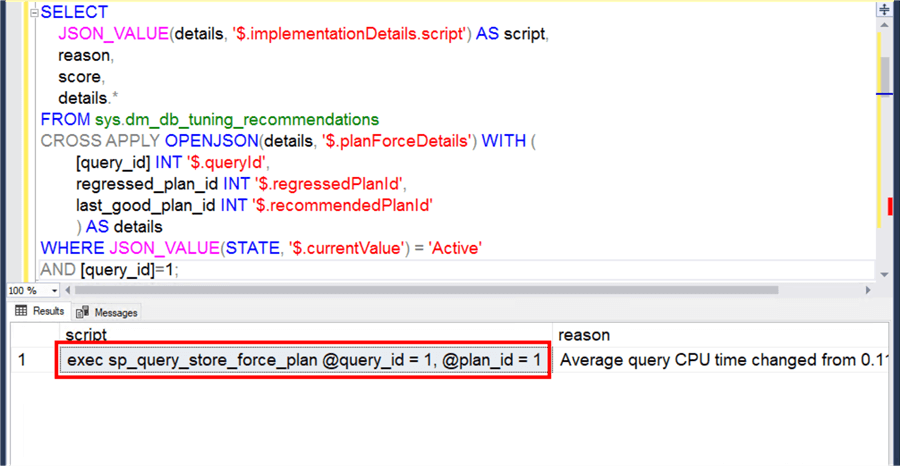
Notice that the automatic tuning recommendation is to force Plan Id 1 for query Id value of 1.
Next Steps
Explore how to use the Query Store to identify performance histories of queries and how to fix them.
- Read the previous tip on How to read SQL Server graphical query execution plans
- Read the previous tip on Analyzing SQL Server Performance Impact of Parameter Sniffing
- Read the previous tip on Different Approaches to Correct SQL Server Parameter Sniffing
- Read the Microsoft documentation: Monitor performance by using the Query Store
- Explore more knowledge on SQL Server Query Store Tips
About the author
 Edwin M Sarmiento is a Microsoft SQL Server MVP and Microsoft Certified Master from Ottawa, Canada specializing in high availability, disaster recovery and system infrastructures.
This author pledges the content of this article is based on professional experience and not AI generated.
View all my tips
Article Last Updated: 2024-10-30


