By: Koen Verbeeck | Updated: 2024-12-17 | Comments | Related: > Power BI
Problem
Since the days of Analysis Services Multidimensional, we could create perspectives on our cubes. A perspective provides the opportunity to show only a selection of items (facts, dimensions, or measures) to a user. In Analysis Services Tabular, the same functionality is also available, and it helps to make complex models more digestible for end users. Right now, we have a big model in Power BI that covers different domains of our organization. We would like to create perspectives too, but is this even possible in Power BI?
Solution
Perspectives are an interesting method to divide a complex model or cube into different "subsections" by hiding objects such as tables or measures, that make the model more comprehensive for end users. For an introduction to perspectives in Analysis Services Multidimensional, check out the tip SQL Server Analysis Services Perspectives. Reference this image from that tip as a point of reference:
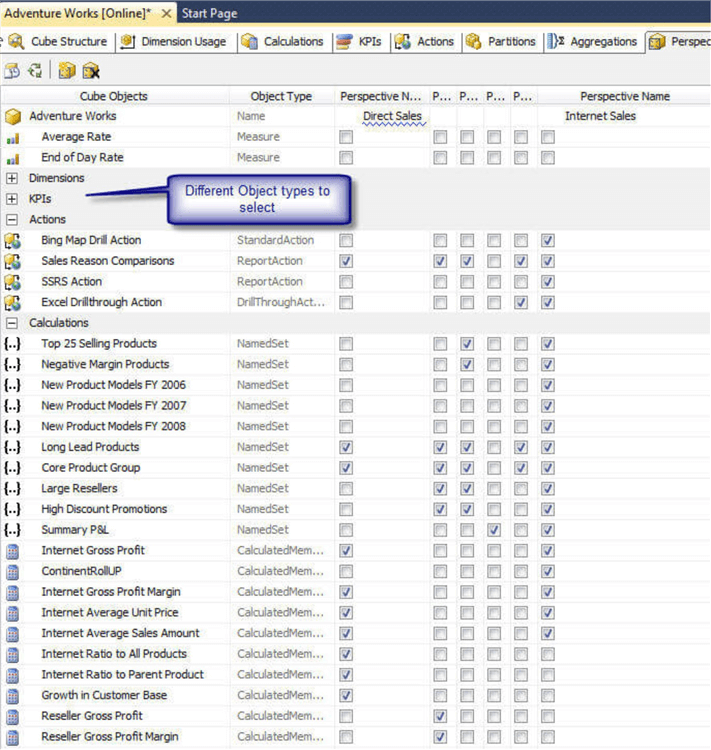
For Tabular models, you can read more about them in the official documentation. It's important to note that perspectives are a usability feature, not a security feature. Anyone with access to a perspective also has access to the underlying model. If they can write a DAX query, they can still query all the tables, even if they're not visible in the perspective.
Perspectives are supported in Power BI, but it's not immediately clear how to implement or use them because of poor support in Power BI Desktop and front-end tooling. In the documentation, perspectives are only used when users personalize visuals. However, we are interested in using perspectives to connect to a live semantic model in the Power BI service with Power BI Desktop, or when using the "Analyze in Excel" feature. In this tip, we'll show you how to create perspectives and how to access them in both scenarios.
Using Perspectives in Power BI
Create a Sample Model
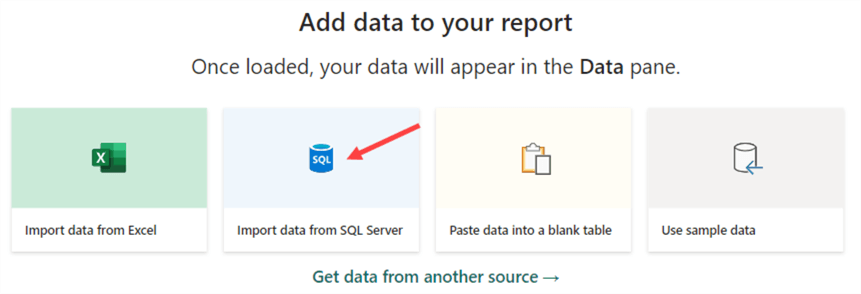
We will be creating a Power BI semantic model using the AdventureWorks data warehouse sample database. In a blank Power BI Desktop file, choose to import data from SQL Server:
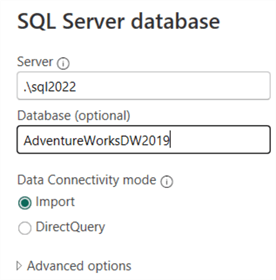
Specify the correct server and database name, and choose Import mode.
From the Navigator, the following tables are imported: DimDate, DimEmployee, DimProduct, DimProductSubcategory, DimProductCategory, DimReseller, DimSalesTerritory, FactInternetSalesand FactResellerSales.
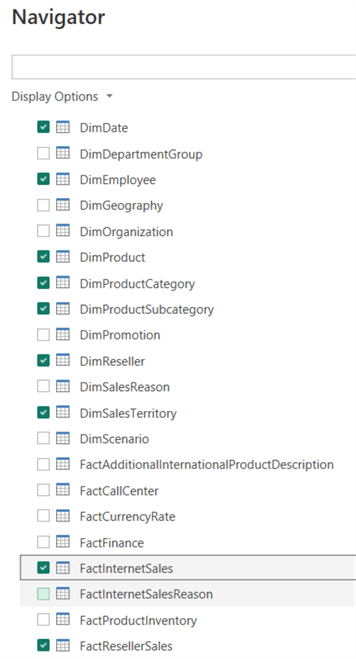
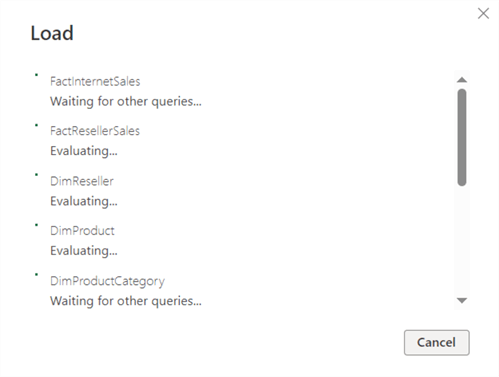
Load the tables into your model.
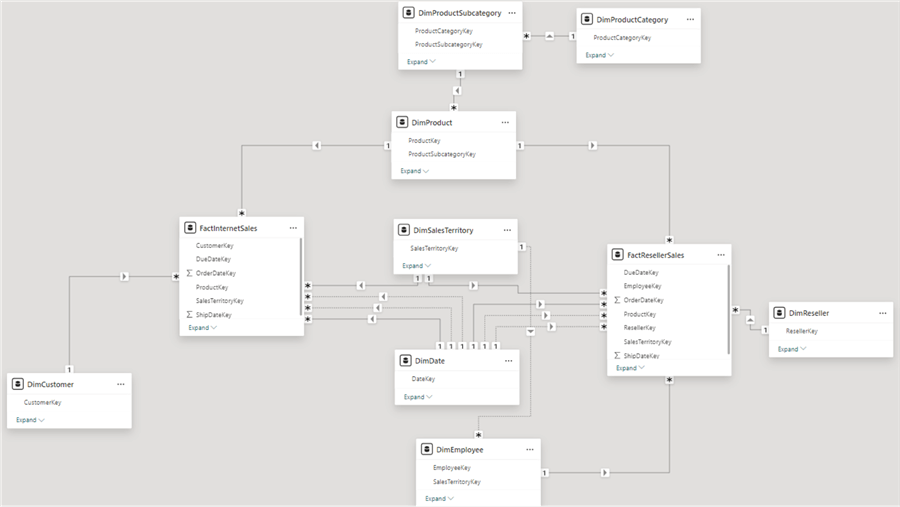
Depending on your settings, Power BI Desktop will automatically create relationships between the imported tables. In the end, your model should look like this:
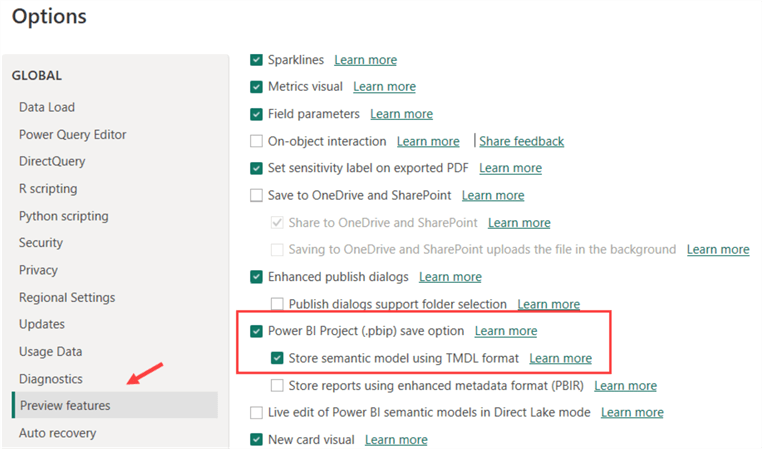
Save the model as a Power BI Project. Note: You may need to enable this feature in the preview features in the Power BI Desktop options).

Also, enable the setting to save the model definition as TMDL files.
Create Perspectives Using Tabular Editor
Power BI Desktop currently doesn't support creating perspectives directly. To create them, you need to use Tabular Editor, a third party tool widely used to manage large and complex Power BI and SSAS Tabular models. Tabular Editor comes in two flavors:
- Tabular Editor 3 is a paid product with extensive features for managing models.
- Tabular Editor 2 is a free, open-source product with basic functionality. Everything needed to create perspectives is available in this version.
For this tip, Tabular Editor (TE) v2.25.0 has been used to create the screenshots. If you have Tabular Editor 3 at your disposal, you should be able to achieve the same results.
When you have TE installed on your machine, Power BI Desktop will recognize and add it to the External Tools ribbon:
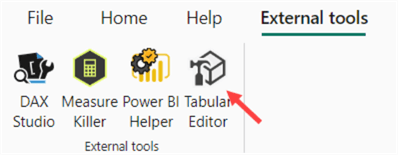
With Power BI Desktop open, click on the TE icon, and it will open it with a connection to your Power BI Desktop model automatically set.
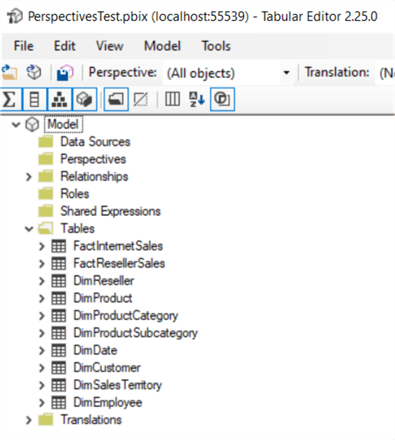
Right-click on the Perspectives folder and choose to create a new perspective.

Create two perspectives, naming them "Internet Sales" and "Reseller Sales".
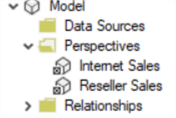
Unfortunately, in Tabular Editor 2, there isn't a friendly user interface to easily add multiple objects to a perspective (like in the first screenshot of this tip). For certain items (table, column, or measure), you need to set which perspective it belongs to in the properties. In Tabular Editor 3, this is more convenient.
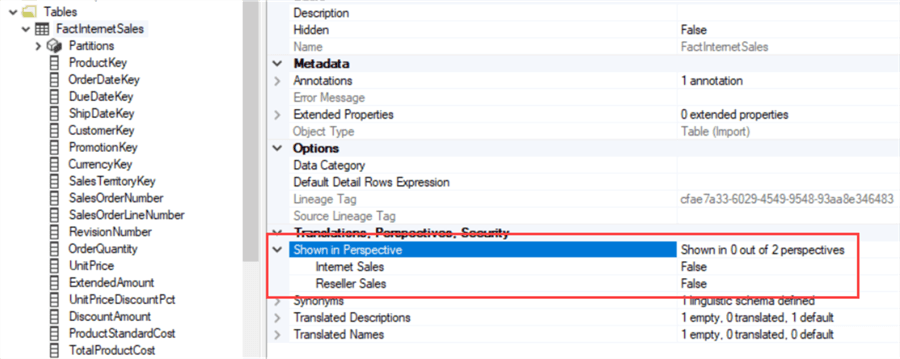
By setting the property "Shown in Perspective" to true for a certain perspective, you will add this item to that perspective.

If you set this property to true on a table, all child items of the table (columns and measures) will be added to the perspective, saving you considerable time. Afterward, you can still change the property on individual items to remove them from the perspective. You cannot change the property when you have multiple items selected. But, you can right-click the selection and add those items to a perspective from the context menu:
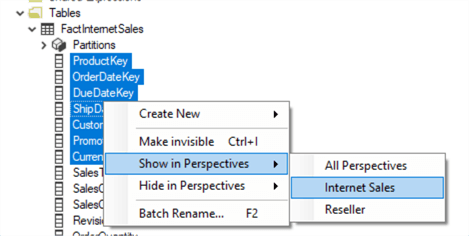
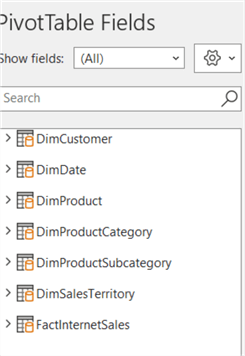
The Internet Sales perspective contains the Fact Internet Sales table and the Product, Subcategory, Category, Date, Customer, and Sales Territory dimensions. The Reseller Sales perspective contains the Fact Reseller Sales table and the Product, Subcategory, Category, Date, Reseller, Employee, and Sales Territory dimensions. Save the model in Tabular Editor. This will write the changes to the Power BI model. Don't forget to save in Power BI Desktop as well.

When we look in the folder where the Power BI Project is stored, we can see a subfolder has been added for the perspectives:
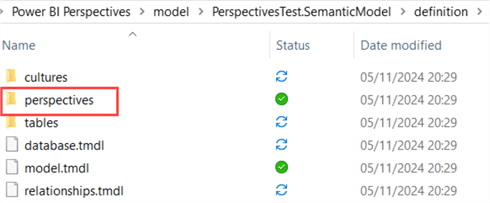
It will contain two TMDL files, one for each perspective:

When you open such a file, you can see the name of the perspective, along with objects that have been added to it, organized per table:
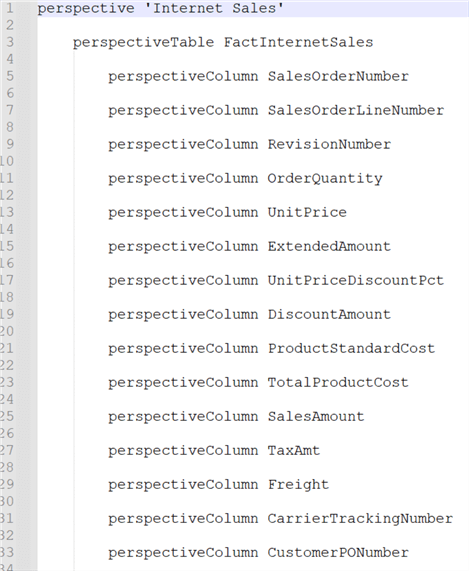
Now that our perspectives are finished, we can publish the model to the Power BI Service.

Connect to a Perspective Using Power BI Desktop
In Power BI Desktop, we'll connect to our live model (sometimes referred to as "shared datasets," or "shared models"). First, create a new blank report.
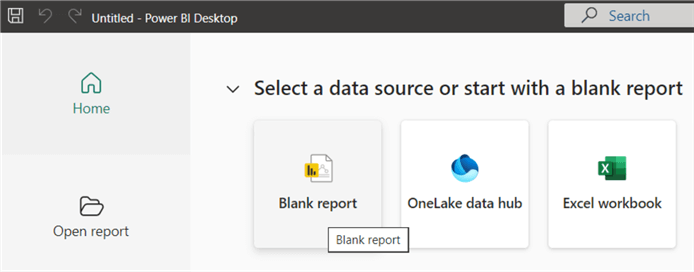
As the source, choose Power BI semantic models.
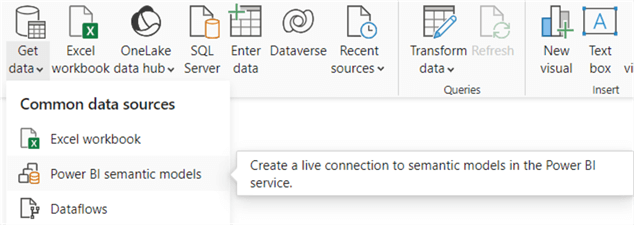
This will take us to the OneLake data hub, where you can pick the just-published model.
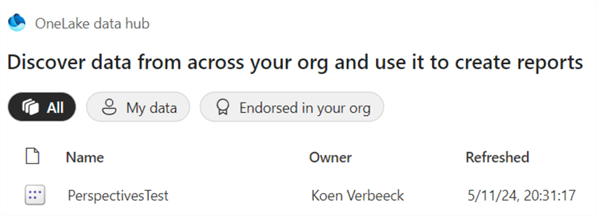
The model will open with a live connection. Unfortunately, we cannot choose to connect to a perspective. By default, Power BI Desktop will connect to the base model. However, we can change how the connection is made. In the bottom right corner, click "Make changes to this model."
The connection will now be converted to a DirectQuery connection. Click Add a local model to do the conversion.

You will immediately be prompted to redefine the connection, where you can choose the tables you want to connect to. When you open the Databases dropdown, you can switch the connection type to Perspectives.
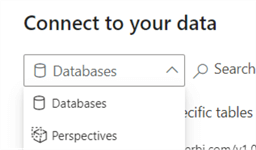
Now you have the option to select a perspective:
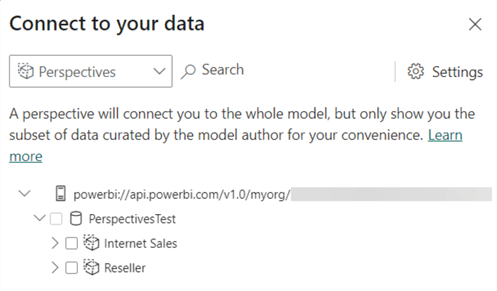
After selecting a perspective, you can see the field list now only shows objects from that perspective:
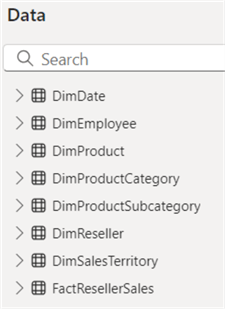
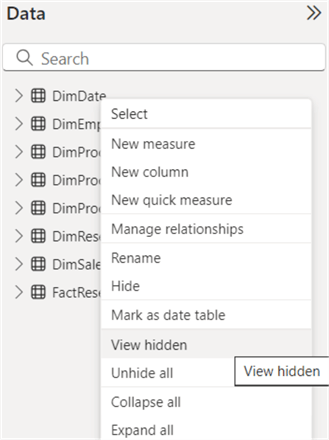
You can view the actual hidden objects by selecting View hidden from the context menu:
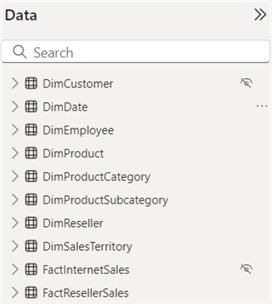
All the objects not included in the perspective are now shown in the field list:
As mentioned before, perspectives are a usability feature, not a layer of security.
Connect to a Perspective Using Excel
To use a perspective in Excel, we need to use the Analyze in Excel feature, which creates an Excel workbook with a live connection to the model in the Power BI Service.

By default, the workbook will open in Excel online, but you can download it to your machine. When you open the workbook, you can see a single PivotTable was added, and the connection is again created to the entire model.
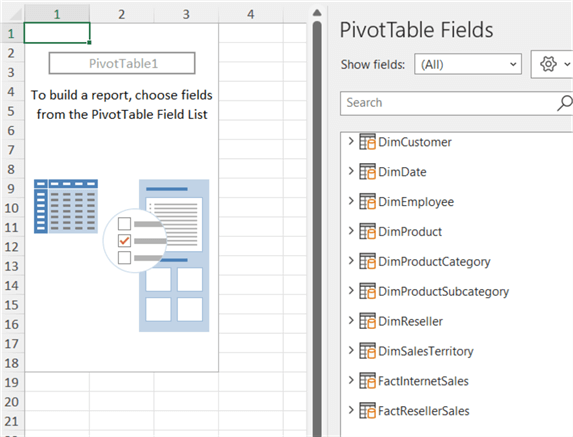
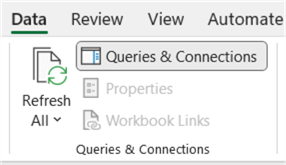
Luckily, we can change this in Excel as well. On the Data tab of the ribbon, click Queries & Connections.
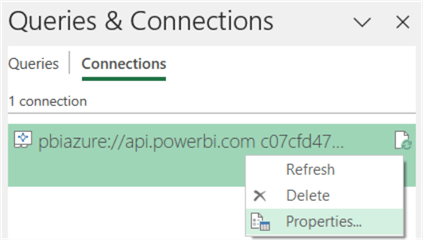
You'll see there's a single connection to the Power BI service. Right-click to go to its properties.
In the Definition pane of the properties, you can find the entire connection string. In the command text, Model is specified.
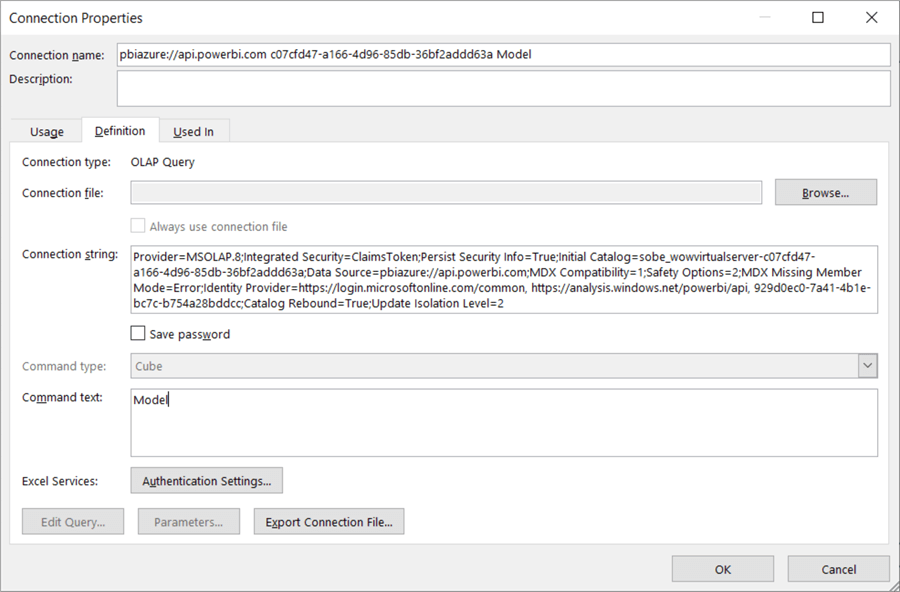
By changing the command text to the needed perspective, we can tell Excel to connect to that perspective instead of the entire model.
Be careful: If your perspective doesn't include any explicit measure, this will fail.
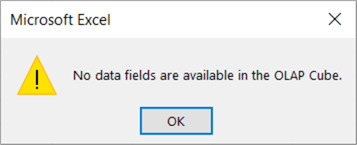
You must have at least one explicit measure defined with DAX to make this work. If you haven't created any measures yet, add one and add it to the perspective:
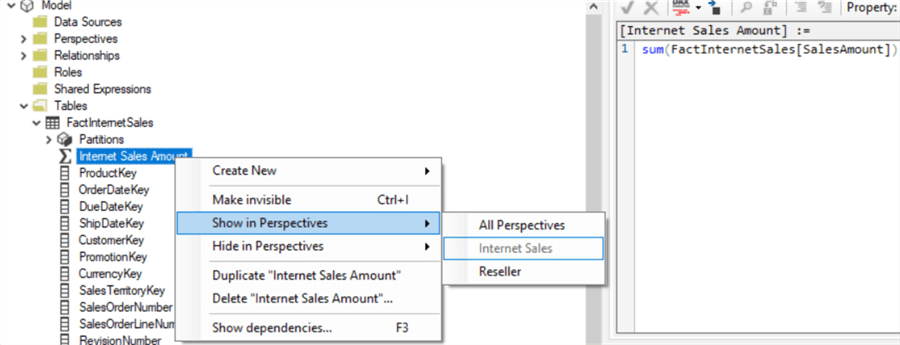
As a best practice, it's always best to work with explicit measures (defined with DAX) instead of relying on implicit measures (columns with numerical values).
When the connection string has been successfully changed, Excel will now connect to the perspective, which will be reflected in the PivotTable field list:
Conclusion
In this tip, we showed how to create perspectives using Power BI Desktop and Tabular Editor. We demonstrated how to connect to a certain perspective using either Power BI Desktop or Excel. However, in both cases, this requires additional steps that might be too technical for some end users, which beats the purpose of a usability feature like perspectives. You might want to create an empty Power BI Desktop report or Excel workbook with the connections already pre-configured and store these in a central location. Users can then use these files as a starting point for their analysis.
Next Steps
- If you want to try it out, you can follow the steps in this article. We used AdventureWorks DW as a source for our sample data, but you can use any data source at your disposal as long as it results in multiple tables.
- You can find more tips about Power BI in this overview.
Learn more about Power BI in this 3 hour training course.
About the author
 Koen Verbeeck is a seasoned business intelligence consultant at AE. He has over a decade of experience with the Microsoft Data Platform in numerous industries. He holds several certifications and is a prolific writer contributing content about SSIS, ADF, SSAS, SSRS, MDS, Power BI, Snowflake and Azure services. He has spoken at PASS, SQLBits, dataMinds Connect and delivers webinars on MSSQLTips.com. Koen has been awarded the Microsoft MVP data platform award for many years.
This author pledges the content of this article is based on professional experience and not AI generated.
View all my tips
Article Last Updated: 2024-12-17


