By: Greg Robidoux
Overview
A common issue with SQL Server is deadlocks. A deadlock occurs when two or more processes are waiting on the same resource and each process is waiting on the other process to complete before moving forward. When this situation occurs and there is no way for these processes to resolve the conflict, SQL Server will choose one of processes as the deadlock victim and rollback that process, so the other process or processes can move forward.
By default when this occurs, your application may see or handle the error, but there is nothing that is captured in the SQL Server Error Log or the Windows Event Log to let you know this occurred. The error message that SQL Server sends back to the client is similar to the following:
Msg 1205, Level 13, State 51, Line 3
Transaction (Process ID xx) was deadlocked on {xxx} resources with another process
and has been chosen as the deadlock victim. Rerun the transaction.
In this tutorial we cover what steps you can take to capture deadlock information and some steps you can take to resolve the problem.
Explanation
Deadlock information can be captured in the SQL Server Error Log or by using Profiler / Server Side Trace.
Trace Flags
If you want to capture this information in the SQL Server Error Log you need to enable one or both of these trace flags.
- 1204 - this provides information about the nodes involved in the deadlock
- 1222 - returns deadlock information in an XML format
You can turn on each of these separately or turn them on together.
To turn these on you can issue the following commands in a query window or you can add these as startup parameters. If these are turned on from a query window, the next time SQL Server starts these trace flags will not be active, so if you always want to capture this data the startup parameters is the best option.
DBCC TRACEON (1222, -1)
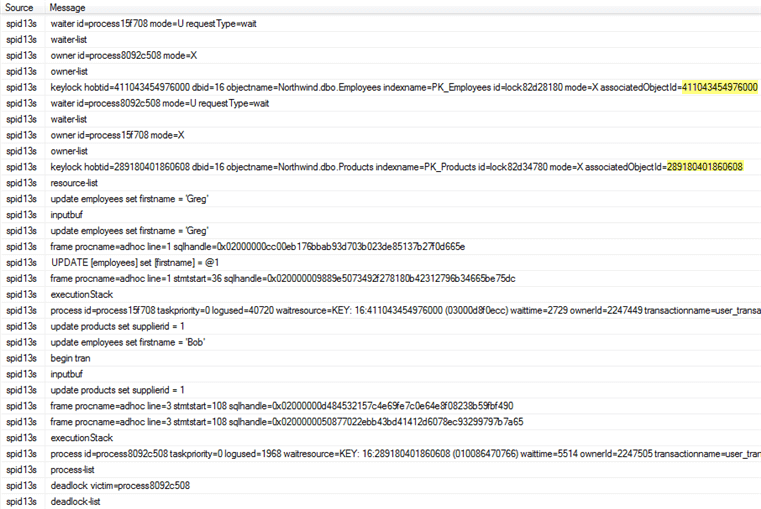
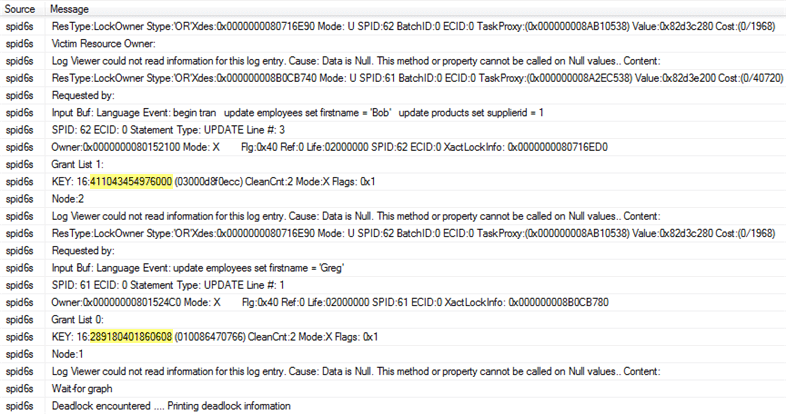
Here is sample output for each of the trace flags.
Trace Flag 1222 Output

Trace Flag 1204 Output

Profiler / Server Side Trace
Profiler works without the trace flags being turned on and there are three events that can be captured for deadlocks. Each of these events is in the Locks event class.
- Deadlock graph - Occurs simultaneously with the Lock:Deadlock event class. The Deadlock Graph event class provides an XML description of the deadlock.
- Lock: Deadlock - Indicates that two concurrent transactions have deadlocked each other by trying to obtain incompatible locks on resources that the other transaction owns.
- Lock: Deadlock Chain - Is produced for each of the events leading up to the deadlock.
Event Output
In the below image, I have only captured the three events mentioned above.

Deadlock Graph Output
Below is the deadlock graph which is the output for the Deadlock graph event. We can see on the left side that server process id 62 was selected as the deadlock victim. Also, if you hover over the oval with the X through it we can see the transaction that was running.

Finding Objects Involved in Deadlock
In all three outputs, I have highlighted the object IDs for the objects that are in contention. You can use the following query to find the object, substituting the object ID for the partition_id below.
OBJECT_NAME([object_id])
FROM sys.partitions
WHERE partition_id = 289180401860608;
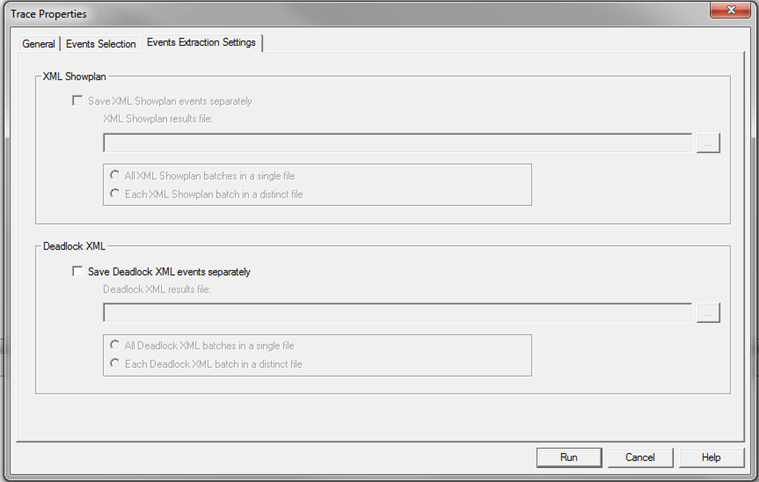
Saving Deadlock Graph Data in XML File
Since the deadlock graph data is stored in an XML format, you can save the XML events separately. When configuring the Trace Properties click on the Events Extraction Settings and enable this option as shown below.

Additional Information
Here are some additional artilces about deadlocks.
- Finding and troubleshooting SQL Server deadlocks
- SQL Server Deadlock Priority Configuration
- Finding SQL Server Deadlocks Using Trace Flag 1222
- Capturing SQL Server Deadlock Information in XML Format
- Using a Clustered Index to Solve a SQL Server Deadlock Issue
Last Update: 3/11/2011
