By: Greg Robidoux
Overview
Another way to get performance related information from SQL Server is to use the built-in performance reports. The reports were first introduced with SQL Server 2005 as an add-on, but are now standard with later versions. The reports provide useful information that can assist you in determining where your performance bottlenecks may be. The data from these reports is pulled from DMVs as well as the default trace that is always running.
Explanation
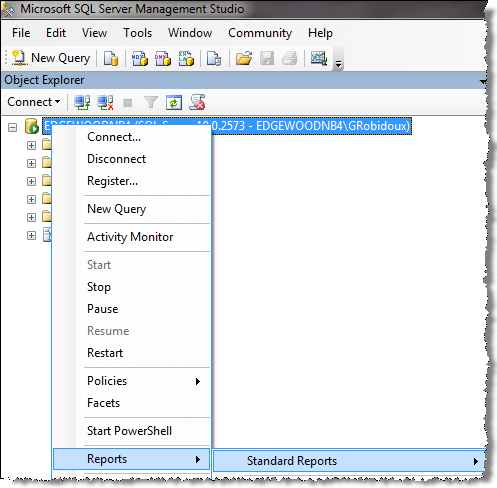
To access the reports, open SSMS, right click on the SQL Server instance name and select Reports > Standard Reports as shown below.

There are several reports related to performance that can be used to see current activity as well as historical activity. Here is a list of some of the available reports.
- Server Dashboard
- Scheduler Health
- Memory Consumption
- Activity - All Blocking Transactions
- Activity - Top Sessions
- Activity - top Connections
- Top Connections by Block Transactions Count
- Top Transaction by Locks Count
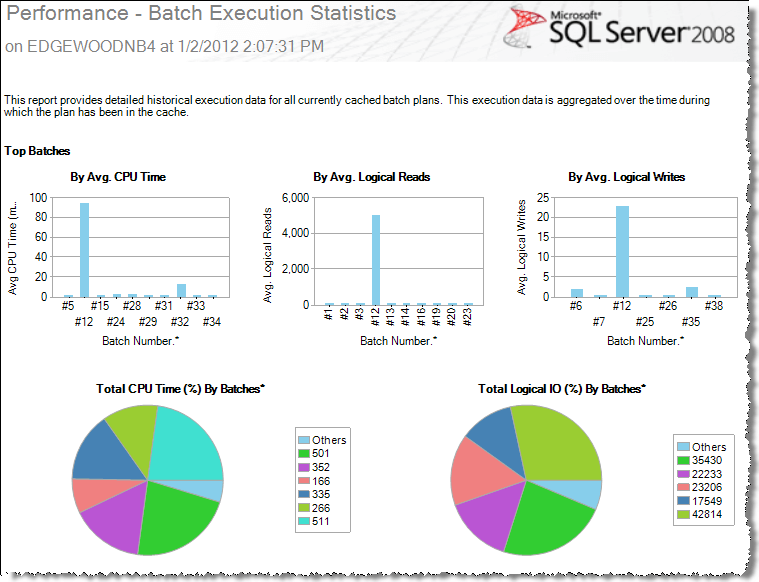
- Performance - Batch Execution Statistics
- Performance - Object Execution Statistics
- Performance - Top Queries by Average CPU Time
- Performance - Top Queries by Average IO
- Performance - Top Queries by Total CPU Time
- Performance - Top Queries by Total IO
Here is a sample Performance - Batch Execution Statistics report:

Take the time to explore these reports to determine which report best suits your performance monitoring needs.
Last Update: 12/30/2011
