By: Siddharth Mehta
Overview
Machine Learning development life cycle starts with exploratory data analysis. We have already learned some of the techniques related to this in the last two sections. The techniques we learned are not exhaustive and depending upon the types of data and intended machine learning algorithm, there can be large variety of exploratory analysis techniques that may need to be applied.
The next step in a Machine Learning development life cycle is identifying the right attributes / fields / variables for model development. Supervised Machine Learning can be classified in two categories – Classification and Regression. In my opinion, Regression is comparatively easier to master than classification oriented methods. Shown below is the Microsoft Azure Machine Learning Algorithm Cheat Sheet available from Microsoft. You can download this from here. The algorithm to select the right machine learning model as shown below, is very generic and can be used even outside Azure.

Linear Regression Model Case Study
Let's say we have a dataset as shown below and we intend to predict the output of the dependent variable using the independent variable. This is arguably the simplest possible use-case of machine learning. We would assume that the due diligence to cleanse data, identify significant independent and dependent variables, and assessing the structure, spread, and correlation of dependent and independent variables has already been carried out.
We have the following dataset as shown below, having two fields. Generally, you have a number of variables in a dataset, and after the exploratory data analysis, the right set of dependent and independent fields are identified. Consider C as the independent field and F as the dependent or the response field. Let's try to follow the algorithm explained in the above diagram, to figure out the nearest matching algorithm that we can use to find the relationship between the two variables (C and F as shown below) in the below dataset.

- Do we want to predict future data points? – Yes
- Do we want to predict values or categories? – Values. We want to be able to predict F using the value of C. As per the above diagram, this means we should implement regression.
- Is our data in rank-ordered categories? – No. Though we can create buckets and manually categorize it, but that is not required here.
- Do we want to predict event counts? – No. We want to predict response values and not counts.
- Do we want to predict single values or a distribution? – Single values. We want to predict the value of F corresponding to the value of C.
- Is linear approximation okay? – We need to analyze this nature of relationship by using a scatterplot chart. The below chart shows that there is a perfect linear relationship between both variables. This happens only in the case of deterministic models. Statistical models would not have a perfect linear relationship. Some points would fall on the line and some would be above or below the line. We are working with deterministic data to keep the problem simple and focus more on the machine-learning method. So the answer here is – Yes, we can use the linear approximation model.

Finally, we have concluded that we should use the Linear Regression algorithm. To use this, one should learn the details of this algorithm. This is actually the simplest regression algorithm for beginners. In summary, the algorithm finds a best-fit line that passes through all the data points in a way that all the data points are at a minimum distance from the line. In addition, there is an equation to find the same line too. You should consider reading more about the theory of linear regression from here.
Developing and Applying the Linear Regression Model
Any machine learning model development can be broken down into some standard and ordered set of tasks as mentioned below. These tasks are common across any machine learning models. Some models can have additional tasks apart from the below, depending upon the complexity and type of algorithm.
- Model Development
- Model Storage
- Model Extraction
- Model Usage
The dataset that we explored above is actually the data of Fahrenheit and Celsius. Assume that we do not know the relationship between these variables and we intend to find this out using the Linear Regression model. Therefore, we have to implement the same using R and T-SQL on data hosted in SQL Server. This tip explains the same in detail. Consider implementing this yourself to get hands-on experience with your first machine learning algorithm.
Prediction and Model Testing
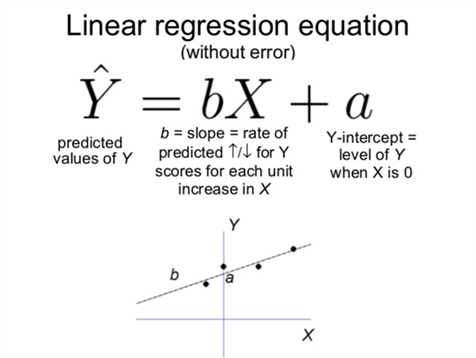
The formula of Ordinary Least Squares Linear Regression algorithm for a simple linear regression model (i.e. one independent and one response variable) is as shown below. The intent of applying the algorithm is to find the coefficients “a” and “b”. In our case, Y-hat is Fahrenheit, X is Celsius, “a” is the Y-intercept and “b” is the slope as shown below. We already know what is in X and Y. The result of our model will deliver the values of a and b.

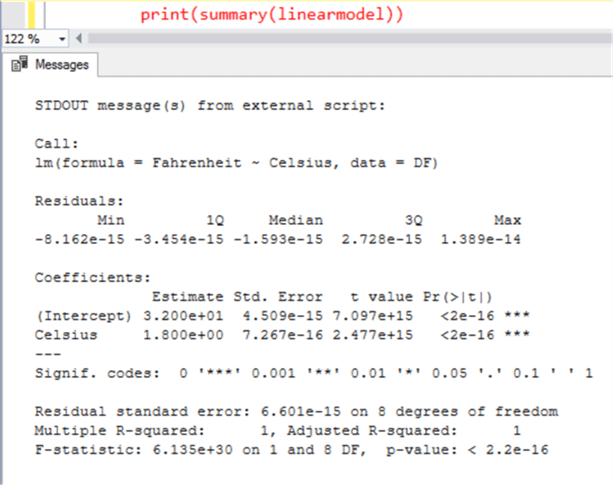
To find out the coefficients “a” and “b”, just print the summary of your linear model, and you should be able to find the result as shown below.

R-squared is the accuracy of the model with which it was able to explain the variation in the dataset. Here “1” mean 100% variation is explained, so we can be confident that the coefficients are accurate. It is almost never 100% in real-life cases of statistical models, and the entire effort is to find a combination of variables that bring the R-squared near to “1”. There are other statistics as well like p-value, t-value, probability of null hypothesis, etc. These statistics explain different properties of the model related to accuracy and confidence in the model. You will have many questions regarding interpretation of these results and you can find a lot of reference material from here regarding this.
The final question is how do we use these results to predict Fahrenheit from Celsius? Let us try a very simple example to understand this. The intercept here is 32 and slope is 1.8. Given that we intend to predict the value of Fahrenheit for 1 degree Celsius, the formula of linear regression method to predict this would be as mentioned below.
Fahrenheit = (Y-intercept) + (slope * Celsius) | Fahrenheit = 32 + (1.8 * 1) = 33.8.
This means 1 degree Celsius would be 33.8 degree Fahrenheit. Using this equation with the derived coefficients, we can predict the value of Fahrenheit for any given value of Celsius. We have developed a model using the Linear Regression algorithm and trained our model by feeding it a dataset, from which it learned and derived inferences to predict intended results. This is what we term as machine learning in its simplest form.
Summary
Assuming that you are completely new to the discipline of machine learning, we started this tutorial with the discussion of some basic terms, concepts and theory of machine learning. We understood the components in SQL Server 2017 that supports machine learning related requirements including R. Machine learning has deep roots in mathematics and statistics. We learned some basic statistics terms, fundamentals and understood how to learn just enough statistics for machine learning, so that we do not lose focus of the subject.
Having a strong fundamental knowledge of statistics, theoretical knowledge of machine learning and implementation knowledge of R, we learned how about the shape and spread of data by learning different statistics extracted using R and T-SQL. We also learned how to do this graphically by using different statistical visualizations.
In the final section, we briefly looked at the machine learning model development lifecycle, implemented a machine-learning algorithm on a sample data using R and understood the way to interpret test results at a higher level. I hope this tutorial provides a Launchpad for beginners on Machine Learning using Machine Learning Services, R and T-SQL in SQL Server 2017
Next Steps
Machine Learning is a very wide subject and the concepts covered in this tutorial are meant to provide beginners with an overall idea of machine learning implementation with the simplest possible use-case. To excel in this discipline, it is necessary to practice and form a habit of researching every new term or concept that you come across. Consider learning thoroughly about the algorithm of your choice and learn more details of how to implement this in Microsoft R Open using SQL Server Machine Learning Services before starting with the implementation. With this, we have reached the end of this tutorial.
Last Update: 8/21/2017
