By: Jeremy Kadlec | Updated: 2007-12-10 | Comments (3) | Related: > Integration Services Performance
Problem
We have adopted SQL Server 2005 Integration Services and we are moving a great deal of data on a consistent basis throughout the day for a number of systems. Unfortunately, we have been seeing some memory related issues and wanted to find out how we could monitor these on a regular basis? We want someway to collect performance related data and monitor the overall process. What tools and metrics are available for monitoring an SSIS Package? Can you provide some examples?
Solution
With SQL Server 2005 Microsoft provided counters in Performance Monitor (System Monitor) to monitor some key metrics of the SQL Server 2005 Integration Services metrics. Many of these new counters are related to memory, so they may offer some insight into your issue, but that is not guaranteed based on the problem provided. One item to keep in mind is that these counters are new with SSIS and equivalent (or similar) counters were not available with SQL Server 2000/7.0 DTS.
Performance Monitor Counters
Below are the SSIS Performance Monitor counters that are available:
- SQLServer:SSIS Service
- SSIS Package Instances - Total number of simultaneous SSIS Packages running
- SQLServer:SSIS Pipeline
- BLOB bytes read - Total bytes read from binary large objects during the monitoring period.
- BLOB bytes written - Total bytes written to binary large objects during the monitoring period.
- BLOB files in use - Number of binary large objects files used during the data flow task during the monitoring period.
- Buffer memory - The amount of physical or virtual memory used by the data flow task during the monitoring period.
- Buffers in use - The number of buffers in use during the data flow task during the monitoring period.
- Buffers spooled - The number of buffers written to disk during the data flow task during the monitoring period.
- Flat buffer memory - The total number of blocks of memory in use by the data flow task during the monitoring period.
- Flat buffers in use - The number of blocks of memory in use by the data flow task at a point in time.
- Private buffer memory - The total amount of physical or virtual memory used by data transformation tasks in the data flow engine during the monitoring period.
- Private buffers in use - The number of blocks of memory in use by the transformations in the data flow task at a point in time.
- Rows read - Total number of input rows in use by the data flow task at a point in time.
- Rows written - Total number of output rows in use by the data flow task at a point in time.
One word of caution with these counters, they appear to be calculations in the aggregate as opposed to a single SSIS Package execution. Depending on the issue, it might make sense to conduct some isolated testing as well as monitor the overall environment. If you suspect a single package or group of packages causing the issue, then these metrics and general
For additional information reference SQL Server 2005 Books Online - Monitoring Performance of the Data Flow Engine.
Sample Performance Monitor Data
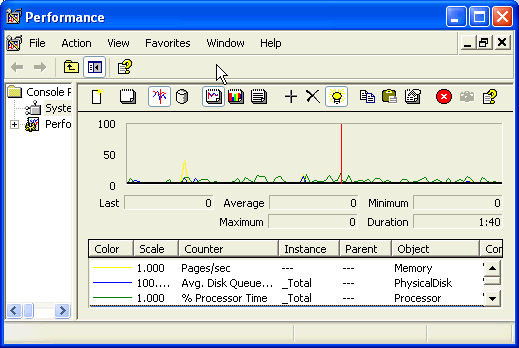
Below is an explanation of how to access into the data flow tasks via Performance Monitor:
Launch Performance Monitor by navigating to: Start > All Programs > Administrative Tools > Performance

Load the SSIS related counters by clicking on the '+' from the menu bar in the Performance Object select SQLServer:SSIS Pipeline and SQLServer:SSIS Service

Monitor the Performance Monitor results in the menu select the light bulb icon to highlight a single counter and press the up and down arrow keys to highlight various counters

Next Steps
- If you are faced with the need to gain insight into how the SSIS Data Flow Task is using resources, primarily memory, Performance Monitor offers some insight into the processing.
- If you have a busy SSIS environment, fire up Performance Monitor with your favorite counters and add the SSIS counters to get a better feel for the load from the data flow task operations.
- Stay tuned for more options to monitor SSIS Packages progress via the Microsoft tool set in the upcoming weeks.
About the author
 Jeremy Kadlec is a Co-Founder, Editor and Author at MSSQLTips.com with more than 300 contributions. He is also the CTO @ Edgewood Solutions and a six-time SQL Server MVP. Jeremy brings 20+ years of SQL Server DBA and Developer experience to the community after earning a bachelor's degree from SSU and master's from UMBC.
This author pledges the content of this article is based on professional experience and not AI generated.
View all my tips
Article Last Updated: 2007-12-10


