By: Rob Fisch | Updated: 2007-09-24 | Comments (25) | Related: > Reporting Services Parameters
Problem
Reporting Services has many great built in features, but accessing them externally can be tricky. Suppose you wanted to pass a variable directly within a URL? Wouldn't it be great if you could provide a URL from a website or email that renders a report directly in Excel? Do you need to display a report (perhaps a chart) while hiding the reporting toolbar? Let's take a look at these items as well as a few others and how you can use parameters in your URL to change the report behavior.Solution
Follow these steps to discover various solutions to these and other issues.
Solution Setup
For this demo we will be using the same sample database I used in my tip on drill down techniques, (Follow the instructions in the "Sample Data" box.)
Create a new report using the VISIBILITY_EXAMPLE_TABLE as a datasource. Use the following SQL statement as the report's first dataset:
SELECT ProductCode, ProductName, ProductColor, QuantityAvailable, SupplierName, SupplierRegion
FROM VISIBILITY_EXAMPLE_TABLE
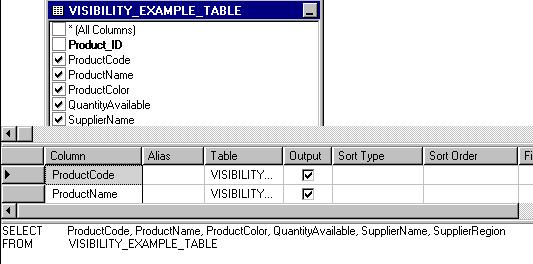
From the Layout tab, add the six fields to a new data table.

Add a second dataset to the report and call it AvailableColors.
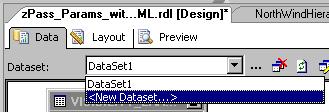
Enter this for the SQL statement of the new dataset:
SELECT DISTINCT ProductColor
FROM VISIBILITY_EXAMPLE_TABLE
ORDER BY ProductColor
Return to the first dataset and add the following line:
WHERE ProductColor=@ProdColor
The entered dataset should look like:
SELECT ProductCode, ProductName, ProductColor, QuantityAvailable, SupplierName, SupplierRegion
FROM VISIBILITY_EXAMPLE_TABLE
WHERE ProductColor=@ProdColor
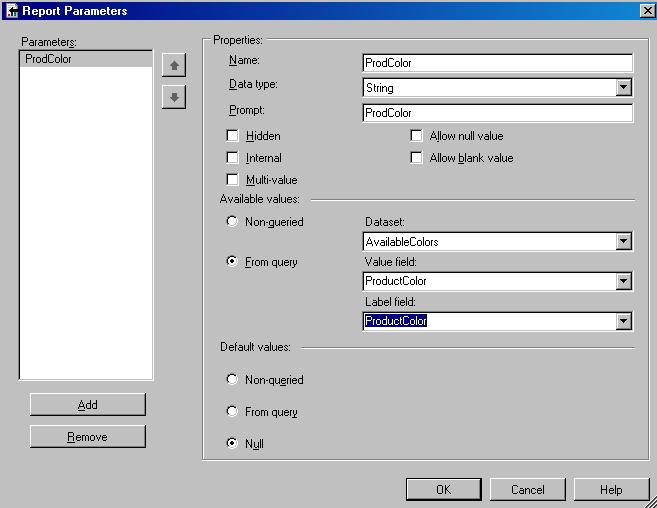
From the Report menu, select Report Parameters. In Available values, select From query, and change the Dataset to AvailableColors, and select ProductColor in both the Value and Label fields. Leave the Default to Null. The entire Report Parameter screen should like this below:
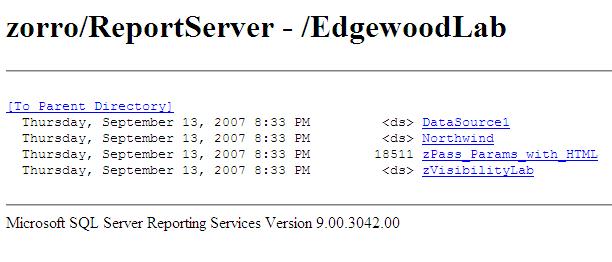
Now save and publish the report to your Reporting Services web server. Access your report from the web server using the Report Server (not the Report Manager).
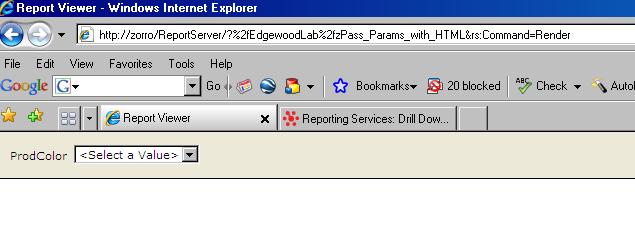
Your browser screen should look like this before clicking the report. (The name of my server is Zorro. Henceforth, replace "Zorro" with the machine name of your SQL server.) The name of my report is called "zPass_Params_with_HTML". You can name your report whatever you like.
When you first run the report, you should be prompted for a parameter:
Just to try it out, select a parameter and run the report.
As long as everything works we're ready to have some fun....
Passing the parameter entirely through HTML
Start over with your browser at the ProdColor prompt. Instead of choosing the color from the dropdown, add the following at the end of the URL:
&ProdColor=Green.
It should look like this:

DO NOT click the View Report button, but instead, click the go button in the browser. You should get the same results as if you used the dropdown within the report. This should give you the idea that you can programmatically pass parameters from another program or web site.
Controlling Report Options
So you want to hide the parameter bar by default, try adding this to the end of the URL:
&rc:Parameters=false
The full URL should look like this:
http://zorro/ReportServer/?%2fEdgewoodLab%2fzPass_Params_with_HTML&rs:Command=Render&ProdColor=Green&rc:Parameters=false
Hiding the Toolbar
Add this to the end of the URL:
&rc:Toolbar=false
Controlling Report Format
(Opening Excel or Acrobat by default)
If you haven't already done it, let's roll back to the original URL.
http://zorro/ReportServer/?%2fEdgewoodLab%2fzPass_Params_with_HTML&rs:Command=Render
(Remember to replace "Zorro" with the name of your server and use whatever you named your report.)
Now add the following on the end of the URL:
&rs:Format=Excel
Try this at the end:
&rs:Format=PDF
As you can see, there are many different options for presenting your report directly from a URL. This introduction should give you a foundation to read further on this topic. There is extensive documentation in Books Online.
Next Steps
- Try combining the &rc:Toolbar=false tip with a series of charts that you can put together in a dashboard on a web site. This can be done from a series of iframes on a standard website or from Sharepoint in Page Viewer web parts.
- Check Books Online or Microsoft for more detailed documentation on passing parameters in a URL and other report options.
- Take a look at these other Reporting Services tips.
About the author
 Rob Fisch has worked with SQL Server since version 6.5 as a dba, developer, report writer and data warehouse designer.
This author pledges the content of this article is based on professional experience and not AI generated.
View all my tips
Article Last Updated: 2007-09-24


