Comparison between a SQL Server Graphical Plan and Text Plan

By:   |   Comments (7)   |   Related: > Query Plans


Problem

I have been using Graphical Query Plans for some time, but I know that Text Plans are also available.  I have looked at them a few times, but I don't really understand how to relate what I know about the Graphical Plans to the Text Plan format.  

Solution

In this tip we will take a look at a sample query and how the Graphical Plans maps to the Text Plan output.

SQL Server Query Plans

There are two different types of query plans, the estimated and the actual execution plan. You can obtain these plans in three formats: text, graphical and XML.  Note that if you try to view an execution plan and have issues you may need to have the SHOWPLAN permission granted to your login. You can read more about SHOWPLAN security on MSDN.

Generally Graphical Plans are easier to read for beginners and also for query plans that are not overly complex.  When the query plan gets more complex Text Plans are generally a better option although they can be overwhelming at first sight. 

Text Plans maybe harder to read, but they contain more information without the need to check the properties for each operation. For Graphical Plans the details for each operation can be displayed using the ToolTips by hovering your mouse over the operation or using the properties window.  When you hover over an operation or click on the operation a list of operator properties is displayed, but unfortunately it can be difficult to check all the details for a complex query using this tool.

Let's check the Graphical and the Text Execution Plans for a query in the AdventureWorksDW2008R2 database and compare the output.

SQL Server Graphical Plans

You can display the Estimated Execution Plan in SQL Management Studio by pressing CTRL + L in the query window or CTRL + M for the Actual Execution Plan. 

For this example we will use the Estimated Execution Plan and then run the following query.

SELECT * 
FROM dbo.DimOrganization 
LEFT JOIN dbo.DimCurrency ON DimOrganization.CurrencyKey=DimCurrency.CurrencyKey 
WHERE DimOrganization.ParentOrganizationKey IS NOT NULL 
ORDER BY DimOrganization.ParentOrganizationKey,DimOrganization.CurrencyKey

You should read a Graphical Plan from right to left and top to bottom following the arrow between the icons.  I have added red numbers to show the sequence of events below.

sql server graphical estimated execution plan

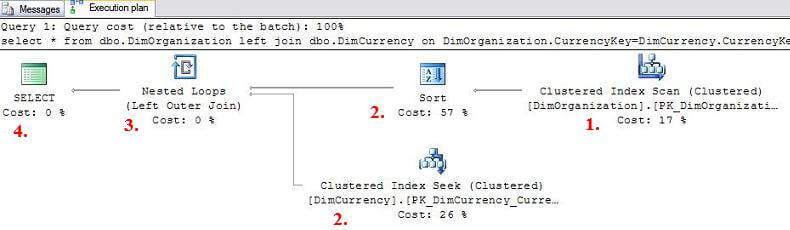
On the Graphical Plan you can check that the execution order by following the arrows from right-to-left:

  1. Starts with a Clustered Index Scan
  2. A Sort and Clustered Index Seek run in parallel
  3. Nested Loops
  4. Select

The data passed between operations is represented by the thickness of the arrows on the Graphical Plan and if you hover over the arrow you can see the Estimated Number of Rows that are passed between operations. 

SQL Server Text Plans

There are three ways to obtain text plans:

  • SET SHOWPLAN_TEXT: the query is not executed, but returns information about how the statements are executed (Estimated Execution Plan)
  • SET SHOWPLAN_ALL: the query is not executed, but returns detailed information about how the statements are executed and the resources used (Estimated Execution Plan)
  • SET STATISTICS PROFILE: the query is executed and returns detailed information about how the statements are executed, actual number of rows and the resources used (Actual Execution Plan)

To turn these on you use the ON option and turn off you use the OFF option as shown below.

Since we want to get the estimated execution plan with details to match the graphical plan we will run the following code:

SET SHOWPLAN_ALL ON
GO

SELECT * 
FROM dbo.DimOrganization 
LEFT JOIN dbo.DimCurrency ON DimOrganization.CurrencyKey=DimCurrency.CurrencyKey 
WHERE DimOrganization.ParentOrganizationKey IS NOT NULL 
ORDER BY DimOrganization.ParentOrganizationKey,DimOrganization.CurrencyKey 
GO

SET SHOWPLAN_ALL OFF
GO

The Text Plan for the query is below and I broke this up into three screenshots to show all the details.

When you interpret a Text Plan, you should look for the pipes (|) which connect the child and parent nodes.  You can see these in the StmtText column.  Each indentation is another level deeper.  Note that I added red numbers to show the order of operations and these numbers correspond to the numbers above in the Graphical Query Plan.

sql server showplan all execution plan

sql server showplan all execution plan part 2

sql server showplan all execution plan part 3

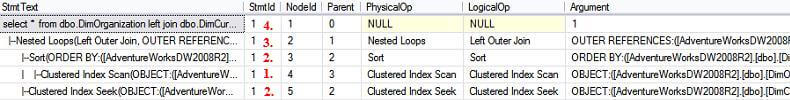
The Text Plan contains the execution order through the NodeId and Parent columns. The Parent column shows which operation will use the output of the current operator. You should start with a statement where the StmtText starts at the rightmost position behind a pipe character. For this query it is the Clustered Index Scan (NodeId 4).

  1. Clustered Index Scan (NodeId 4) runs first
  2. Clustered Index Seek (NodeId 5) and Sort (NodeId 3) run in parallel, their parent operator is the Nested Loops (NodeId 2)
  3. Nested Loops (NodeId 2) processes the output of the previous operations
  4. Select (NodeId 1) is the final operation

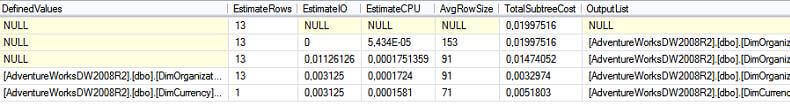
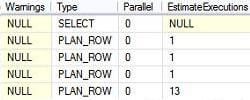
On the Text Plans you can easily see all of the detailed properties which are shown in Graphical Query Plan ToolTips.  One such item is the EstimateRows which shows the estimated number of rows passed between operations.

Summary

I hope this helps you see that Text Plans are not that hard to use and as your query plans get more and more complex that this might be a better option to tune your queries.

Next Steps


sql server categories

sql server webinars

subscribe to mssqltips

sql server tutorials

sql server white papers

next tip


About the author
MSSQLTips author Tibor Nagy Tibor Nagy is a SQL Server professional in the financial industry with experience in SQL 2000-2012, DB2 and MySQL.

This author pledges the content of this article is based on professional experience and not AI generated.

View all my tips


Comments For This Article


Friday, July 3, 2015 - 12:12:32 AM - Bill Back To Top (38123)

I do not see a deprecation warning in BOL under the topic https://msdn.microsoft.com/en-us/library/ms176058.aspx, which is where I would expect to see the warning. Perhaps its trace event is being deprecated (being replaced by extended events), but that is a horse of a different color.

Another tip about text plans concerns the ease of viewing the indentations, and the ease of comparing STATISTICS PROFILE's [Rows] column with its [Estimated Rows] column (and comparing its [Executions] column with its [EstimatedExecutions] column). The last screen scrape (above) shows SHOWPLAN ALL results in grid mode. However, if you collect STATISTICS PROFILE results in a Text-mode (enabled via <Ctrl>+D or SSMS's "Results to Text" button), you can more easily see the indentations (when compared to grid mode). For example, in text mode (which uses a fixed width font) the pipe symbols (pipes) will line up.

But there is more. Another tip that concerns the editing abilities of SSMS's results pane - you can move columns. In grid mode, you can drag a column. In text mode, you can click and release at the one corner of a column, press and hold down <Alt>, and drag your cursor to the caddy corner of a column. You will see just that column selected. You can then copy (<Ctrl>+C) and paste (<Ctrl>+V) just that selection somewhere else within the results pane (or wherever else you may wish). For example, you can paste the [Rows] column right nest to the [EstimatedRows] column (which is way to the right), and you can paste the [Executions] column right next to the [EstimatedExecutions] column. By doing so, you can readily determine the accuracy of cardinality estimates for every iterator/operator, all at once. For a graphical plan, instead you would have to hover your mouse over each iterator/operator and remember (good luck) what you saw pop up. 

Knowing whether an actual execution plan's performance is suffering from a cardinality estimate problem is an extremely important first step. For example, a cardinality estimate problem can be created by failing to manage statistics (there are other reasons). While a cardinality estimate problem is outside of the author's scope - I think it is well worth investigating "cardinality estimates" both here and in msdn.com's blogs (especially for those who are new to execution plans).

Graphical (and XML) plans are still useful. For example, SSMS's "Display Estimated Plan" button (<Ctrl>+L) will readily show you a new index that SQL Server suggests is useful (if there is one). The text plan omits the suggestion. That omission (strongly) suggest Microsoft's developers are no longer enhancing text plans (but that too is a horse of a different color). Text plans have their usefulness, which is why they are not dead yet.


Friday, March 16, 2012 - 4:41:56 AM - Dick Baker Back To Top (16426)

suggest you advise readers that the SET SHOWPLAN_TEXT option is now deprecated, so folk should concentrate on Graphic/XML formats


Tuesday, January 10, 2012 - 1:40:47 PM - Tibor Nagy Back To Top (15600)

Hi Scott,

Actually, when I wrote that they run in paralel, my intention was to show that the operators both finish before the operator on the left. It is just generalization, the key is to show junior DBAs how to use text plans if they are familiar with graphical plans. Physically they can run in paralel or not, but the point is that they both should finish before the operator on the left.


Tuesday, January 10, 2012 - 11:34:50 AM - Scott C Back To Top (15598)

I didn't read the query closely enough, the sort is by ParentOrganizationKey, CurrencyKey and not by CurrencyKey alone.  But the point is that the sort will finish before the seeks begin, otherwise the sort operation would be to the left of the Nested Loop join.


Tuesday, January 10, 2012 - 11:29:53 AM - Scott C Back To Top (15597)

This was a useful tip overall, but your interpretation of the sequence of operations is inaccurate.

The sort operation does not run in parallel with the clustered index seek.  Most sorts are blocking operations, all input rows are spooled to a temp table before continuing to the next step.  In this case the whole point of the sort operation is to get all the CurrencyKey values from the index scan in the same order as the clustered primary key, before doing the first seek.  Then the clustered index seek operation is more like a merge, it only requires one pass through the table rather than jumping around at random.


Tuesday, January 10, 2012 - 10:43:27 AM - Tibor Nagy Back To Top (15595)

Hi David,


You are using AdventureWorks database this why you cannot find the DimOrganization table.

In the example I used AdventureWorksDW2008R2 database which can be downloaded from Codeplex site for SQL Server 2008 R2.

Anyway, it was just an example to show how to compare the query plans. You can experiment with any query plan.


Regards,

Tibor


Tuesday, January 10, 2012 - 10:11:40 AM - David Back To Top (15592)

Very useful tip. I was unaware ofthe text option you presented in the article.

I could not find the DimOrganization table so I used some queries for Adventureworks.

USE ADVENTUREWORKS
GO

SET SHOWPLAN_ALL ON
GO
SELECT * FROM Sales.SalesOrderDetail s INNER JOIN Production.Product p ON s.ProductID = p.ProductID 
GO
SELECT * FROM Production.TransactionHistory th INNER JOIN Production.TransactionHistoryArchive tha ON th.Quantity = tha.Quantity 
GO
SET SHOWPLAN_ALL OFF
GO


get free sql tips
agree to terms