By: Dallas Snider | Comments (1) | Related: > Analysis Services Development
Problem
Testing for logic errors in SQL Server Analysis Services Key Performance Indicators (KPIs) can be cumbersome at times. In this tip we look at how you can test your KPIs.
Solution
Fortunately, we can use Reporting Services and T-SQL along with Analysis Services to test the logic in our KPIs. For this tip, I will be using objects provided with the Adventure Works DW 2012 Multidimensional Standard Edition tutorial. I will also be using the cube example I created in the tip Defining Role Playing Dimensions for SQL Server Analysis Services.
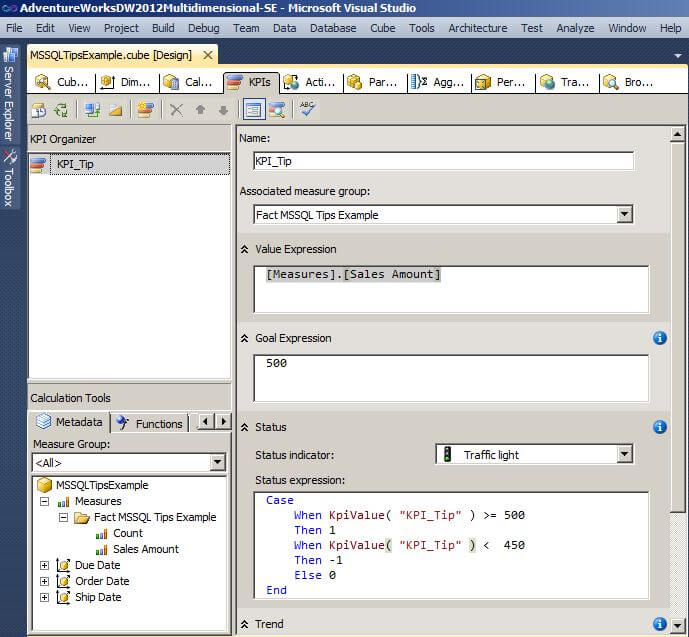
We will begin this tip by creating a simple KPI in Analysis Services as shown below. This KPI will return a value of 1 for the Status when the [Measures].[Sales Amount] as shown in the Value Expression box is greater than or equal to 500 dollars, a value of -1 for the Status when the measure value is less than 450, or a value of 0 for the Status when the measure value is greater than or equal to 450 and less than 500. Also, notice that the Status indicator selected is the Traffic light.
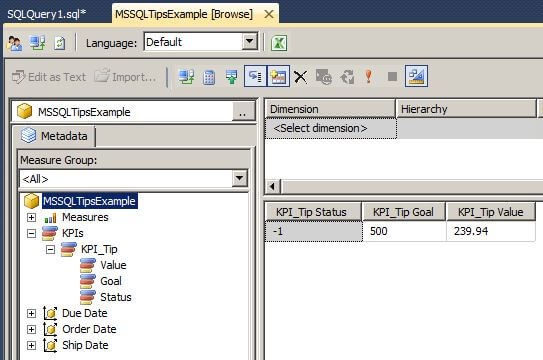
After creating the KPI, the Analysis Services objects need to be deployed and processed so the new KPI and its properties can be seen when browsing the cube. The KPI properties can be dragged and dropped onto the query palette to view their properties.
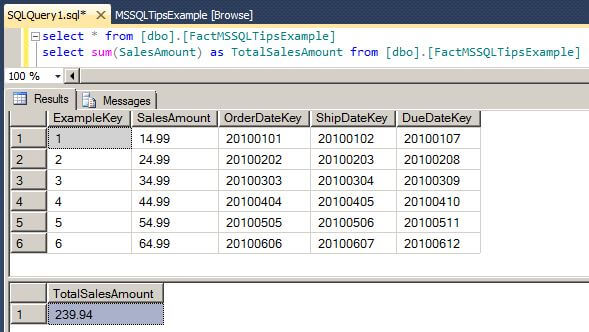
We can also execute a T-SQL query to view the rows that contain the source data for the cube measure.
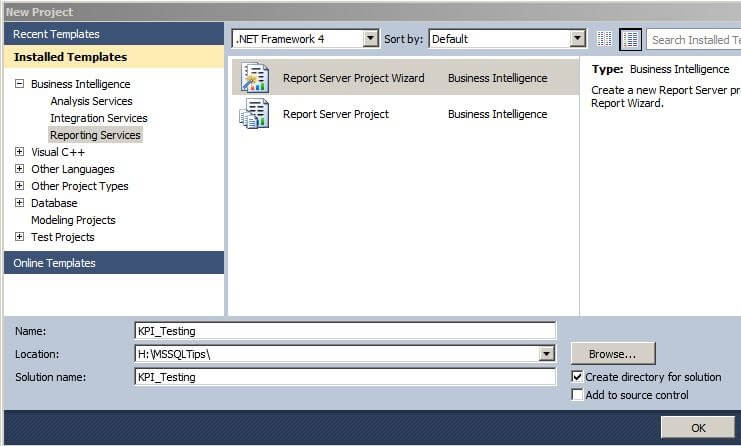
To ensure there are no logic errors for the indicator, we can create a new Reporting Services project in Visual Studio that will allow us to visualize the KPI Indicator and the KPI's property values.
In the first step of the wizard, we will choose our Analysis Services database to be our data source.
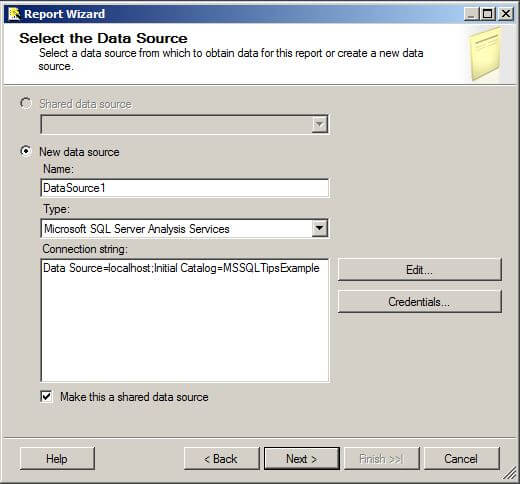
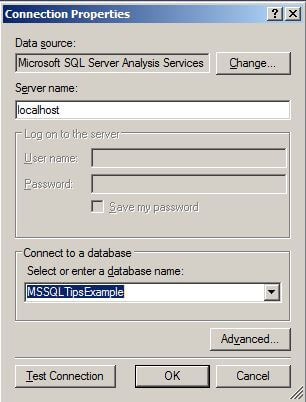
The connection string can be typed manually or created automatically in the Connection Properties window.
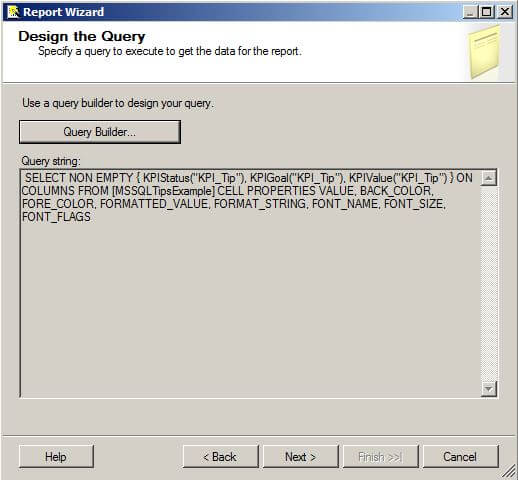
The next screen of the wizard is where we will design our query.
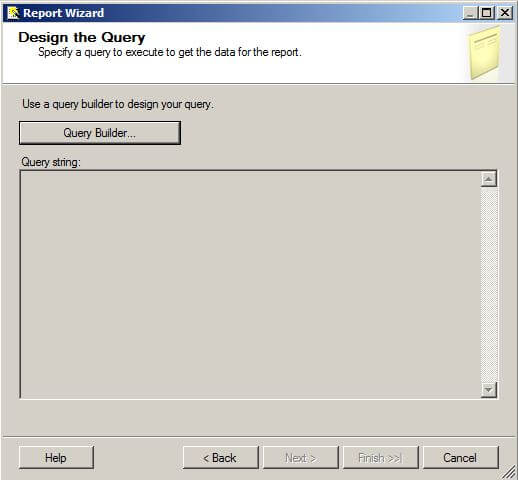
Clicking on the Query Builder button launches the Query Designer screen. Drag and drop the KPI properties onto the palette just as we did in Analysis Services. Click on OK to return to the wizard.
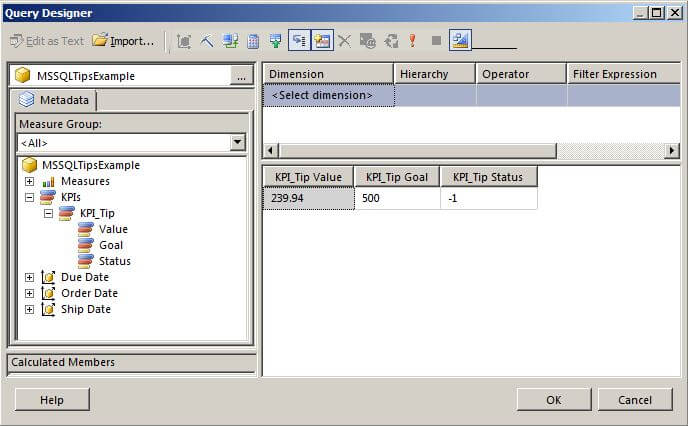
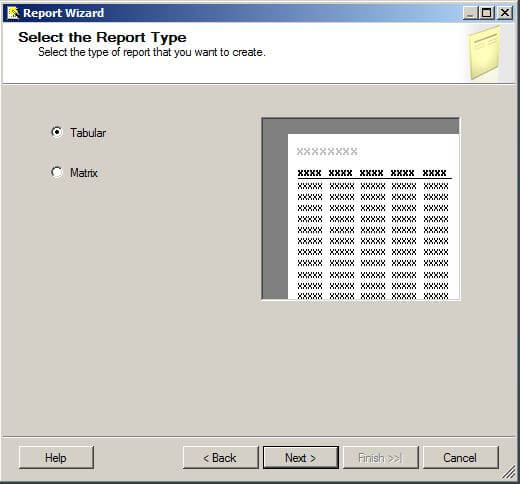
We can see the Analysis Services MDX query displayed on the screen. Click on Next to move to the Report Type screen.
On the Report Type screen we will choose Table and then click on Next.
On the Design the Table screen, we will move all values in the Available Fields box to the Displayed Fields Details box.
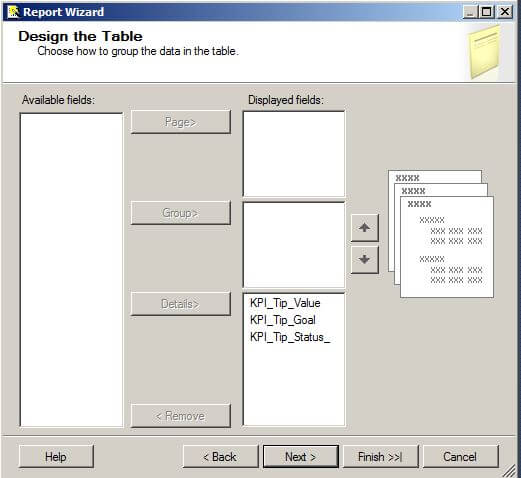
Clicking on Next brings us to the table style page. Select the style of your preference and then click on Next.
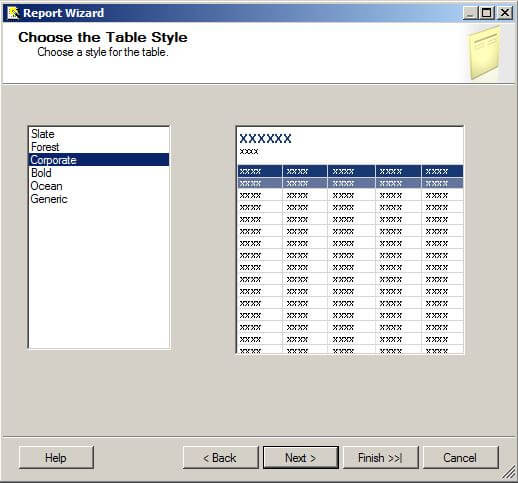
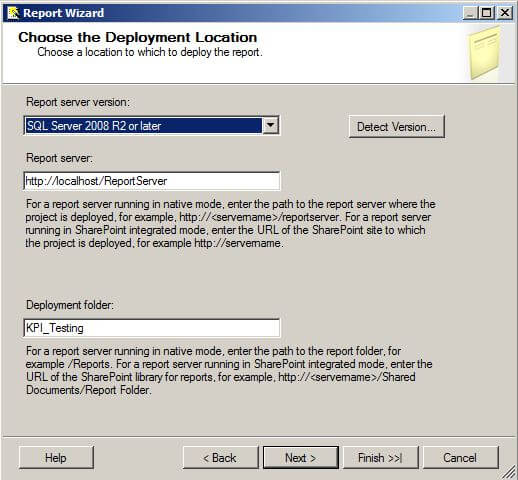
Since this is a new Reporting Services project, we are shown the Choose the Deployment Location screen in the wizard. We will leave the defaults and click on Next.
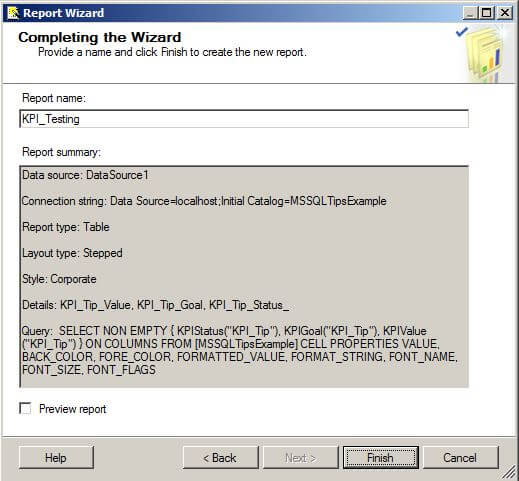
On the Complete the Wizard screen, name the report and click on Finish.
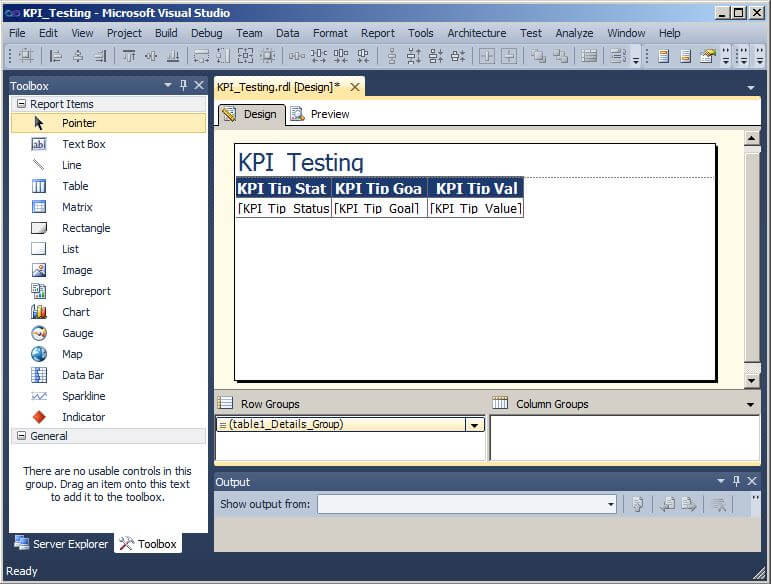
Next, we will need to add an indicator to the table. In the Reporting Services toolbox, we can see the Indicator object.
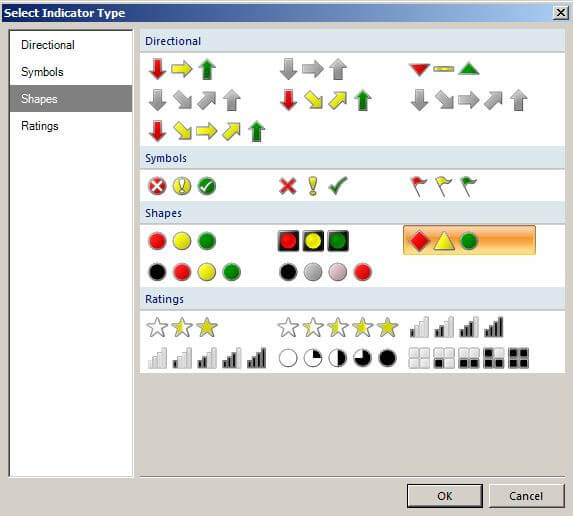
Insert a column on the right side of the table and drag an Indicator object from the toolbox to the new table data row cell. When you release the mouse button, the Select Indicator Type window will display. We will select the "3 Signs" indicator in the Shapes box highlighted below and then click on OK.
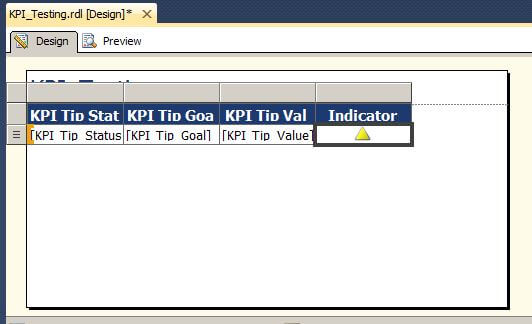
The yellow sign indicator displays on the report design palette.
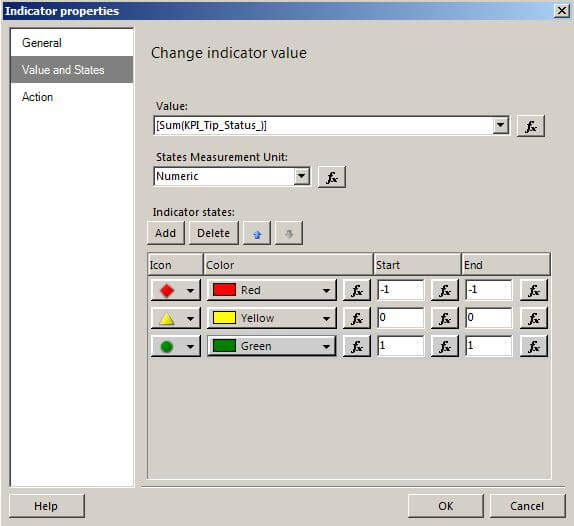
Next, we will set the indicator's properties by right clicking on the Indicator and selecting Indicator Properties. We will select the KPI's Status from the Value drop-down box. For the red icon, we will set the Start and End values to -1. For the yellow icon, we will set the Start and End values to 0. For the green icon, we will set the Start and End values to 1. Click on OK.
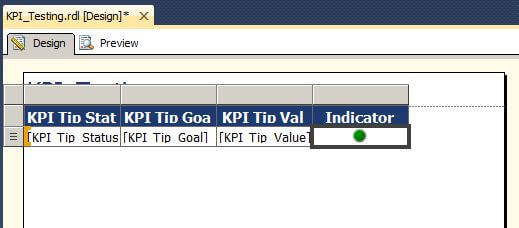
After clicking on OK, the green sign indicator displays on the report palette.
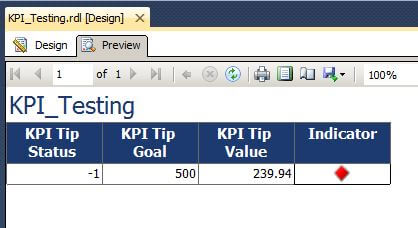
Clicking on the preview tab allows us to see the display of the red indicator and the KPI's property values. This is expected based on the Status expression we configured in Analysis Services.
Next, we will add a row to the Analysis Services cube's source table to bring the measure up to a value that should display the yellow indicator.
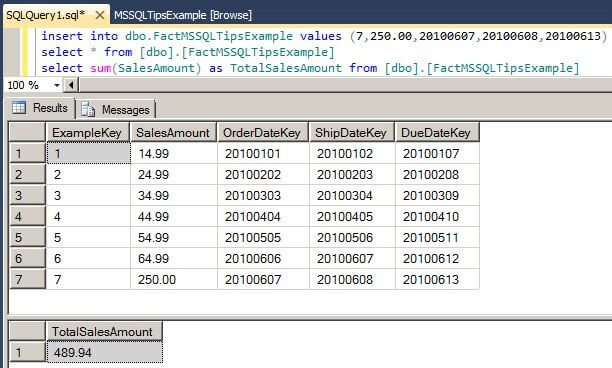
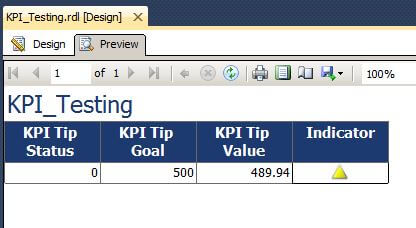
After processing the cube, we can refresh the report and see the yellow indicator displayed along with the updated KPI property values.
Next, we will add another row to the Analysis Services cube's source table to bring the measure up to a value that should display the green indicator.
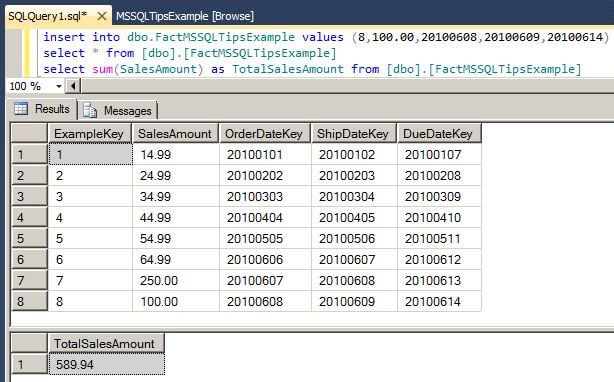
After processing the cube, we can refresh the report and see the green indicator displayed along with the updated KPI property values.
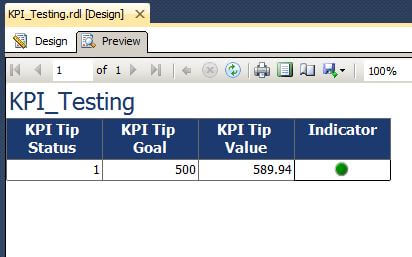
This lets us know the logic in the Status expression is working correctly.
Next Steps


About the author
 Dr. Dallas Snider is an Assistant Professor in the Computer Science Department at the University of West Florida and has 18+ years of SQL experience.
This author pledges the content of this article is based on professional experience and not AI generated.
View all my tips
