By: Scott Murray | Comments (1) | Related: > Power BI
Problem
I saw your recent tip on Getting Started with Power BI Designer and now I want to find out some of the functionality related to the Power BI Desktop query tools. What functionality is available? What data sources can I connect to? How can I manipulate the data? Can I modify the queries directly?
Solution
In a previous tip, Getting Started with Power BI Desktop, we described in detail the new Power BI Desktop (AKA Power BI Designer) that Microsoft has added to the Power BI tool set. Of course just as the tip was published, Microsoft renamed the tool from Power BI Designer to Power BI Desktop (PBID). Even so, the basics of the tool and the details in the tip still apply. Getting the designer is easy as the Power BI Desktop is available for download at: https://powerbi.microsoft.com/downloads. The current edition of the software is available free of charge and Microsoft has indicated that the tool will continue to be free. Of course that could change. Furthermore to publish the PBID reports to the web, you must have an account setup on the Power BI site. Before I go too far I need to warn you that the tool is still in its early stages. Sure it works well from my testing, but features are being added and removed every month. Be sure you temper any move to production with the fact the tool set may not scale as anticipated or may plainly just not work. OK..... So it may not work. Enough said. With all these changes and updates, Microsoft is currently releasing an updated preview about once per month. You can see the latest version information on the Microsoft Power BI Support page at: https://support.powerbi.com/knowledgebase/articles/489224-what-s-new-in-the-latest-power-bi-designer-preview.
Querying data with Power BI Desktop
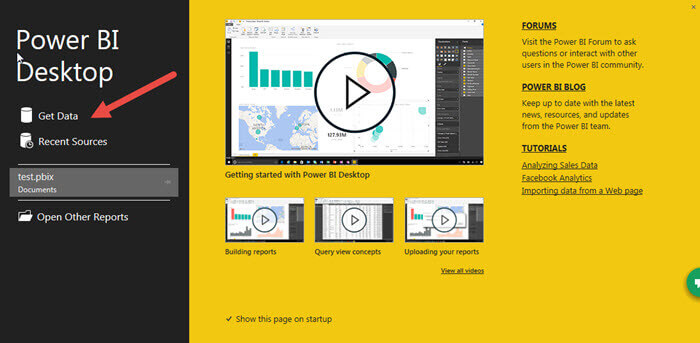
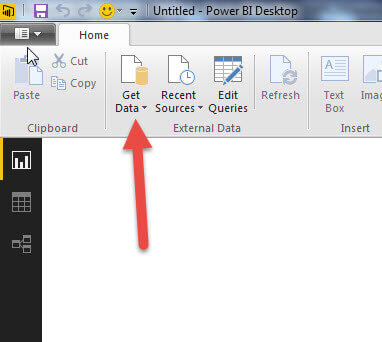
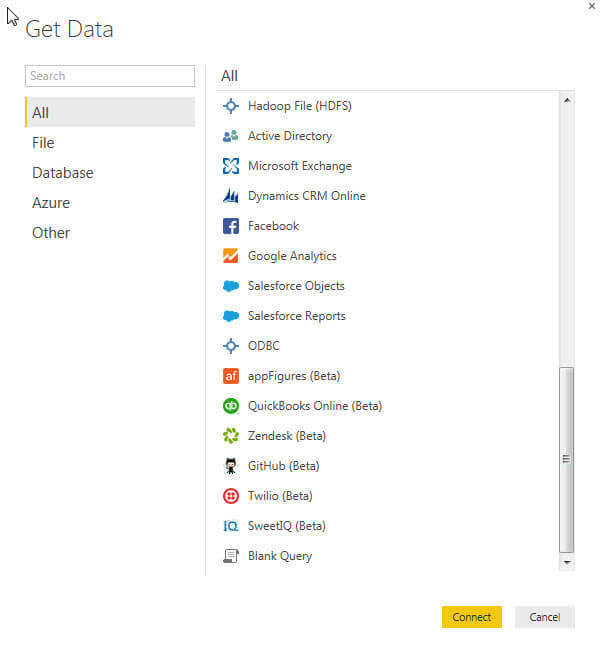
When you open PBID, the start screen, as shown below, allows you to start the query process via clicking on Get Data. Alternately, if you bypass the start screen, you can click on the Get Data button in the ribbon.
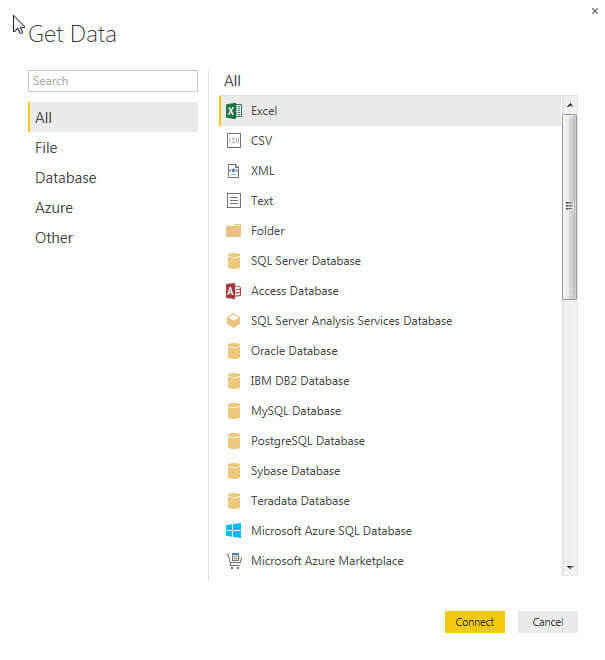
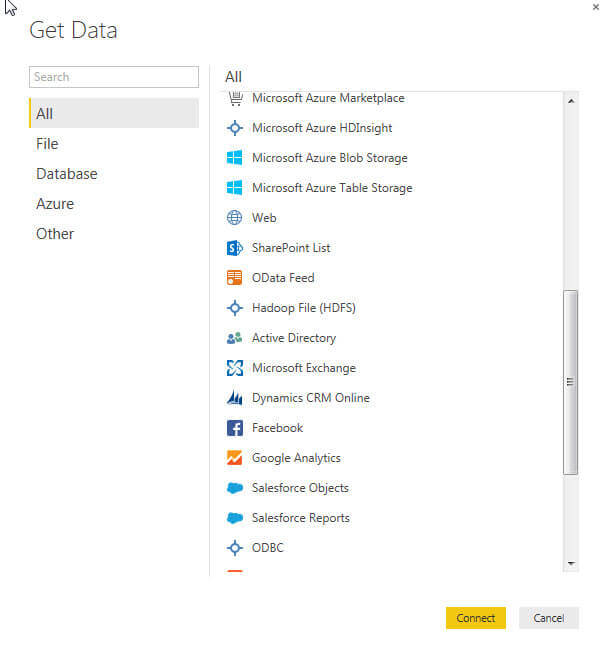
Both options open the data source selection screen. As you can see from the three illustrations below, the data source list is both long and growing each month. You will note some are still in beta mode, some, like SQL Server, Excel, and Access are "old stand bys", while others I find to be particularly noteworthy including:
- Folder- This source allows you to examine the meta data of all the files and sub-folders in a folder
- Microsoft Azure MarketPlace, Azure SQL Database, Azure HDInsights, Azure Blob Storage, Azure Table storage - These sources provide a tight integration with Azure based services
- Web - Web based html tables can be scraped to get data
- SharePoint Lists - SharePoint lists data can be extracted from a SharePoint site
- Hadoop - Allows for easy retrieval of Hadoop based data structures
- Google Analytics - Surprising to me is the availability of Google Analytics as a data source
- SalesForce Objects and Reports - Opens up access to SalesForm CRM data and reports
- ODBC - If all else fails, hopefully a data source allows for ODBC based connections
You need to be aware that many of these data sources will require you to know and setup the connection string details without much assistance from a fully automated wizard. Some of the sources provide more details than others. Be sure you know the pertinent details to setup a connection (server and URL names / addresses, ports, databases names, user ids, passwords, etc.).
Working with SQL Server Data in the Power BI Desktop
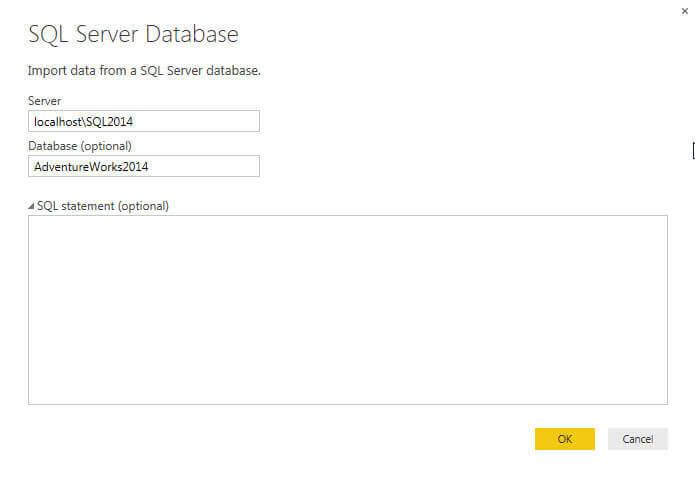
In order show the full functionality of the query tools, we will use one of the data sources for now. I hope to complete tips on the various data sources in the near future. As such, the first query we will create is from the AdventureWorks database; thus it will be a SQL Server data source. As shown below, the SQL Server data source requires the server and, optionally, a database name and a SQL Statement.
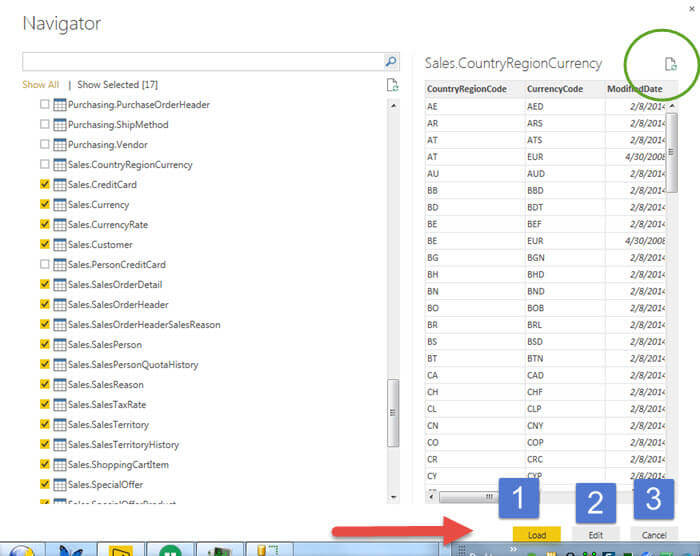
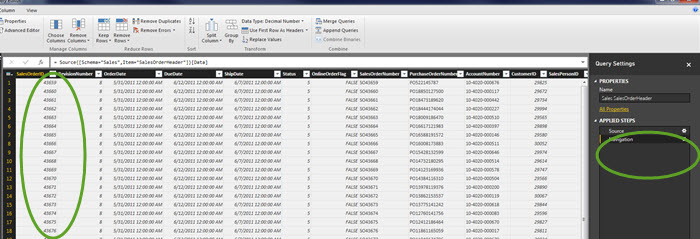
After filling in the server and database and clicking ok, the Navigator screen opens. As seen below, this screen allows for the selection of individual tables from the AdventureWorks database. You should take notice of a couple of items. First, when you click to select a table, a preview of that table shows on the right side of the screen; to stop the preview, you can click on the refresh button which appears in the upper right part of the screen (see green circle below). Furthermore, you have three options for completing the selection of your data: 1) Load runs the queries and returns the data back to the PBID main screen, 2) Edit allows you to adjust each query (details about this option will be described below), or 3) Cancel the new data source load altogether. For this example, I selected load which ran each of the queries (similar to running a SELECT * without any criteria).
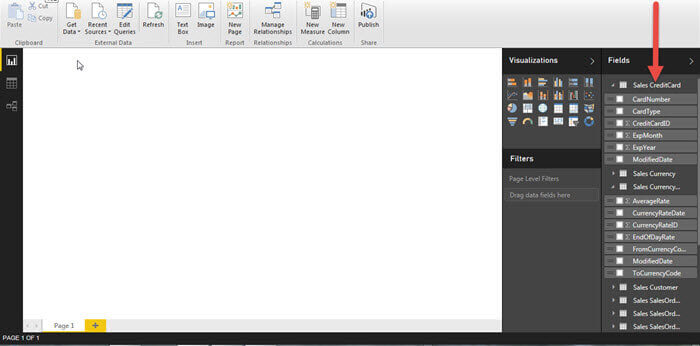
Now that we have loaded the various tables into the Desktop design window, as illustrated next, we could begin dragging and dropping the tables and fields onto the dashboard design grid. However, this tip is on the query process, so will save the dashboard design for another tip.
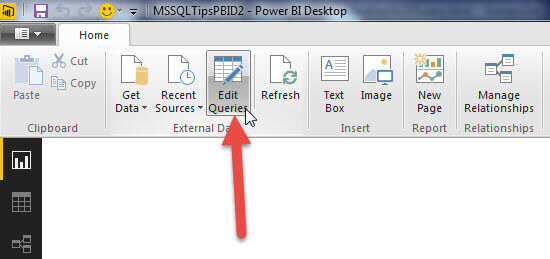
Edit the Power BI Queries
Thus, we are going to modify the queries we have created by clicking on the Edit Queries button in the ribbon.
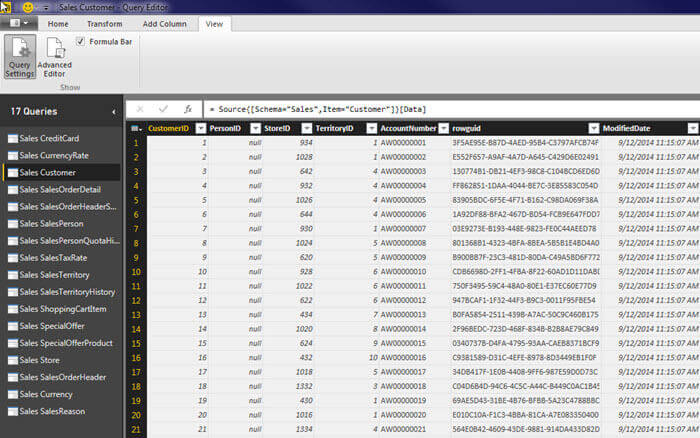
Now we can actually edit the queries to match the requirements for a report's design. The main Edit query window opens in a completely separate window as a shown below.
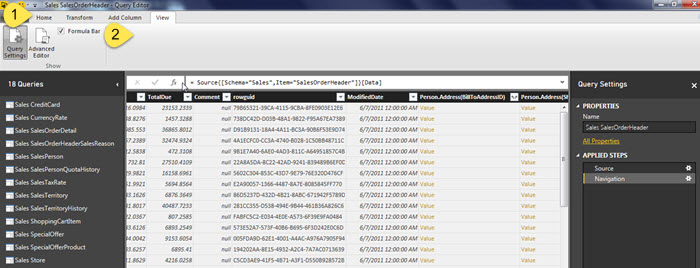
To allow for access to some additional information right at the get
go, I would recommend immediately jumping to the View tab on the Ribbon, as seen
below and then 1) click on the query settings button which will show
several properties in the Query Settings property box (right side in
below screen print) and 2) click the Formula Bar check box. The formula bar will
allow the query designer to see what formula is being used to retrieve the data.
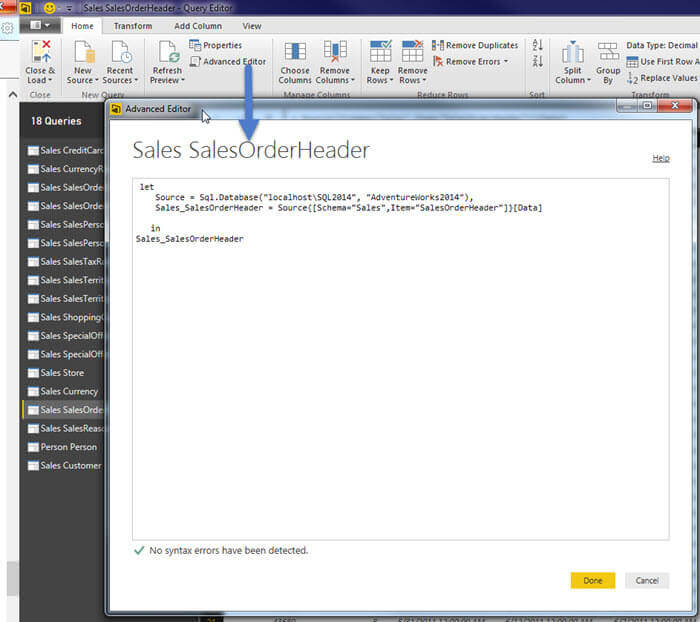
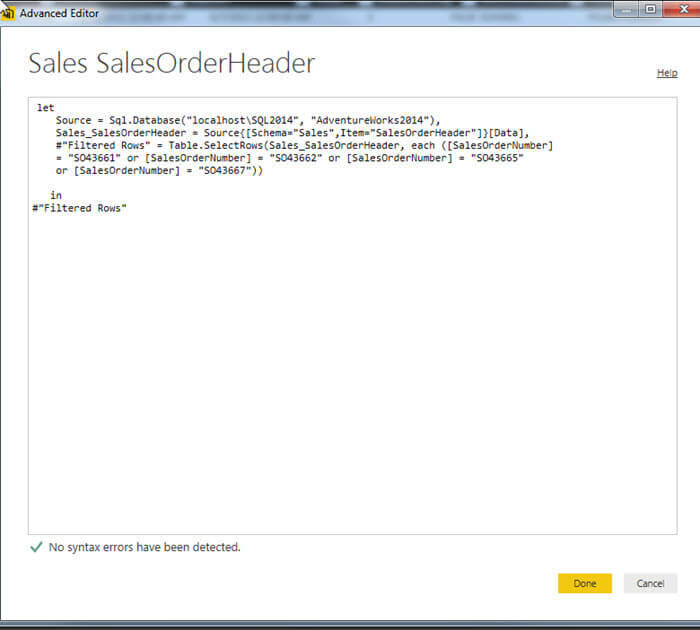
Advanced Editor in Power BI Desktop
Another interesting view is to jump back to the home tab, and click on the Advanced Editor option. This button appropriately opens the advanced editor window, but more importantly shows you the query that is being executed against the data source. The syntax may look unfamiliar to you; PBID uses M, the Power Query Formula Language. I hope to do an upcoming tip on using the Power Query Formula Language, but for now, you can see in the below illustration the language specifies the data source connection and then requests the data from the SalesOrderHeader. The second illustration below filters on SalesOrderNumber (4 sales orders to be exact). You can see the filter details show up in M query.
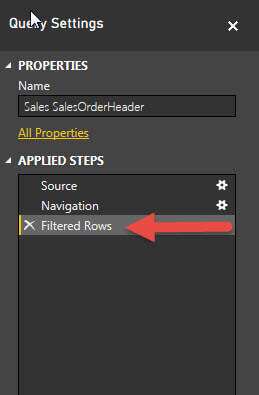
Filtered Rows in Power BI Desktop
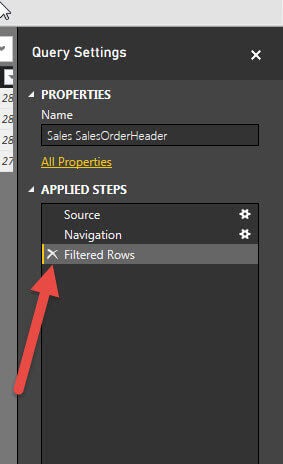
You will also notice that once the filter was applied (you apply a filter similar to how you would in an Excel table by clicking the down arrow next to the column header), the Query Settings actually shows that the results were filtered by adding a Filtered Rows line to the Applied Steps.
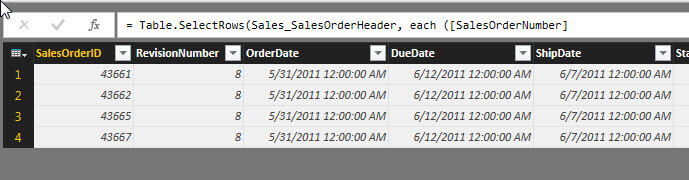
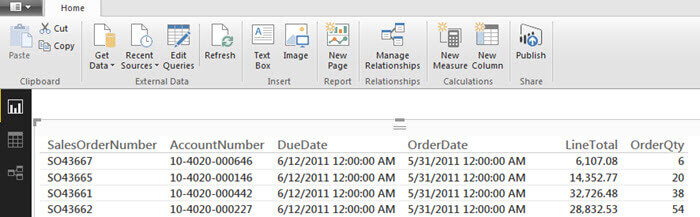
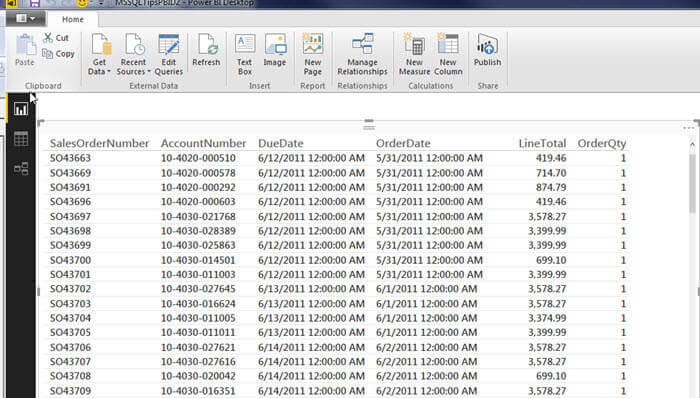
These filtered results are then the basis for the data loaded onto to the main dashboard design grid; notice in the below illustration from the design grid that only the 4 filtered rows appear in the report results.
The neat part is that we can easily go back to the
Edit Queries window and "undo" our filter in the Query Setting window.
As shown below, by clicking on the X icon next to Filtered Rows, we can
remove the filter which results in all rows now being returned to the
query results.
Modifying Columns Displayed in Power BI Desktop
If we again select close and load on the Edit
Query window, now all the rows are shown in our dashboard, as seen in
the below illustration.
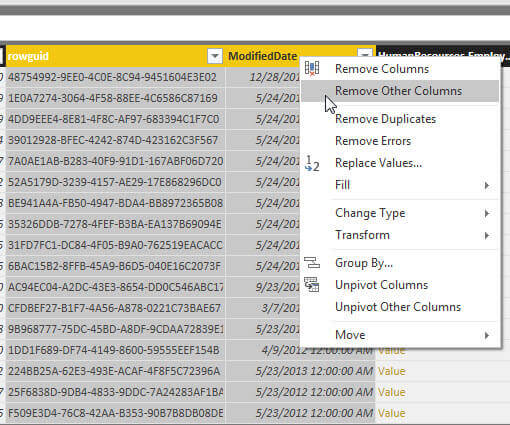
Just like it is not a good idea to do a "SELECT
*" in regular T-SQL, it would also be beneficial to include only the
columns we need for our reports. Thus the Query Editor provides a quick
way to remove columns from a query by selecting the columns to be
deleted and then right mouse clicking and selecting Remove Columns (or
you could keep the selected columns by selecting Remove Other
Columns).
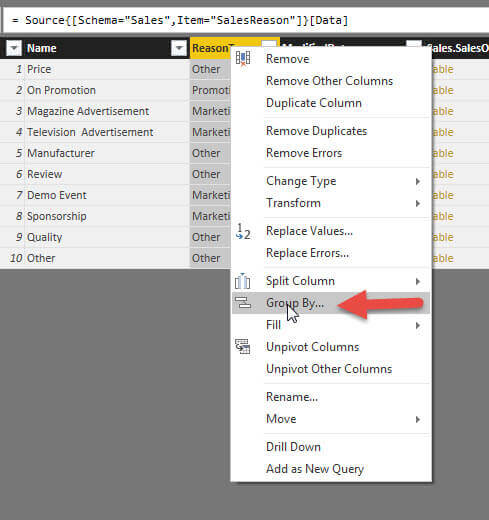
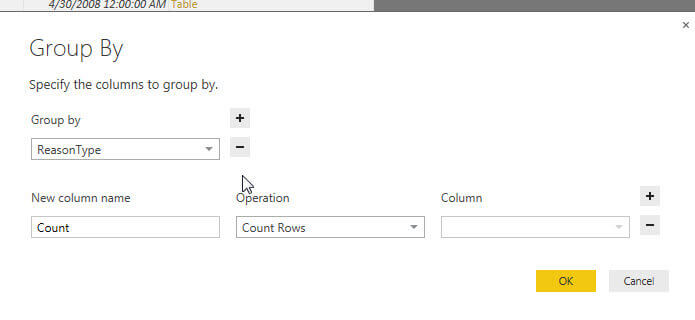
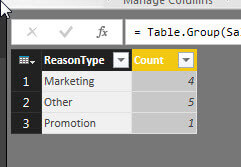
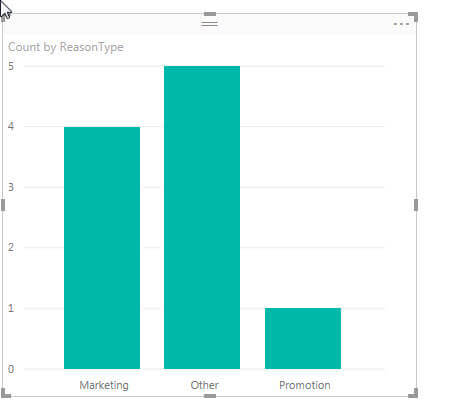
Group By in Power BI Desktop
An alternate transformation that we can complete
is a Group by rollup. As shown below, we can transform the Sales Reason
table into a rollup count by ReasonType using the Group by
functionality. The below series of illustrations show the transformation that
the table goes through to eventually generate a quick graph that shows the
Count of ReasonTypes.
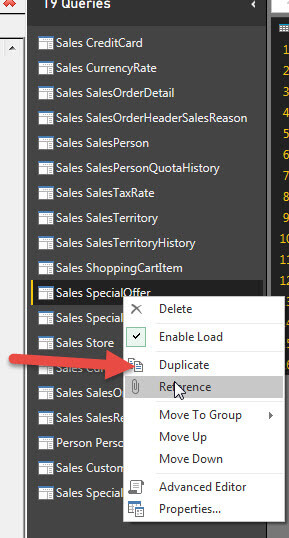
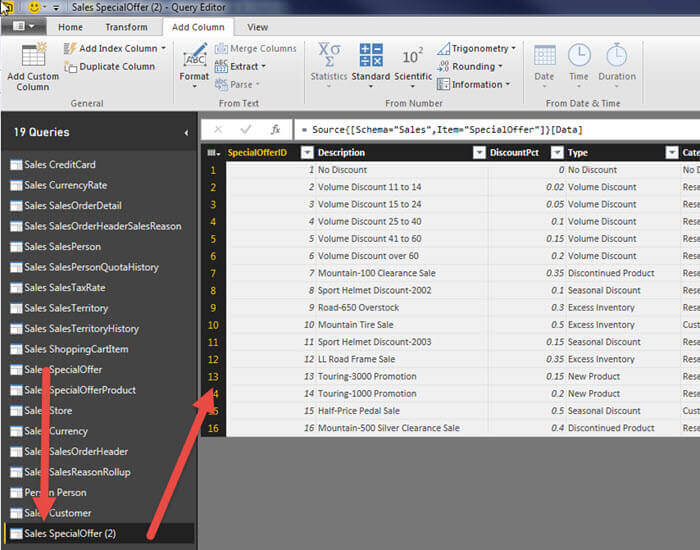
Duplicate a Query in Power BI Desktop
We can also easily duplicate a query table
by right mouse clicking on a table and then selecting Duplicate. Now we
have the ability to make adjustments to the new query without impacting the
original query.
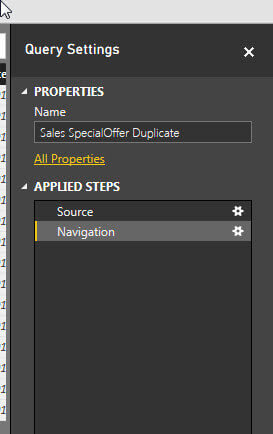
Rename a Query in Power BI Desktop
Furthermore, we can easily rename the query, as shown below, by editing the Name Property.
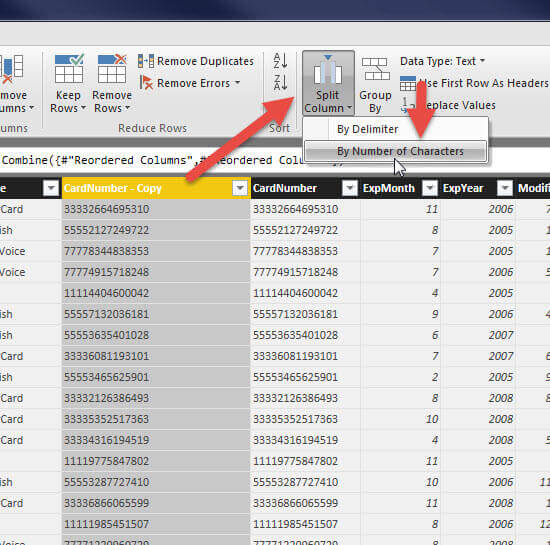
Split a Column in Power BI Desktop
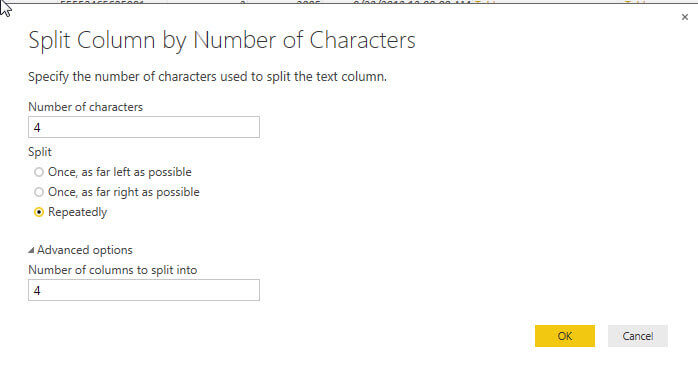
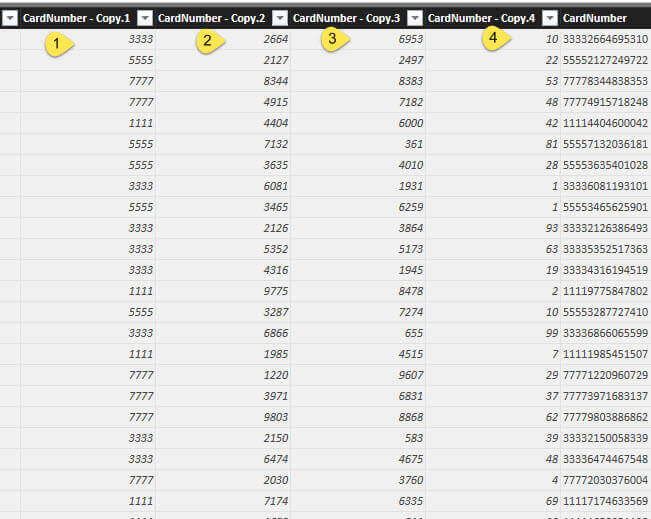
Next we can easily parse out a column by
splitting a column into several parts. First as illustrated below, we
select the column, then click Split Column and choose by Number of
Characters. Next, we tell the query designer how to split up the column
and finally tell it to do the split repeatedly until the end of the
string.
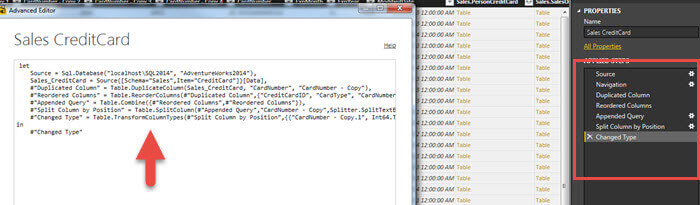
Review of Advanced Editor with all Changes
If we review both the Advanced Editor and the Query
Settings in the below screen print, you will notice that it shows all
the work we have done on the query including duplicating a column,
reordering the column, and splitting the column.
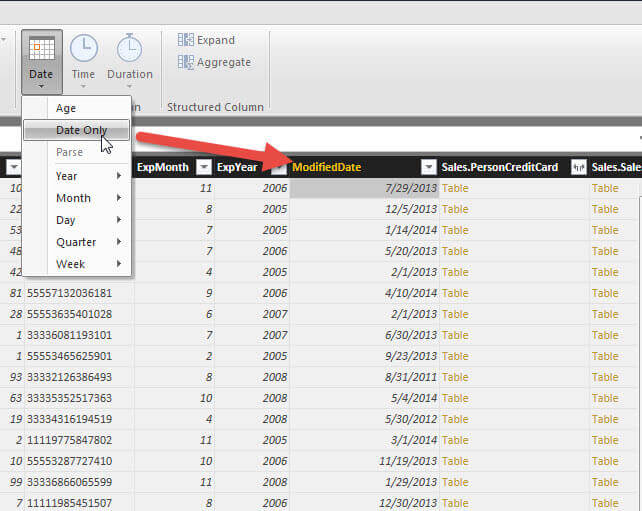
Data Type Change in Power BI Desktop
Finally, we can easily change the data type of a
column. For instance, we can adjust a DateTime field to Data Only by
using the date only functionality.
Conclusion
The Edit Query functionality in the Power BI Desktop (PBID), even in these early stages of its release, contains a rich set of features and functionality. For instance, PBID provides the ability to: 1) duplicate a column 2) split a column into parts 3) to change column data types. Furthermore, we can filter the data based on column values which in turn filter the results on the dashboard. Finally, we can use the group by function to aggregate values in a query. We have touched just the tip of the BPID functionality, so look for more tips on the new Power BI Desktop and how to get the most out of this new tool.
Next Steps
- Extracting a SharePoint List with Power Query - /sqlservertip/3625/extracting-a-sharepoint-list-with-power-query/
- Introduction to Power Query for Excel - /sqlservertip/3588/introduction-to-power-query-for-excel/
Learn more about Power BI in this 3 hour training course.


About the author
 Scott Murray has a passion for crafting BI Solutions with SharePoint, SSAS, OLAP and SSRS.
This author pledges the content of this article is based on professional experience and not AI generated.
View all my tips
