By: Nat Sundar | Comments | Related: > Power BI Charts
Problem
I have read the previous tips #1 and #2 about analyzing UK Petition data using Power BI and I am able to load all open petition details in Power BI. How can I develop a map showing the signature counts based on UK constituencies?
Solution
Petition Details
In the previous tips we have learned to use the UK petition details. In these feeds, the petition details have been represented at a very high level and have the following information (Petition ID, Signature count, created date, etc.).
In addition to these details, the UK parliamentary system will allow you to download the low-level details of an individual petition as well. This low-level detail contains the information such as the signature counts for each constituency.
This information is vital to understand how the petition has been received by the public across the country. It would be a great report, if we could place these details on a UK map. However, by default Power BI can only add a UK geographical map, so we need a custom map to represent all UK constituencies.
Custom maps are required in many places to satisfy the need of the business. For example, in retail, an organization may want to represent the sales by its sales region which may not align with the geographical state and zip codes. The same requirement is true for a service-oriented industry as well.
In this tip, I will walk through the procedure to create a custom map in Power BI.
Power BI Shape Map Visual
In this tip, I will be using the shape map visual to create a custom map. This visual is available as a preview and the full production version is not available yet. You need to enable the preview option to create a custom map.
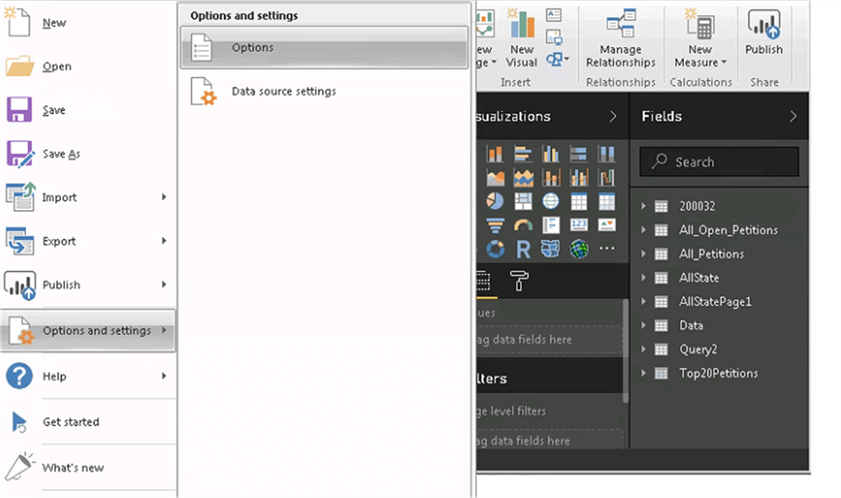
To enable this option, click on "Options and settings" and click "Options" to open the Options dialog.
On the "Options" dialog box, under Global, select "Preview features" and check the "Shape map visual" to enable the visual.
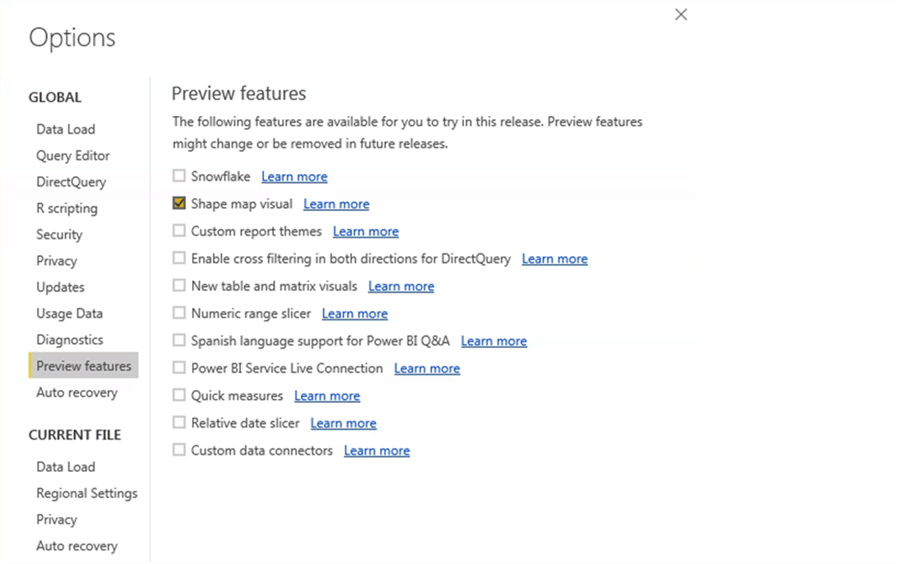
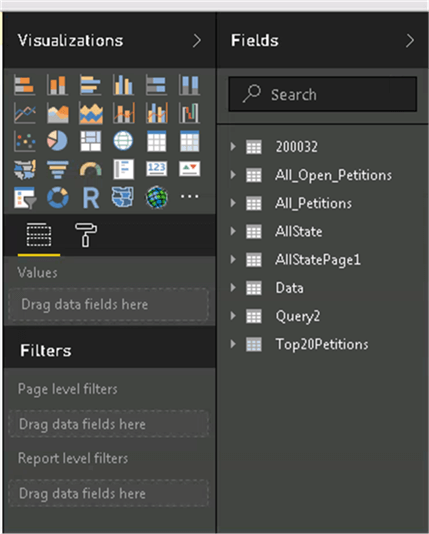
Once done, you will be able to see the visual in the visualization pane.
The Shape Map visual needs a TopoJSON file as input. This TopoJSON file contains the boundary definition of a map region. The shape map visual will make use of the TopoJSON file to generate the custom map.
Creating TopoJSON file
It’s a very long process to create a JSON file and that’s not in the scope of this tip. However, I will give a brief description to help you to understand the overall process. We need Google maps and few open source tools to create the TopoJSON file. This process consists of three steps.
The first step is to create a map region using Google maps. In Google maps, using the "Your places", maps, "Create maps" you can create your own map. This will allow you to draw a polygon over the interested region. Once you are done, save with a suitable name and export the map to a KML file. As a next step we need to convert the KML file to GeoJSON and then we can convert GeoJSON to TopoJSON.
Using the TopoJSON file
Once the TopoJSON file has been created, we can use this to load data into Power BI. Fortunately, the UK parliamentary constituency map regions have been already developed in the TopoJSON format and they are available for us to integrate readily from GitHub. The below link will help you download the file "WPC.JSON".
https://github.com/martinjc/UK-GeoJSON/tree/master/json/electoral/gb
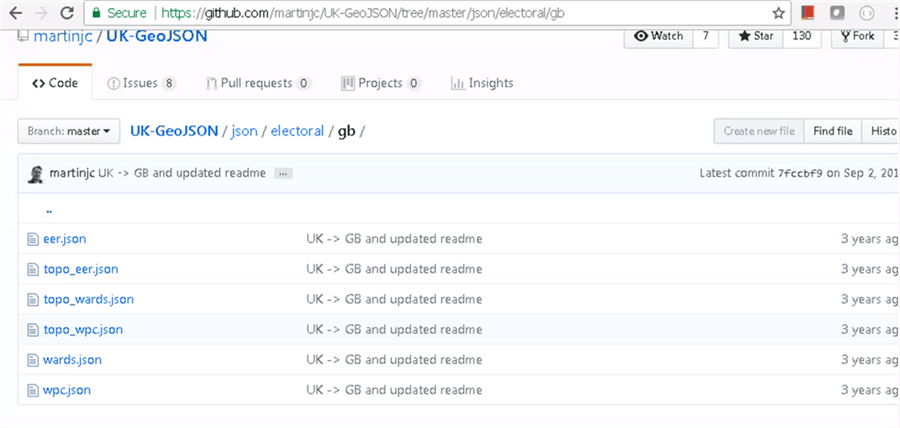
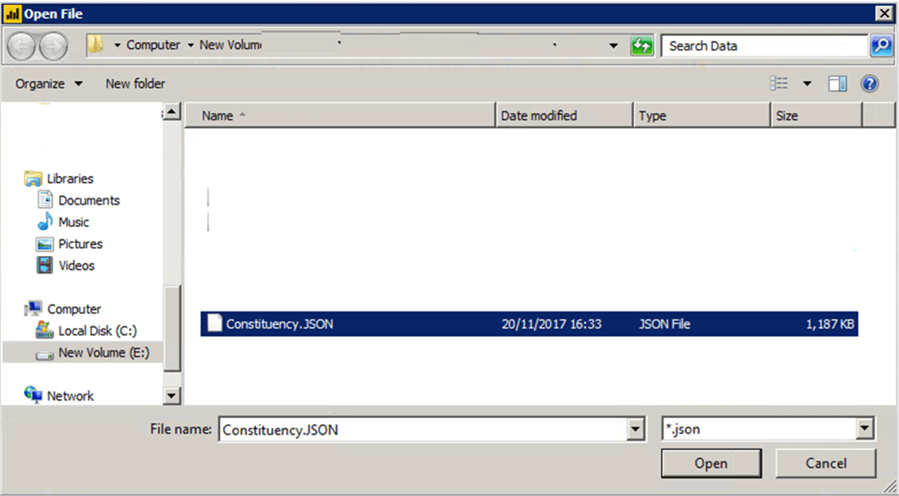
In my case, I have downloaded and renamed the file as "constituency.JSON" for easy understanding.
Signature Count by Constituency
In this tip, I will walk through the procedure to develop a map to represent how the UK public has reacted to a petition across the country by parliamentary constituencies.
The JSON feed https://petition.parliament.uk/petitions/200032.json provides signature count details by UK constituencies.
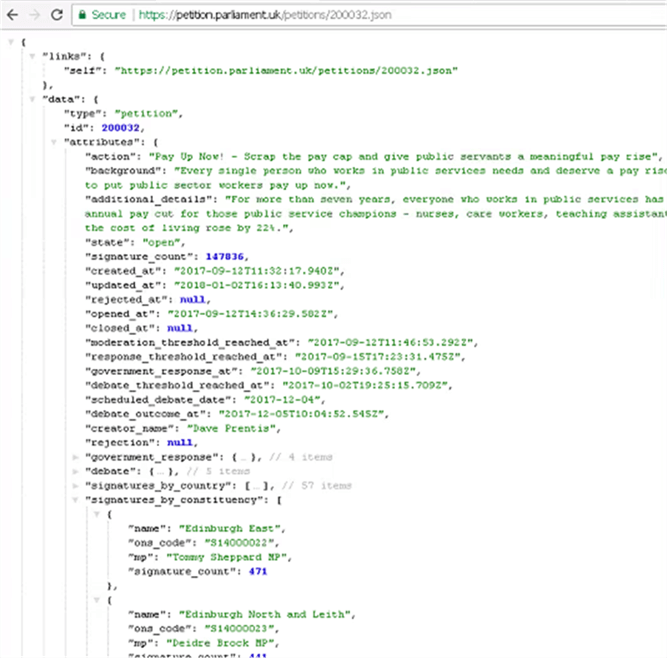
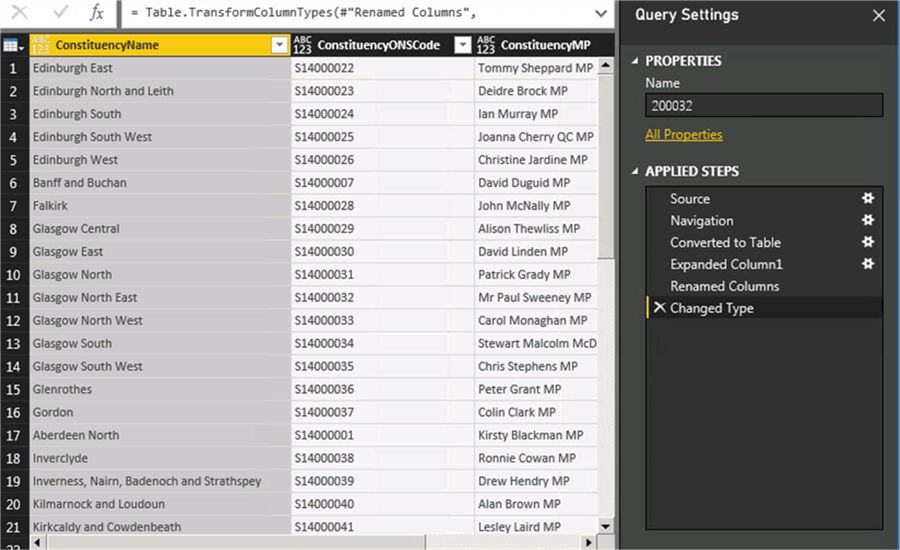
Now let’s load this JSON feed into Power BI. Once loaded the data table will look like the below image.
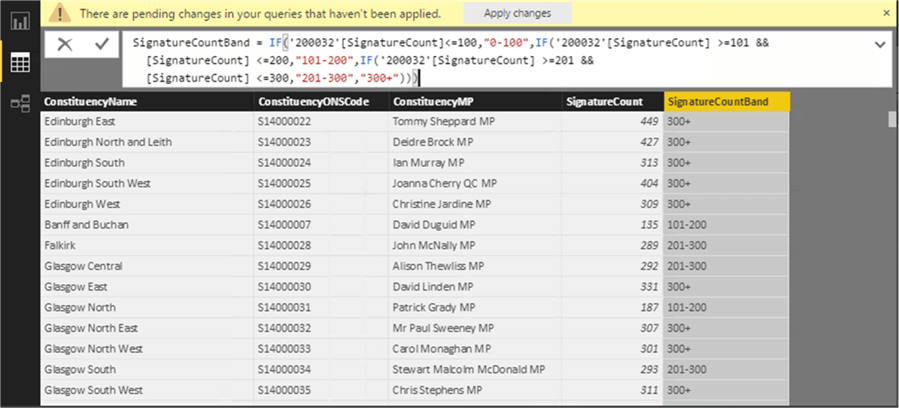
To allow me to group the signature count, I have created a “SignatureCountband” column with this definition.
Adding the Shape Map Visual to the Reporting Pane
Now let’s add the Shape map visual to the reporting pane as shown in the picture below.
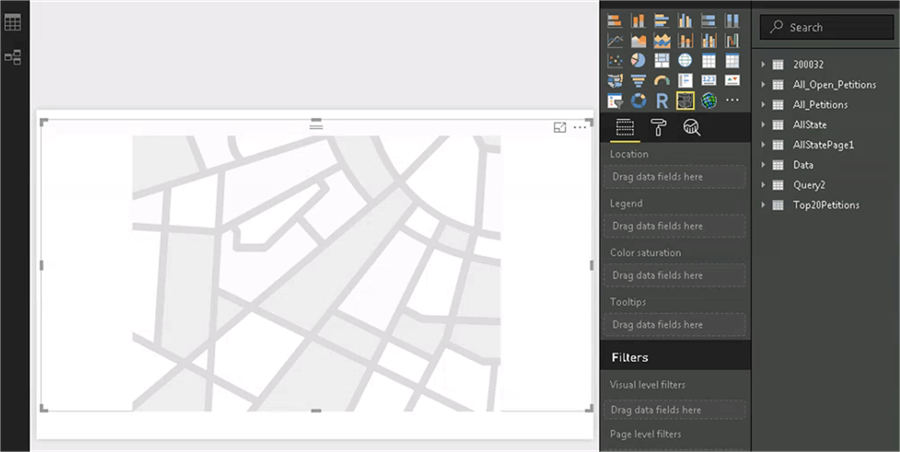
Once done, add the "Constituency Name" column to the Shape map visual.
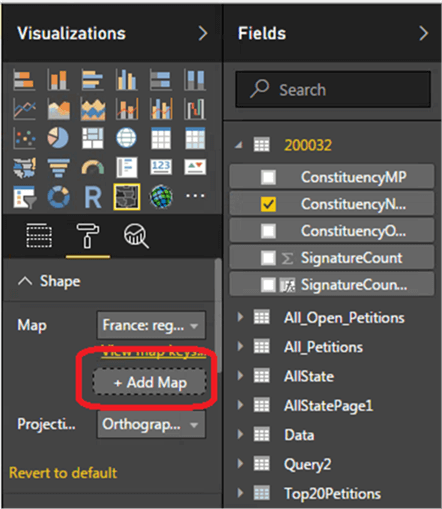
As soon as you have added the field to the visual, you will see the property “Shape” under the format section. Click on the “Add map” to upload the TopoJSON file (Constituency.JSON) for our custom map.
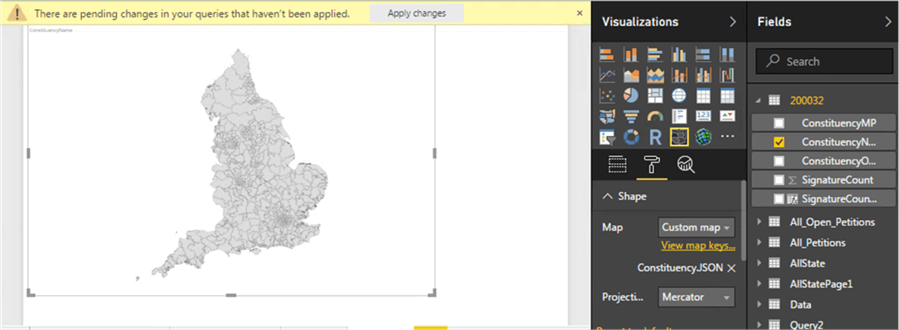
Now you will be able to see an initial view of the UK constituency map in Power BI.
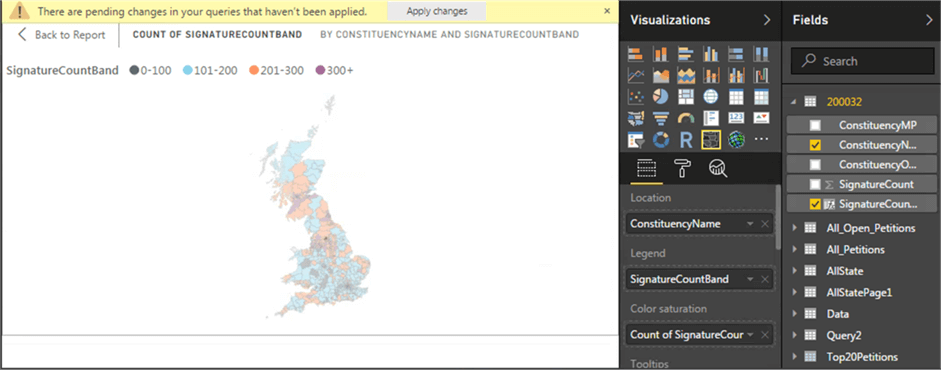
After selecting the column “Constituency Name” and the "Signature Count Band” for the Location and Color Saturation, you will be able see how the UK public has reacted to this petition by the constituency.
Summary
In this tip, we have learned how to utilize the Power BI Shape Map visual to develop a custom map.
Next Steps
- Read other Power BI tips.
- Check out the previous tips:
Learn more about Power BI in this 3 hour training course.


About the author
 Nat Sundar is working as an independent SQL BI consultant in the UK with a Bachelors Degree in Engineering.
This author pledges the content of this article is based on professional experience and not AI generated.
View all my tips
