By: Rick Dobson | Updated: 2022-04-29 | Comments | Related: > TSQL
Problem
Show me how to display in Excel Heikin Ashi charts based on financial time series data stored in SQL Server. Also demonstrate how to compute in SQL Server Heikin Ashi candlestick values as well as a method for easily transferring the computed candlestick values to Excel. Conclude with data visualization comparisons of Heikin Ashi computed candlesticks versus observed candlesticks for high, low, open, and close prices.
Solution
Heikin Ashi charts are a special kind of candlestick chart. A traditional candlestick chart represents open, high, low, and close prices for a set of periods, such as hours, days, or weeks. The prices for each time period are represented by a single candlestick. The collection of candlesticks over multiple periods denotes a time series of prices that represents a security's price behavior. Instead of plotting observed open, high, low, close prices, as in traditional candlestick charts, Heikin Ashi charts compute average candlesticks based on the current period and its prior time period. The Heikin Ashi candlesticks are based on computed values instead of actual price observations.
The candlestick chart was originally created for the use case of tracking rice market prices in Japan during the 1700's. Since the early 1990's, open, high, low, close candlestick charts and Heikin Ashi charts are used for other types of markets, such as stocks, bonds, treasury bills, commodities, fiat currencies, and crypto currencies. This prior MSSQLTips.com article introduces database professionals to candlestick and Heikin Ashi charts. The charts in the prior tip were based on data stored and charted at either the Yahoo Finance site or the Stooq.com site.
This tip extends the coverage of candlestick charts by taking advantage of financial time series data stored in SQL Server. Two prior tips (here and here) provide examples of how to migrate financial time series data from Yahoo Finance and Stooq.com to SQL Server. The current tip extracts selected time series data for different ticker symbols from SQL Server, optionally computes Heikin Ashi chart values, and displays the observed open, high, low, and close candlestick values along with the Heikin Ashi candlesticks (when they are computed). The displayed data are copied from SQL Server to Excel. Then, built-in Excel chart features are adapted for creating traditional candlestick as well as Heikin Ashi charts in Excel. The Excel built-in features are all based on user interfaces (no programming is required for displaying charts).
An example of a candlestick chart for data from SQL Server
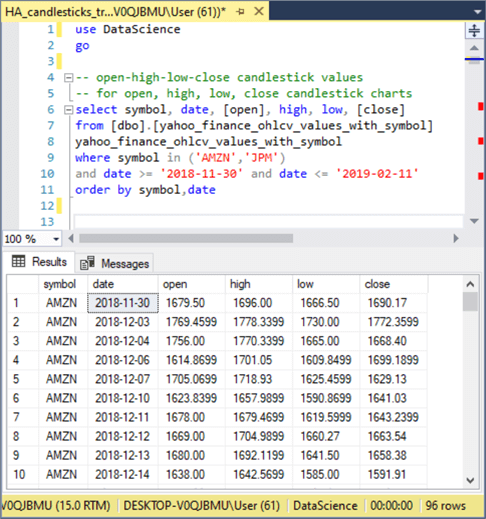
The following screen shot shows a short T-SQL script for displaying open, high, low, close prices for two ticker symbols (AMZN, JPM); AMZN is for Amazon.com, Inc., and JPM is for JPMorgan Chase & Co. The prices for the two tickers are collected for time series starting in 2018-11-30 and running through 2019-02-11. The Results tab in the screen shot shows the first ten rows from the results set.
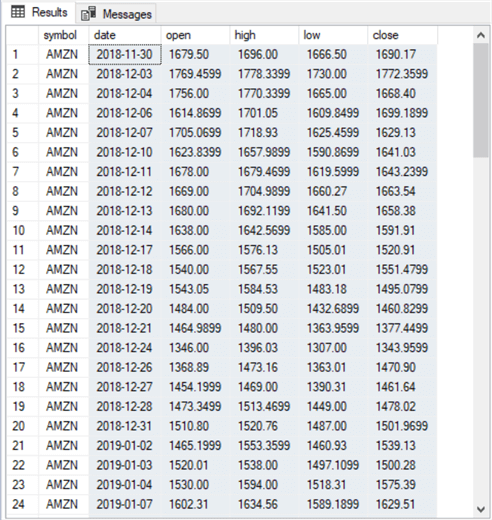
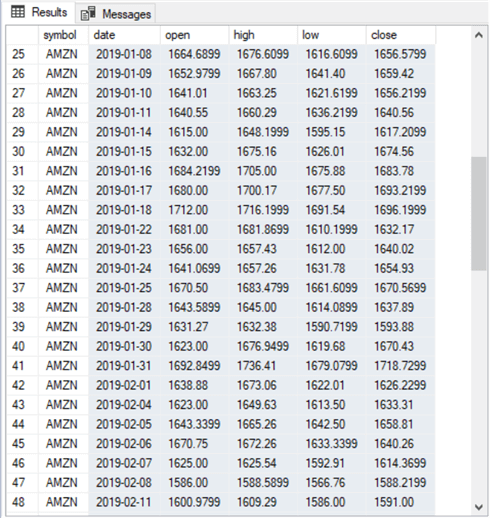
The next table presents the full results set for the AMZN ticker with its date, open, high, low, and close column values selected (these values are shaded). After copying the selected set of rows into the Windows clipboard from SQL Server, you can paste the rows into a blank tab of an Excel workbook file.
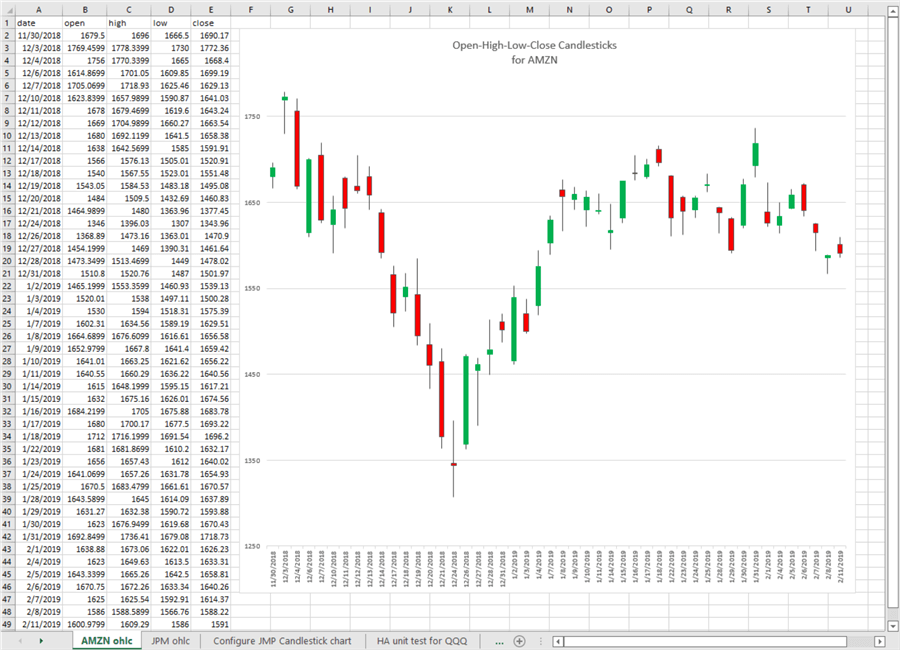
The following screen shot shows an Excel tab with a candlestick chart to the right of the copied data.
- Candlesticks with a green body denote dates for which the close price is greater than the open price.
- Candlesticks with a red body denote dates for which the close price is not greater than the open price.
- Candlesticks with a wick above the top of their body identify dates for
which the high price is greater than the price at the top of the candlestick
body.
- When the close price is greater than the open price, then the price at the top of the candlestick is the close price.
- When the close price is not greater than the open price, then the price at the top of the candlestick is the open price.
- Candlesticks with no wick above the top of their body indicate that the high price is the same as the price at the top of the candlestick body.
- Candlesticks with a wick below the bottom of their body identify dates for
which the low price is less than the price at the bottom of the candlestick
body.
- When the open price is less than the close price, then the price at the bottom of the candlestick is the open price.
- When the open price is not less than the close price, then the price at the bottom of the candlestick is the close price.
- Candlesticks with no wick below the bottom of their body indicate that the low price is the same as the price at the bottom of the candlestick body.
Configuring a candlestick chart in Excel
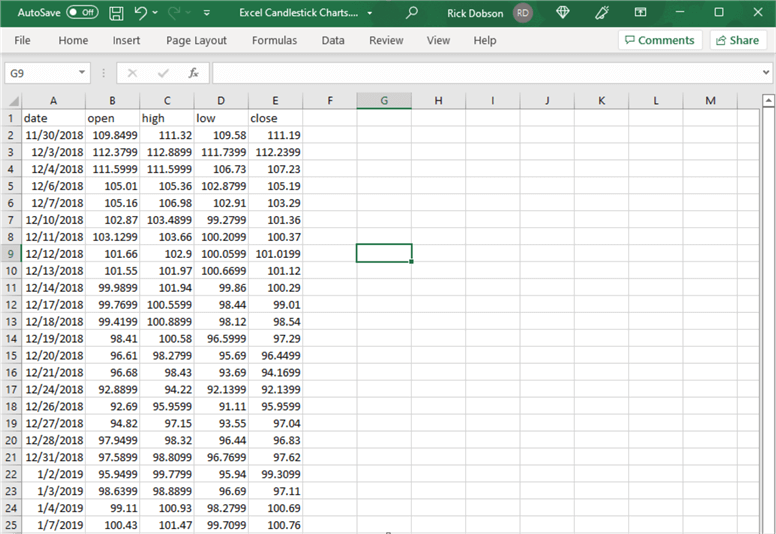
The following screen shot shows an excerpt from a tab in an Excel workbook file after it is populated with data for the JPM ticker.
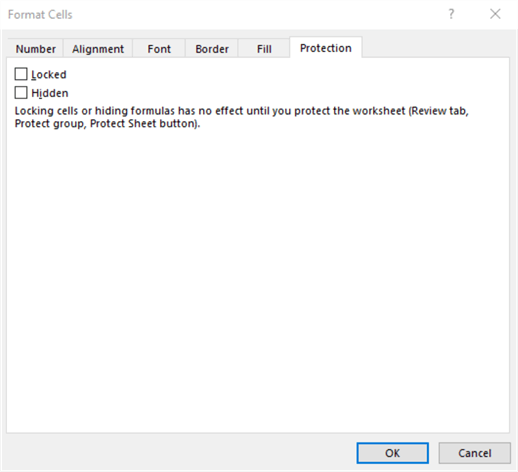
The next step is to unprotect the tab. Click the triangle above the value of 1 denoting the first row and choose Format Cells > Protection. Make sure the Locked and Hidden check boxes are both cleared (see below). Then, click OK to commit the change(s). The configuration is necessary in order to make the OK button ungrayed out when you try to add a candlestick chart to a tab.
Next, perform the selections to add the candlestick chart to the Excel tab.
- Start by selecting all the data for the chart.
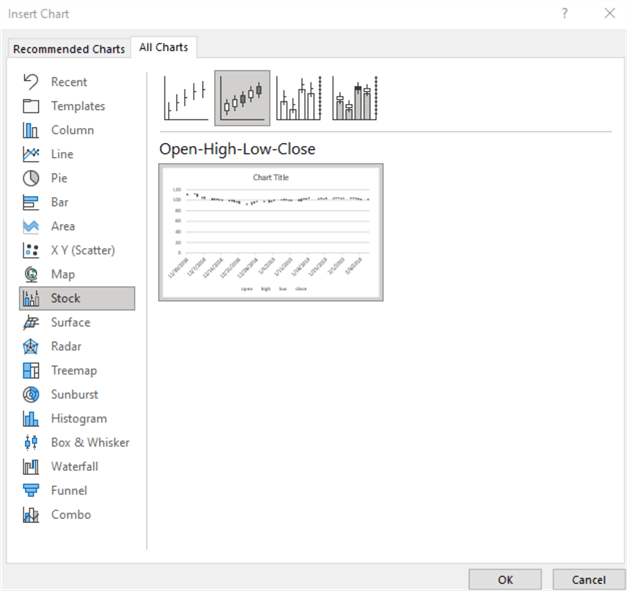
- Next, choose Insert > Recommended Charts > All Charts > Stock.
- Then, select the candlestick chart image (see the image below).
- Close the Stock chart menu by clicking OK.
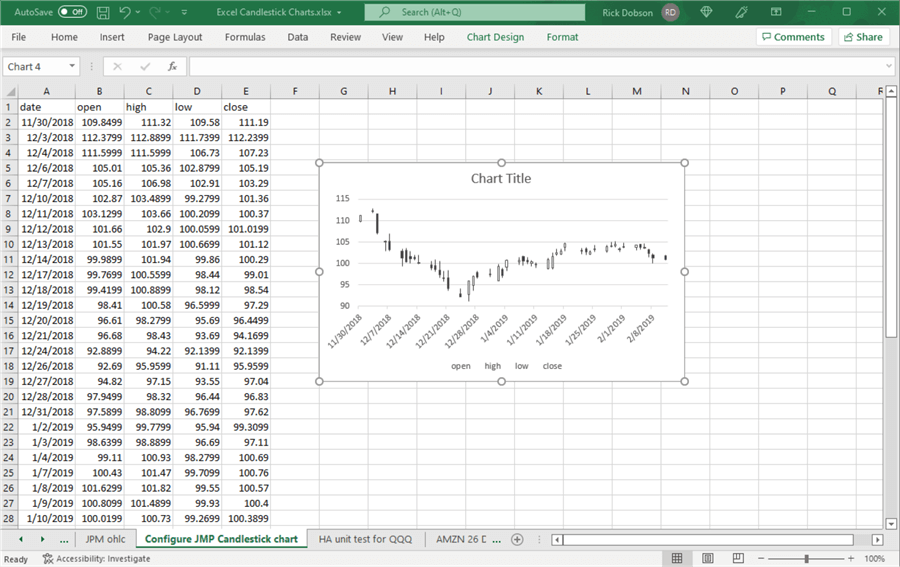
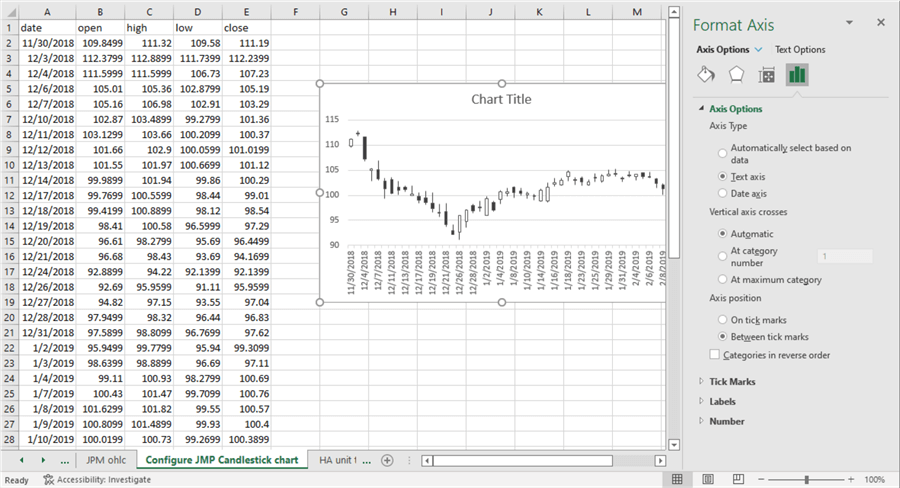
Select the vertical axis for the freshly added candlestick chart and set the bounds to remove excessive white space above and below the candlesticks in the chart. Here's the tab with the chart image after resetting the vertical axis bounds. The legend towards the bottom of the chart containing open, high, low and close is unnecessary. You can remove the unnecessary legend by selecting it, and then pressing Delete on your keyboard.
The next step is to reset the horizontal axis to not include weekend days and other days, such as January 1 and Christmas day, when trading markets are closed. You can do this by right clicking the horizontal axis labels and choosing Format Axis. Next, choose the Text axis radio button under Axis Type. While you are in the Format Axis menu, you can click the Size and Properties icon (it looks like a cross). Change the Text Direction drop-down box to Rotate All Text to 270⁰. Then, exit the menu.
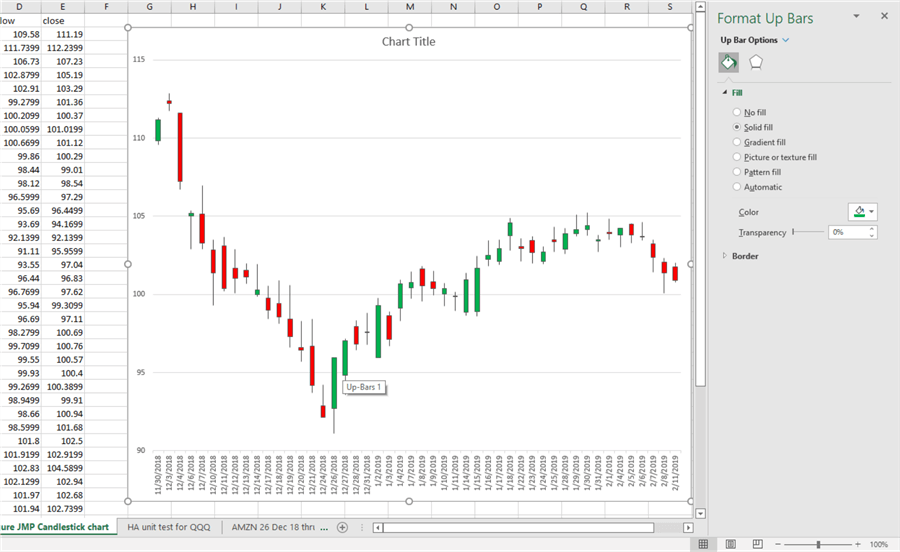
Next, right click any black filled candlestick and choose Format Down Bars 1. You may have to click in multiple spots on the candlestick body to have the menu item (Down Bars 1) appear. Then, from the Fill menus on the right choose a color of Red for the down bars; also choose Solid fill. Perform the same kind of task for the hollow open bars but choose Green as the fill color for the Up bars; also choose Solid fill. After closing the Format Up bars menu, you may notice that the last date or two does not show on the horizontal axis. If this occurs, simply stretch the right chart edge farther to the right until all selected dates appear on the chart.
Expressions and processes for computing Heikin Ashi values
As indicated in the Solution section, Heikin Ashi charts display computed values based on current period and prior period prices. This section reviews the computational expressions and the process for computing Heikin Ashi values with T-SQL. Additionally, a T-SQL example is presented and compared to a previously published introduction to Heikin Ashi charts at StockCharts.com. The comparison serves as a unit test for the code described in the current tip.
The four key expressions for Heikin Ashi (HA) charts compute HA_close, HA_open, HA_high, and HA_low values for the current period. These expressions are highlighted below. As you can see, the HA values are dependent on a combination of HA values as well as open, high, close price observations for the current and prior periods.
HA_close = (open_current + high_current + low_current + close_current)/4
HA_open = (HA_open_prior + HA_close_prior)/2
HA_high = maximum of (high_current, HA_open_current, or HA_close_current)
HA_low = minimum of (low_current, HA_open_current, or HA_close_current)
In order to start the computation of a full set of Heikin Ashi values for a set of periods, you require an initial row of Heikin Ashi values for the first prior period. The first prior period is different than subsequent prior periods because there is never an antecedent period for the first prior period. Different authors take slightly different approaches to designating the first set of prior period values. The StockCharts.com article used as a reference for this tip discusses one strategy and then implements another strategy for arriving at the first set of prior Heikin Ashi values. This tip implements the one demonstrated in the StockCharts.com article. In any event, StockCharts.com indicates that the choice of the first set of Heikin Ashi values usually becomes immaterial after 7 to 10 periods because of the iterative nature of the HA computational process. That is, the HA values for the current period become the prior HA values for the next period. Therefore, by the beginning of the seventh or tenth period, the impact of the first period values is outweighed by the impacts of the second through the sixth or ninth period values.
In this tip, the first period HA open, high, and low values are just the observed open, high and low values for that period. In contrast, the HA close value for the first period is the average of the open, high, low, and close observed values for the first period.
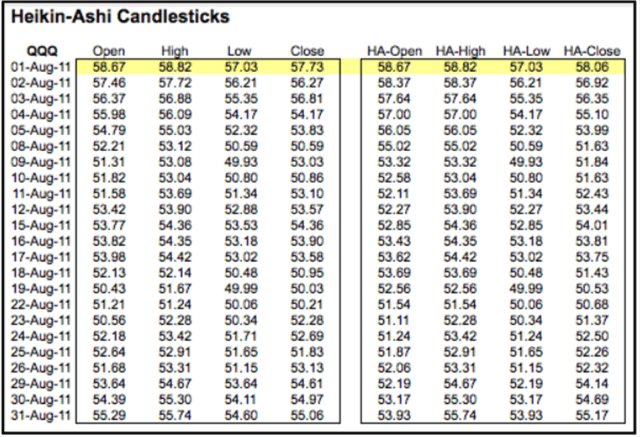
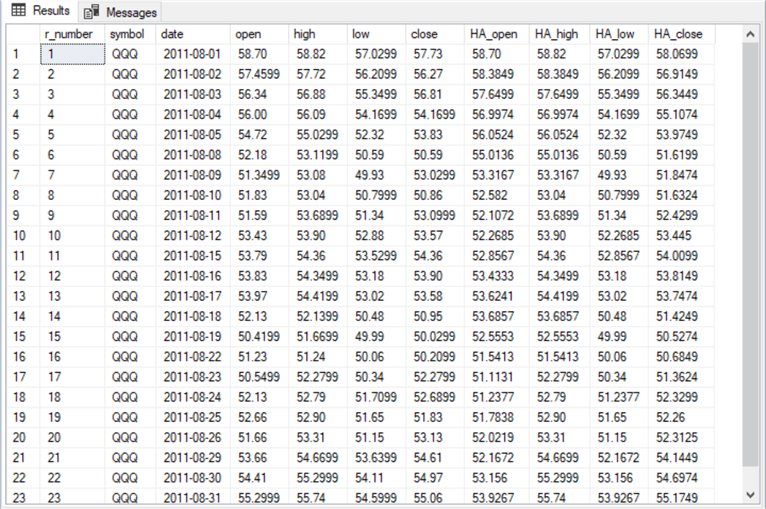
The next screen shot shows both the observed open, high, low, close prices as well as the computed HA_open, HA_high, HA_low, and HA_close values for the QQQ ticker for the August trading days during 2011 from the previously referenced StockCharts.com article introducing Heikin Ashi charts. The numbers on the left box within the screen shot are observed values, and the numbers in the right box within the screen shot are computed HA values. Before proceeding further, it may be worth pointing out that I discovered slight discrepancies between the open price observations in the screen shot below and the most recently available open prices from the Yahoo Finance site. These differences are so slight as to be immaterial. This tip uses the most recently available open price observations as of the time this tip is prepared.
The process for computing Heikin Ashi values with T-SQL operates as two separate parts.
- The main objective of the first part is to compute the HA values for the
first row as well as compute the HA_close values for all the remaining rows.
- Another objective of the first part is to add the HA values computed in the first part to the observed open, high, low, and close price observations.
- The HA values for the first period date as well as HA_close values for all remaining dates are not dependent on any prior period values.
- On the other hand, the HA expressions above show that HA_open, HA_high, and HA_low values for the second through the last periods are conditionally dependent on prior values.
- The first part populates a temp table (#for_temp_HA_candlesticks) with an into clause in its select statement within the code for the first part.
- The code for the second part computes HA_open, HA_high, and HA_low values
within a while loop.
- The while loop starts with the second period and runs through the last period.
- Three update statements within the while loop transform the null values for HA_open, HA_high, and HA_low values from the first part into computed values based on their expressions.
- These update statements operate sequentially for each period from the second period through the last period.
Here is the T-SQL code for the first part.
- The code starts with a declare statement for local variables used by the scripts for the first part and the second part.
- Next, a drop table if exists statement removes any prior version of the of the #for_temp_HA_candlesticks temp table.
- The following select statement draws its source data from the open, high, low, close values in the yahoo_finance_ohlcv_values_with_symbol table as well as the HA values computed in the first part; a where clause in the select statement designates the date range and ticker value for which to compute HA values.
- The script for the first part ends with a second select statement that can display the values in the #for_temp_HA_candlesticks table at the end of the first part. This select statement is not necessary for production applications of the code, but it is helpful for unit testing during development and tutorial purposes in this tip.
-- compute HA candlesticks for first row values
-- and for all HA_close column values
-- run with the DataScience default database or
-- wherever else your financial time series observations are stored
declare
 @HA_open money,@HA_open_prior money,@HA_close_prior money
,@high money,@low money
,@current_row int = 2
,@max_current_row int = (
  select count(*)
  from dbo.yahoo_finance_ohlcv_values_with_symbol
  where symbol = 'QQQ'
  )

drop table if exists #for_temp_HA_candlesticks

-- compute first row values for HA_open, HA_high, and HA_low
-- and compute HA_close for all rows
select
 row_number() over (order by date) r_number
,symbol
,date
,[open]
,high
,low
,[close]
,case
  when row_number() over (order by date) = 1 then
   [open]
   -- Stockcharts.com wrote the following expression
   --([open] + [close])/2
   -- but it coded [open]
   -- this tip uses [open]
 end HA_open
,case
  when row_number() over (order by date) = 1 then
   high
 end HA_high
,case
  when row_number() over (order by date) = 1 then
   low
 end HA_low
,case
  when row_number() over (order by date) = 1
   then ([open] + high + low + [close])/4
  when row_number() over (order by date) > 1
   then ([open] + high + low + [close])/4
 end HA_close

into #for_temp_HA_candlesticks
from
dbo.yahoo_finance_ohlcv_values_with_symbol
where symbol = 'QQQ'
and date >= '2011-08-01' and date <= '2011-08-31'

-- optionally display first row of HA_open, HA_high, and HA_low values
-- and all rows or HA_close values
-- along with all rows of original time series values (open, high, low, close)
select * from #for_temp_HA_candlesticks
Here is the T-SQL code for the second part.
- A comment line of dashes separates the code for the second part from the preceding code of the first part.
- The while loop increments the value of the @current_row local variable by one at the end of each pass through the loop. The value of the @current_row local variable is initialized to 2 in the code for the first part.
- The value of the @max_current_row local variable sets the limit for the passes through the loop. The value of the @max_current_row local variable is set in the first part code to the count of the number of rows in the yahoo_finance_ohlcv_values_with_symbol table for the ticker symbol that is being processed.
- Within the while loop there are three update statements for computing values for HA_open, HA_high, and HA_low column values on successive rows in the #for_temp_HA_candlesticks table.
- The select statement at the end of the following script displays the observed prices along with the computed HA values for each period in an analysis.
--------------------------------------------------------------------------------------

-- compute HA_open, HA_high, and HA_low column values
-- for all rows after the first row
While @current_row <= @max_current_row
begin
-- get prior @HA_open and prior @HA_close to current row
   set @HA_open_prior =  (select HA_open  from #for_temp_HA_candlesticks where r_number = (@current_row - 1))
   set @HA_close_prior = (select HA_close from #for_temp_HA_candlesticks where r_number = (@current_row - 1))

-- computed HA_open as average of prior @HA_open and prior @HA_close to current row
   set @HA_open = (@HA_open_prior + @HA_close_prior)/2

--update HA_open column value in #for_temp_HA_candlesticks for current row
   update #for_temp_HA_candlesticks
    set HA_open = @HA_open
   where r_number = @current_row

-- store high and low for current row, respectively,
-- in @HA_high and @HA_low
   set @high = (select high from #for_temp_HA_candlesticks where r_number = @current_row)
   set @low = (select low from #for_temp_HA_candlesticks where r_number = @current_row)

-- compute HA_high as maximum of current period's high and
-- current period values for HA_open and HA_close
-- else clause in case statement handles special case of
-- high = HA_open = HA_close
   update #for_temp_HA_candlesticks
    set HA_high =
               case
               when @high > HA_open and @high > HA_close then @high
               when HA_open > @high and HA_open > HA_close then HA_open
               else HA_close
               end
   where r_number = @current_row

-- compute HA_low as minimum of current period's low and
-- current period values for HA_open and HA_close
-- else clause in case statement handles special case of
-- low = HA_open = HA_close
   update #for_temp_HA_candlesticks
    set HA_low =
               case
               when @low < HA_open and @low < HA_close then @low
               when HA_open < @low and HA_open < HA_close then HA_open
               else HA_close
               end
   where r_number = @current_row

-- increase @current_row by 1 to update column values in next row
set @current_row = @current_row + 1
end

-- test display
select * from #for_temp_HA_candlesticks
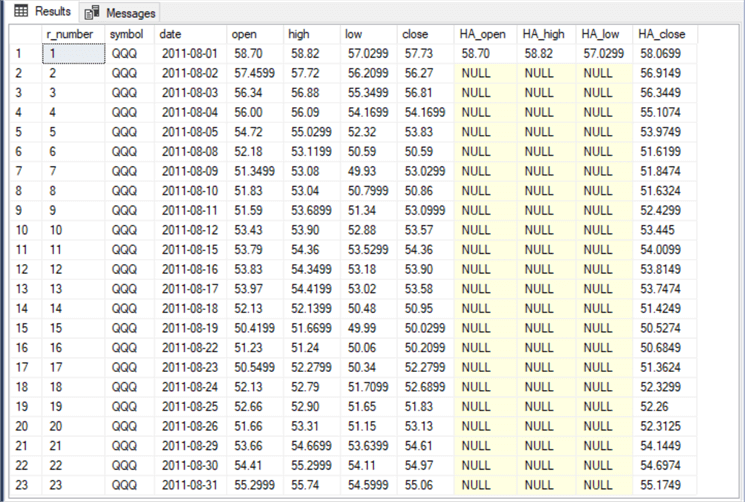
Here is the results set displayed by the optional select statement at the end of the first part.
- Perhaps the most important point to note is that HA_open, HA_high, and HA_low column values are NULL for all rows except the first one. The NULL values are computed in the second part.
- It may also be worth observing that there are just 23 trading days in August 2011. This is because there is no trading on weekend days.
- The r_number column is populated with a row_number() window function that keeps track of the order of the dates in the #for_temp_HA_candlesticks temp table.
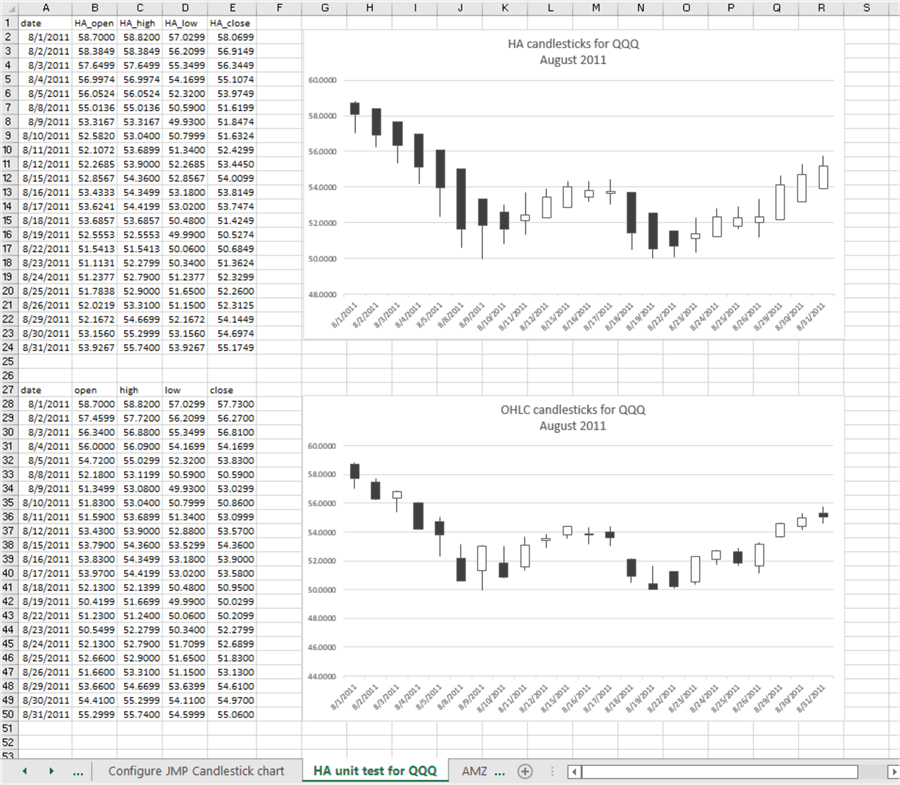
The following screen shot shows the results set from the select statement at the end of the script for the second part. You can use this results set to position two candlestick charts in a single Excel worksheet tab – one chart for the observed open, high, low, close values, and a second chart for the computed HA_open, HA_high, HA_low, and HA_close values.
The next screen shot shows an Excel worksheet with two candlestick charts.
- The top chart shows the computed HA values in a candlestick chart.
- The bottom chart shows the observed open, high, low, close prices for the same set of underlying data.
- Please note that values displayed by the two charts are not identical. In particular, the chart with HA values shows different values than the observed open, high, low close prices.
- The charts in the image below display down bars with a black fill and up bars with a hollow fill.
Data visualization Comparisons of HA candlesticks to open, high, low, close observed price candlesticks
The Japanese phrase Heikin Ashi translates to average pace in English. This average pace feature makes it ideal for discovering adjacent periods with an uptrend. Candlestick charts of observed open, high, low, and close prices do not typically reveal average price momentum from one period to the next nearly as well as Heikin Ashi charts.
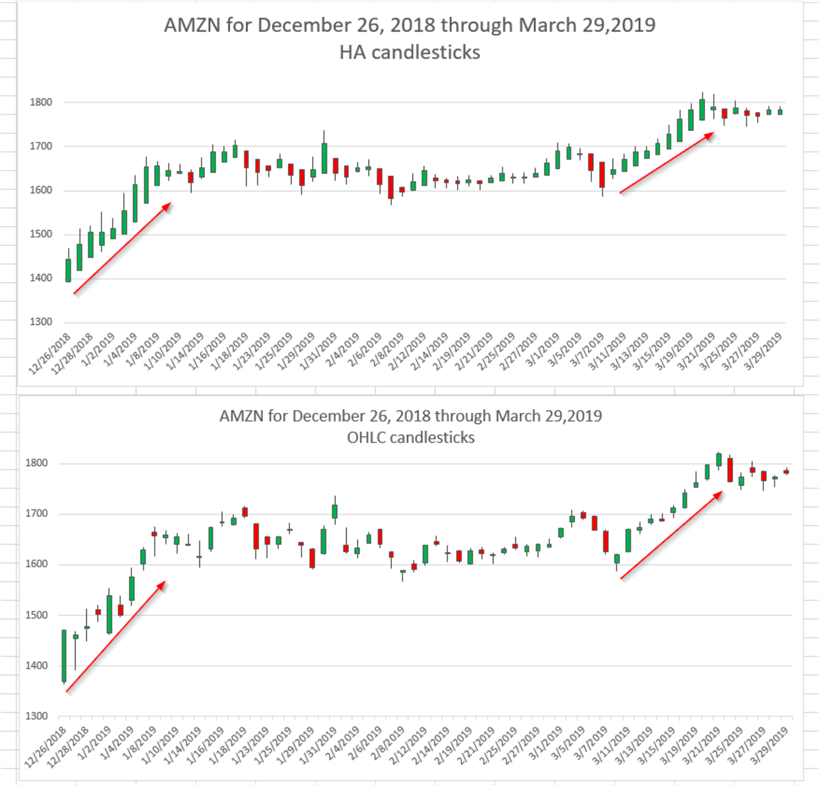
The following pair of chart images show HA candlesticks in the top chart over a candlestick chart for open, high, low, close observed prices (OHLC) for the AMZN ticker.
- The first ten candlesticks in the HA chart are all green. This confirms an uptrend across the first ten candlesticks.
- The first ten candlesticks for the observed prices show more volatility than the Heikin Ashi candlesticks. For example, the fourth, sixth, and tenth candlesticks are red, indicating that prices fell from the open to the close on these trading days.
- Therefore, some traders (professionals and amateurs) who may not have had an opportunity to review the HA chart may be inclined to pass on opening a position for the AMZN ticker during the first ten periods. This would cause them to bypass a profit-making opportunity.
- The same situation applies to another set of ten candlesticks towards the end of the periods in both charts. While there is just one red candlestick in this set for the observed prices, the upward trend is still noticeably less strong in appearance than the HA candlesticks.
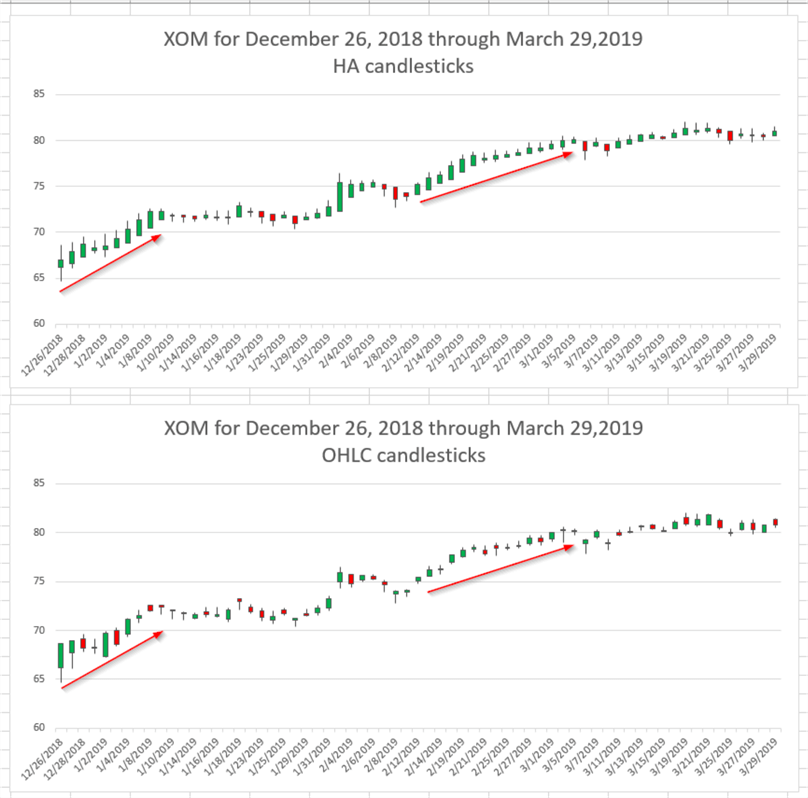
Here is another pair of candlestick charts for Heikin Ashi values over observed open, high, low, close prices for the XOM ticker. This ticker is for the Exxon Mobil Corporation.
- In this case, the first nine HA candlesticks in the top chart clearly point to uptrending prices. All these candlesticks have green bodies, and they typically rise from one period to the next. Uptrending prices denote a profitable time to buy a security before downtrending prices signal that it is time to sell a security.
- The first nine open, high, low, close observed candlesticks in the bottom chart have three red candlestick bodies. This may be enough to cause some traders to pass on a viable trading opportunity.
- The same kind of relation between HA charts and observed prices charts pertains
to another set of 15 candlesticks that start around the middle of the following
two charts.
- The red arrow identifies a set of 15 HA candlesticks that all have green bodies.
- The corresponding candlesticks in the bottom chart for observed prices are not all green.
It is difficult to arrive at any firm conclusions about HA charts versus open, high, low, close observed price charts from just two pair of charts. However, being able to visualize the difference between the two charts can be an important first step about whether it is worthwhile pursuing a more analytical comparison of the two types of candlesticks across many different tickers for one or more sets of periods.
For those who would like to view results for another ticker, a third pair of charts are available in this tip's download for the JPM ticker (JPMorgan Chase & Co.). This additional pair reinforces the findings from the two preceding pairs of charts.
Next Steps
This tip describes the main steps for preparing candlestick charts with SQL Server and Excel for open, high, low, close observed prices and Heikin Ashi values. By computing the Heikin Ashi values in SQL Server, you have greater access to the values than with those from a charting package at Yahoo Finance or Stooq.com. For example, this tip included coverage of the differences between Heikin Ashi values and open, high, low, close observed prices.
The download for this tip aims to give you the opportunity for a first-hand feel about how the code and screen shots were developed for this tip.
- There is one sql script file.
- It contains all the code for results displayed in SQL Server and Excel.
- There are six scripts in the script file. Each script is in comment markers. A comment at the top of each script identifies the tip section to which it belongs.
- There is a csv file with open, high, low, close, and volume data for the source data for all candlestick charts displayed in this tip. The volume data is not explicitly used in this tip, but it is included in the download because the volume column exists in the source data.
- There are two Excel workbook files with source data and charts for candlestick charts displayed in this tip.
- There are three png files with images for those displayed and referenced in the "Data visualization Comparisons of HA candlesticks to open, high, low, close observed price candlesticks" section.
A good first next step would be to confirm you can get the code and charts working for all examples in this tip. Then, another next step would be to accommodate other ticker symbols and date ranges.


About the author
 Rick Dobson is an author and an individual trader. He is also a SQL Server professional with decades of T-SQL experience that includes authoring books, running a national seminar practice, working for businesses on finance and healthcare development projects, and serving as a regular contributor to MSSQLTips.com. He has been growing his Python skills for more than the past half decade -- especially for data visualization and ETL tasks with JSON and CSV files. His most recent professional passions include financial time series data and analyses, AI models, and statistics. He believes the proper application of these skills can help traders and investors to make more profitable decisions.
This author pledges the content of this article is based on professional experience and not AI generated.
View all my tips
Article Last Updated: 2022-04-29
