By: Harris Amjad | Updated: 2023-09-27 | Comments (3) | Related: > Power BI
Problem
Microsoft Power BI Desktop offers a variety of ways to help shape data. One of these options is the ability to split columns. One would need a splitting column option to organize data or extract certain information from columns, which can later be used for several purposes. This article will go through this process in detail.
Solution
In this age of big data and artificial intelligence, data has occupied a paramount position in an organizational decision-making process. The journey of information and data flow from a database that logs a specific activity to a business utilizing the insights derived from the data for enhanced operational efficiency is quite complex. In this process of acquiring information and subjecting it to data analysis, a significant chunk of time is spent in data manipulation – the process whereby we are making our data more organized and freer of errors before we can derive meaningful insights from it, whether our algorithm is a simplistic SQL query or a more complex deep neural network. One such technique of data manipulation and organization that we will explore today is splitting columns.
So, what exactly is splitting columns? As evident from the name, splitting columns refers to dividing a single column into multiple columns based on a specific criterion. As an example, consider the illustration below. We can assume that the black column to the left contains customer names, and you want to split this column to have separate first, middle, and last names. Thus, this column is split into the three columns to the right containing the first, middle, and last names.

So why do we split columns? Although the above example highlights one use case, there are several reasons why data engineers might resort to the column split technique.
- Readability: Splitting your column into smaller chunks makes your columns more readable. Organizing and presenting your information in a more structured and focused manner makes it easier to scan through rows to locate specific information. Although one does not manually scan all the database, it is a good practice to scan some rows as a part of your EDA process.
- Analysis: Sometimes, one needs a specific portion of the information stored in a column, which is later used for analysis, reporting, and decision-making. For instance, consider a database that logs every purchase made with the corresponding timestamp. Later, if we want to map the business's annual sales, we can split the timestamp column into date and time columns and then use the data column as a part of our analysis.
- Reducing Duplication: Splitting columns can help reduce duplication in data by promoting data normalization. When columns are split, related data is stored in separate columns, allowing for normalization. This means that instead of duplicating the same data in multiple rows, you store it once and reference it through relationships.
- Separating Data Types: It is also possible that the information stored in your column contains a combination of digits and text. For example, if a customer information column stores data in the form of the customer's country code, followed by a unique identifier, we can split the column to separately store the integer and string data.
- Data Cleaning: Data may contain inconsistencies, errors, or exhibit some other undesirable behavior. Splitting the column can help clean and standardize the data.
- Text Processing: When working with textual databases, splitting the sentences into phrases and then into individual words is helpful for further analysis.
Now that we understand the rationale behind splitting columns let's take a look at some of the different methods we can use to split columns:
- Delimiter: This is one of the most common methods of column splitting whereby you specify a delimiter character like space, hyphen, comma, etc. The delimiter character will split the original column into separate tokens and then store in different columns.
- Fixed width: Provided that your data is stored in a consistent format, we can also extract certain characters from the column, provided that the data we need has the same width throughout the column.
- Positions: Sometimes, we want to extract multiple portions of data from a column that cannot be done using the delimiter method as the data might not be stored consistently. In this case, we can specify multiple positions by the relevant character index where we want the splitting to occur.
- Letter case: We may want to separate data in a column at the boundary where the text transitions from lower to upper case or vice versa.
- Data Type: Similarly, like above, we may also need to split a column that stores integer and non-integer data together in each row of the column.
The method chosen largely depends on the data's structure, the tools or programming languages used, and the level of complexity you're comfortable with.
Creating a Schema in SQL Server
Now that we understand splitting columns in data manipulation, it is time for a practical demonstration to get more familiar with this concept. Before we demonstrate the process of column splitting using the Power Query Editor in Power BI, we need sample data. For that, we will be using SQL Server.
To get started, we will first create our database and then access it using the following commands:
--MSSQLTips.com
CREATE DATABASE split;
USE split;
Now, we can create a table and populate it using the following queries:
--MSSQLTips.com
CREATE TABLE random_sales_data
(
record DATETIME,
customerID varchar(255),
sales INT, address varchar(255)
 );
--MSSQLTips.com
INSERT INTO random_sales_data VALUES
('2022-07-03 14:25:07', 'US-0023', 350, '98765losangelesCA'),
('2022-07-08 06:11:59', 'UK-2847', 1200, '374leedsENG'),
('2022-07-12 22:04:36', 'US-1203', 600, '45678chicagoIL'),
('2022-07-19 11:17:58', 'UK-9402', 700, '758aberdeenSCT'),
('2022-07-01 03:45:14', 'CN-5632', 200, '23calgaryAB'),
('2022-07-09 16:55:29', 'US-8294', 500, '54321miamiFL'),
('2022-07-26 07:30:40', 'CN-1928', 7500, '35torontoON'),
('2022-07-21 19:08:53', 'US-1930', 8500, '87654seattleWA'),
('2022-07-15 12:49:02', 'UK-7483', 500, '923hullENG'),
('2022-07-06 08:33:19', 'CN-0938', 950, '83halifaxNS'),
('2022-07-31 23:14:45', 'US-9284', 300, '34567bostonMA'),
('2022-07-28 15:02:10', 'UK-0192', 750, '049cardiffWLS'),
('2022-07-11 05:27:34', 'UK-4343', 650, '934londonENG');
We can now view our table using the SELECT statement as shown:
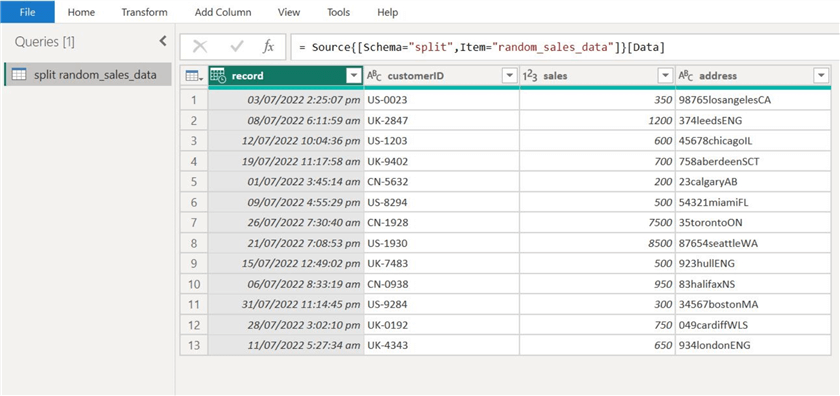
--MSSQLTips.com
SELECT * FROM split.dbo.random_sales_data;
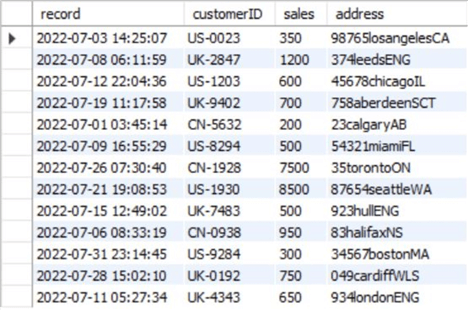
We can assume that the sample data above represents data logged for every purchase made by a specific customer for the month of July. For every customer, there is the exact timestamp for when the purchase was made, a unique customer ID, the total sales amount, and the customer's address.
Splitting Columns Using Power BI
Now that we have a sample dataset, we will see how the splitting columns option in the Power Query Editor of Power BI helps make our data more structured and organized. Let's go through the following steps:
Step 1 – Import the Dataset
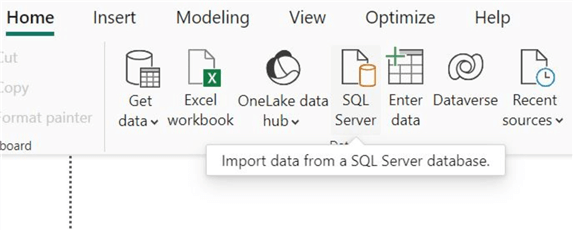
We first need to import the dataset we created to Power BI before splitting columns. To do so, in the "Home" ribbon, click on the "SQL Server" option in the "Data" section as shown below.
Power BI also offers a range of other sources from which we can import our data. However, since our current schema was constructed using a SQL Server database, we will not explore it further.
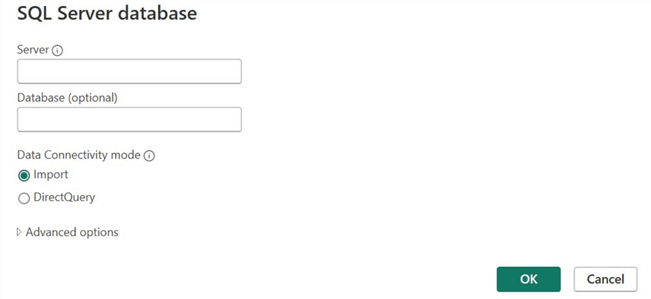
Afterward, the "SQL Server database" window will open. Enter the relevant server credentials and your database name, then click "OK" at the bottom, as shown below.
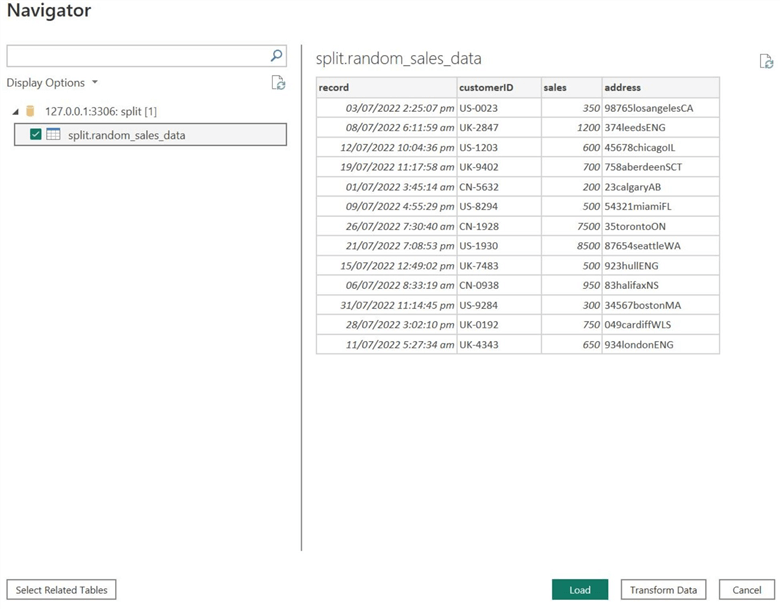
If Power BI has successfully established a connection with your database, the "Navigator" window, as shown below, will pop up. Select your table below the "Display Options" and click "Transform Data."
Power BI also gives the option to review our table at this stage. This helps select the correct table and spot any anomalies.
At this point, we have successfully imported our data from the SQL Server. Since we chose the "Transform Data" option in the previous step, the Power Query Editor will now open, as shown below.
We will now explore some different splitting methods in Power Query Editor.
Step 2 –Splitting by Delimiter
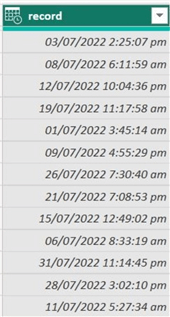
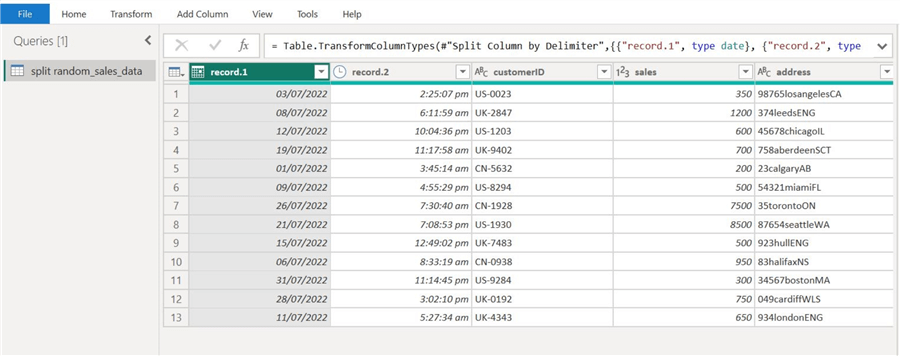
So, our first column that needs to be altered is the "record" column, as shown below. It records an exact timestamp for every purchase made by a customer. However, suppose that we need to analyze the sales trend over time. In this scenario, the time part of our timestamp is not required as the time scale is too small. Usually, sales trends are computed on an annual or monthly scale.
Therefore, our objective is to split the record column to separate the date and time components.
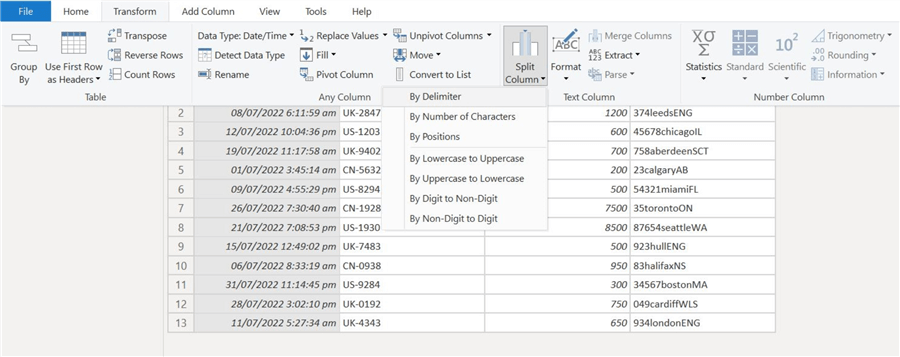
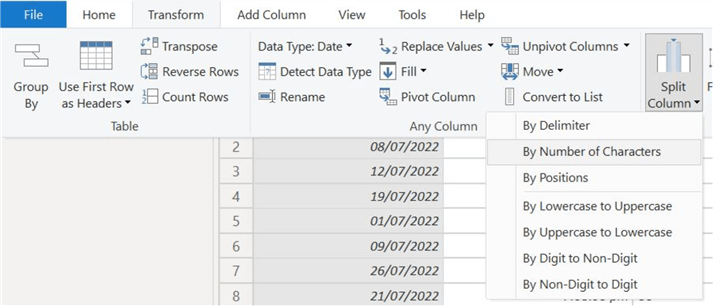
To start, select the "Split Column" option in the "Transform" ribbon. This will show a drop-down list of different methods to split a column. Inspecting our "record" column again, we see that whitespace separates the date and time. Therefore, the most appropriate method here will be to select the "By Delimiter" option as shown.
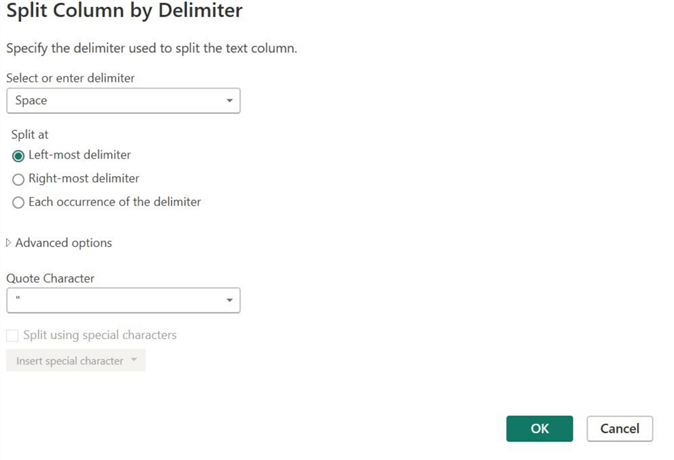
The "Split Column by Delimiter" window will open. As shown below, we select our delimiter to be "Space," and we only want the split to occur at the left-most position of that character. Then, click "OK" at the bottom of the window.
As shown below, our "record" column is neatly split into separate date and time columns.
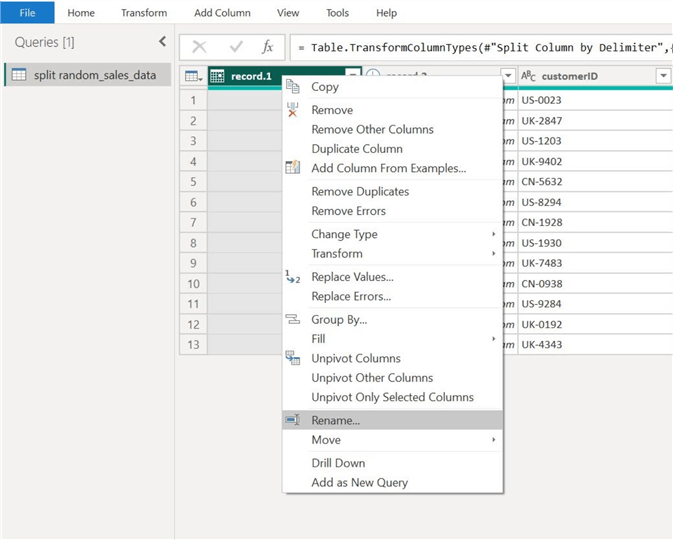
For readability purposes, we will be renaming these two columns. To do so, right-click the column name and select the "Rename…" option, as shown below.
Step 3 –Splitting by Number of Characters
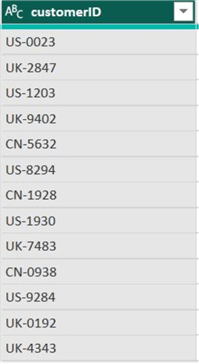
Now, we need to pay attention to our "customerID" column. We can inspect that the ID comprises the customer's country code and ID digits. Although the ID digits are not very helpful on their own, the country codes can help determine the regional sales trends. Therefore, our objective is to separate the country code from the "customerID" column.
To do so, again select the "Split Column" option and select the "By Number of Characters" from the resulting list. We chose this method because our country codes are all conveniently the same length across the "customerID" column.
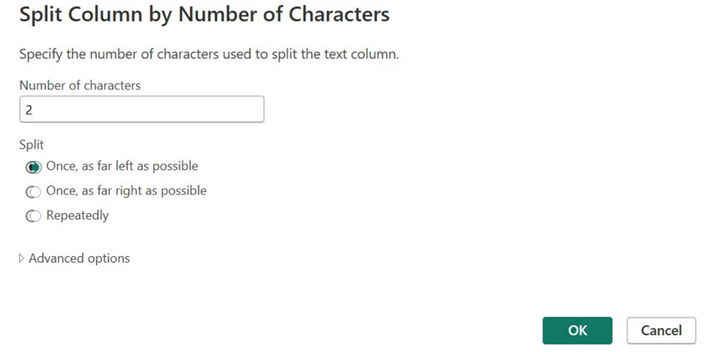
The following window below will open. Set the number of characters to 2 and the split position to far left. Then click "OK" at the bottom.
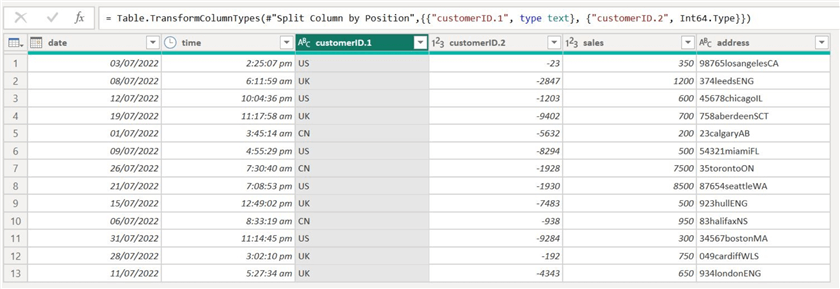
We can see the result of our splits below. We can rename our country codes column and delete the digit ID column, which is irrelevant to our analysis later.
Step 4 –Splitting by Data Type and Letter Case
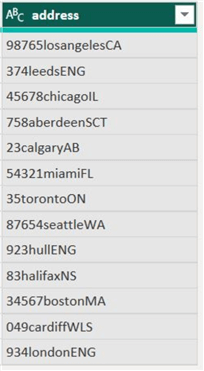
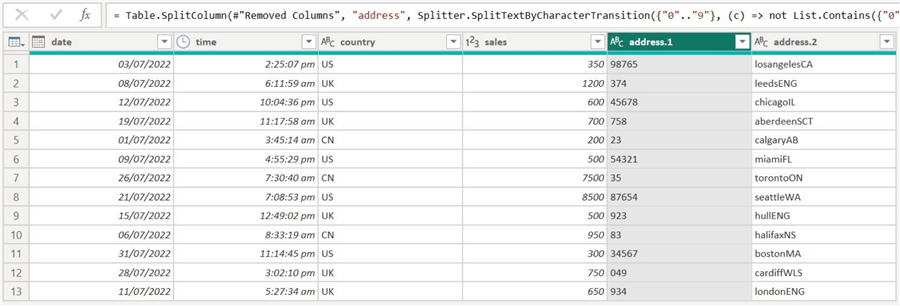
We can now move on to the "address" column. On inspection, it contains a variable-sized postal code, a full city name, and the state code in upper case. Our objective now is to separate these three address components.
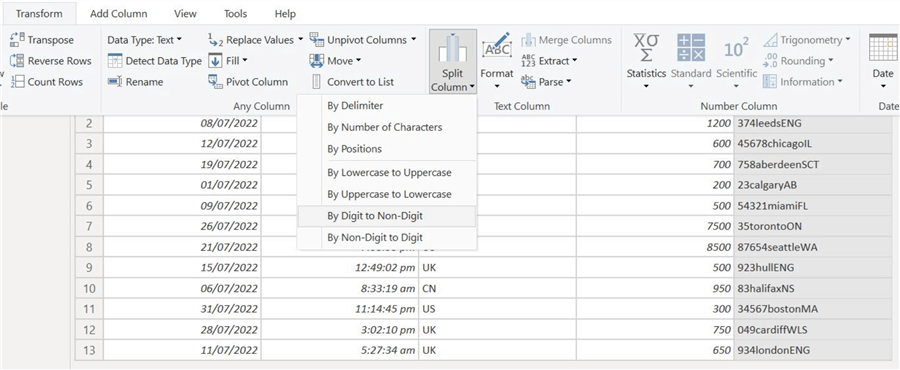
Breaking down our problem into different steps, we will first separate the postal code from the rest of the address. Since we are separating digits from a non-digit portion of the column, we can choose the "By Digit to Non-digit" option, as shown below. We are not selecting a similar option called "By Non-Digit to Digit," as the digit comes first in our column.
We can visualize the results below.
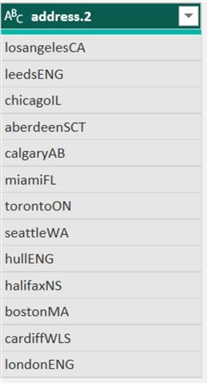
Next, we can focus on separating the city name from the state code in the column below.
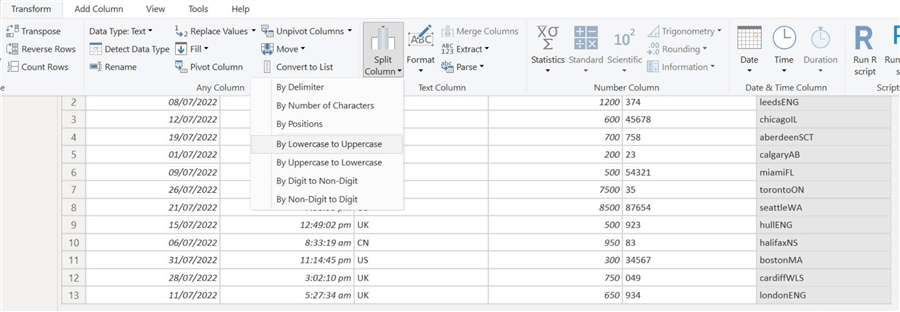
When we select the "Split Column" option, we will now select the "By Lowercase to Uppercase" option since our city name is lowercase, whereas the state code is uppercase.
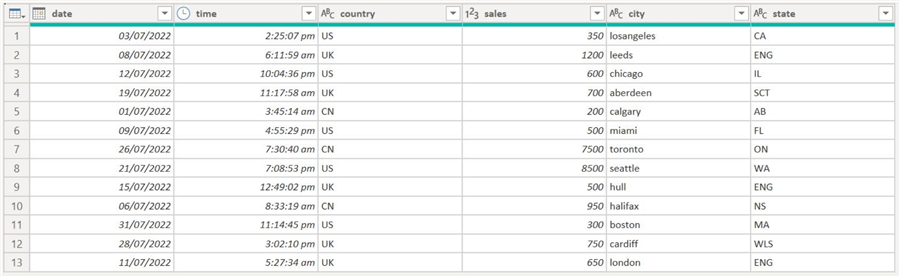
After splitting the various columns, we can view a more structured, readable, and organized version of our dataset.
Step 5 - Finish
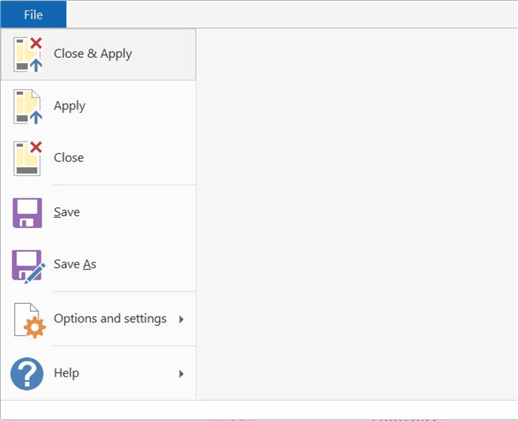
We can now exit the Power Query Editor. Click the "File" button and select "Close & Apply," as shown below.
Analysis
Now that we have successfully demonstrated the power of splitting column options in Power Query Editor, it is time to see how our new dataset could be useful.
As shown below, we have plotted a sales trend over the month of July. It is important to reflect on our original dataset at this point, as without splitting the "record" column, it would not have been possible to plot data in terms of date.
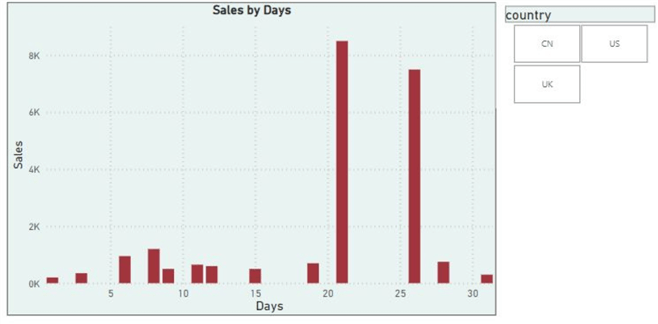
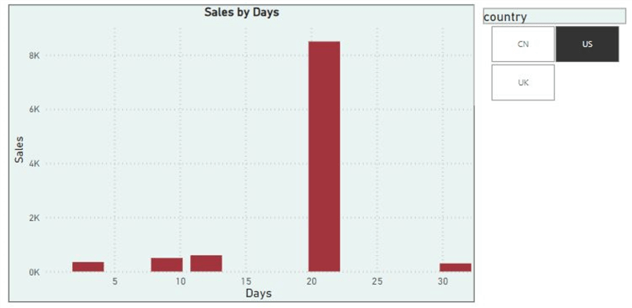
We have also set up a simple slicer to visualize the total sales per country. Again, this feat wouldn't have been possible if we didn't split the "customerID" column to acquire the country code.
Next Steps
- While the steps we covered were simplistic and straightforward, several other advanced techniques involve using custom delimiters or creating custom functions to split columns.
- Another advanced technique is Regular Expressions (RegEx), which can be used to define far more complex splitting patterns. Conditional splitting is another technique that splits columns based on a particular criterion. It's a powerful technique used to reshape and restructure data to make it more suitable for further analysis or processing.
- Explore other formatting tips in Power BI
Learn more about Power BI in this 3 hour training course.


About the author
 Harris Amjad is a BI Artist, developing complete data-driven operating systems from ETL to Data Visualization.
This author pledges the content of this article is based on professional experience and not AI generated.
View all my tips
Article Last Updated: 2023-09-27
