By: K. Brian Kelley | Updated: 2023-12-19 | Comments | Related: > Performance Tuning
Problem
We are experiencing performance issues in our Microsoft SQL Server farm. However, because we can't predict when they will happen, we are struggling to determine the root cause of the issues. Also, we often find out about performance issues because customers are contacting support. We need alerts to fire as issues happen so we can respond quickly. Is there a product that can help?
Solution
SolarWinds' SQL Sentry was designed to monitor SQL Servers, collect Key Performance Indicators (KPIs) regularly, highlight poorly performing queries and other performance-related issues, and fire alerts as defined to notify DBA teams in a timely manner.
If you've heard of SQL Sentry in the past, you're probably aware that the main interface is a fat client installed on a Windows system. That's still a key part of the product. You can use the desktop client for analysis and problem investigation like in the past, and it is still how you configure what SQL Servers to monitor, what conditions to alert on, what actions to take, and the rest of the administrative functionality. However, if you need "eyes on the problem" fast, now SQL Sentry has a useful web-based portal available to help diagnose issues, which will be demonstrated throughout this article.
Health Information at a Glance
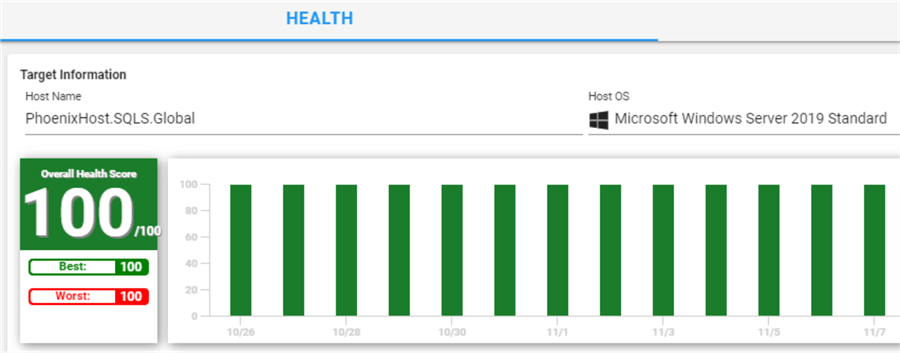
Let's start with typical monitoring. SQL Sentry actively collects and aggregates performance data so that DBAs can see the health of a particular SQL Server over time. For instance, this is a healthy host:
And this is a host that has experienced its share of issues:
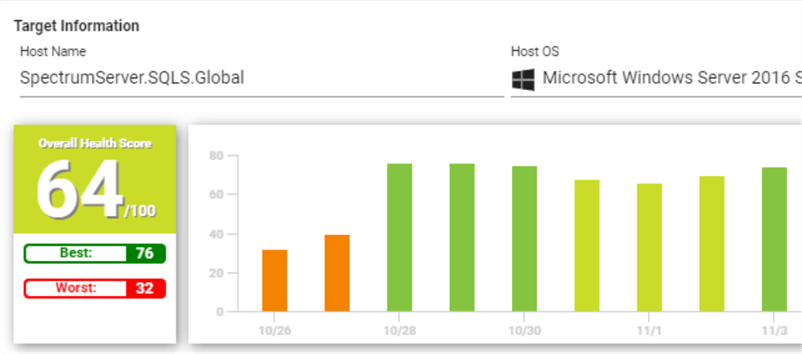
This quick summary view gives enough information to know that the first SQL Server doesn't need much attention, but the second one does.
Root Cause Analysis
It's great that SQL Sentry provides the summary information at the server level, but what about the farm level? In fact, that's the starting point here with the environment I am demoing receiving a score of 63 out of 100:
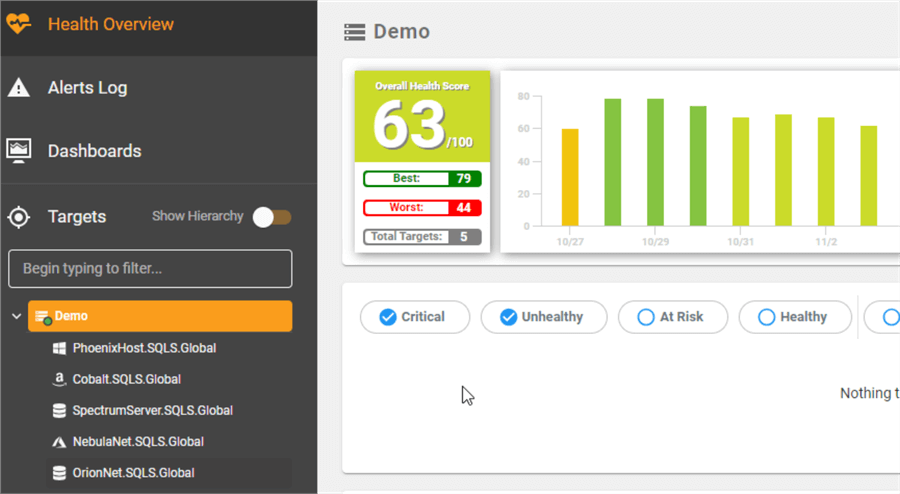
Just as it aggregates KPIs at the server level to give an overall view of health, it does so for the farm, too. This is why, even though the poorly performing SQL Server above had a worst health score of 32, the farm aggregated worst is higher at 44. It's not the worst value among all the SQL Servers, but the farm health overall, including the SQL Servers, is performing well. Suppose you have a series of SQL Servers all servicing a particular function. This summary information at a group level gives a DBA the ability to speak to the overall health of the SQL Server install base for that function. It could also provide an overall performance view based on how we want to group SQL Servers, such as by location, business function, SQL Server version, etc. When management says, "Give me a number," SQL Sentry provides one.
Getting to the Root Cause
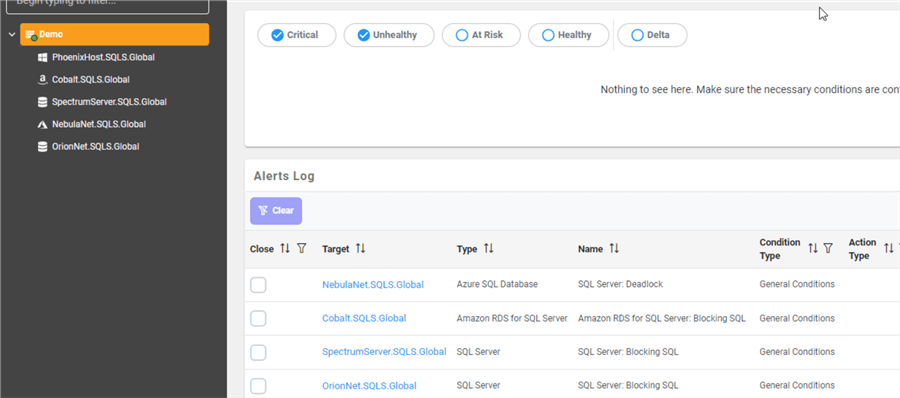
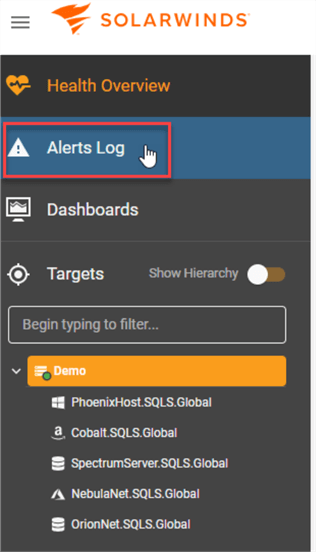
On that same Health Overview page, there is the Alerts Log functionality. I can navigate through said alerts from that screen:
However, I am looking for a specific time period several days in the past. I want to filter the alerts to show only what happened on November 17, a low day for my farm. I can specify a date range if I go to the Alerts Log page:
The time range is shown in the upper right corner of the Alerts page. This can be modified to a different interval like so:
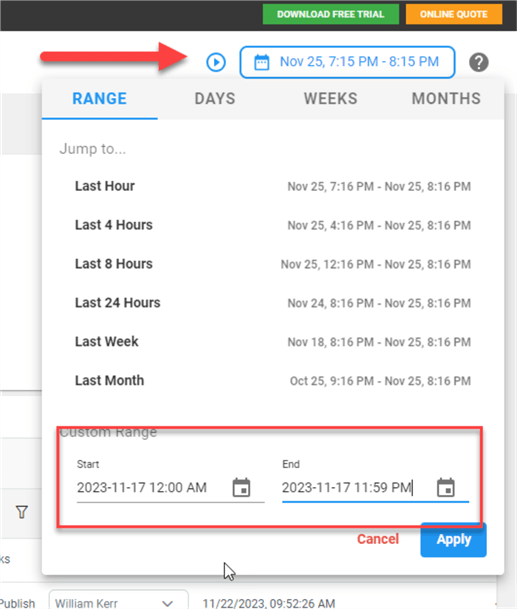
SQL Sentry's portal now displays the alerts within the specified time range.
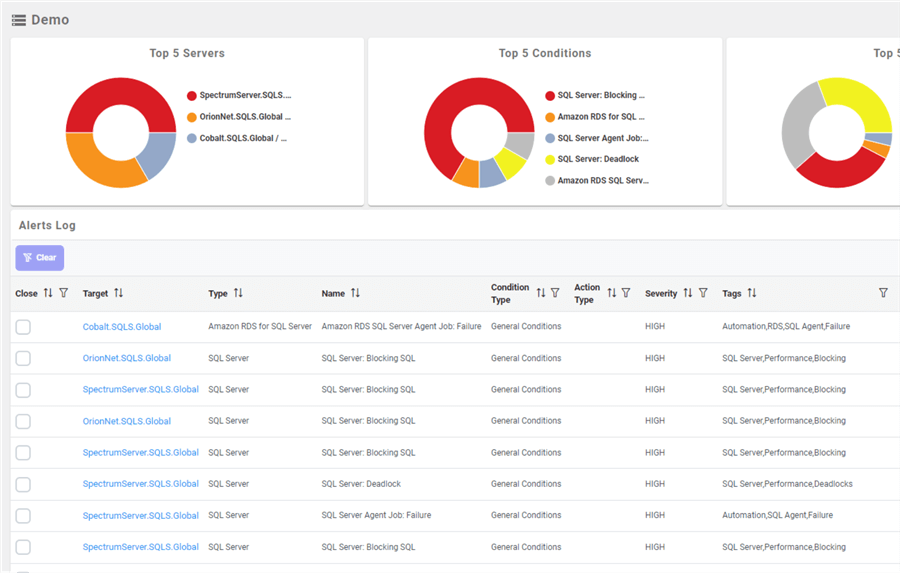
Note: More than just the events are displayed. Summary graphs along the top indicate the Top 5 Servers, Conditions, and Tags. In the screenshot above, SpectrumServer is the worst based on the graph. Looking at the events, there are several SQL Server: Blocking SQL events. Clicking on one, a menu pops up, as shown below. The options here correspond to the "tabs" for that server.
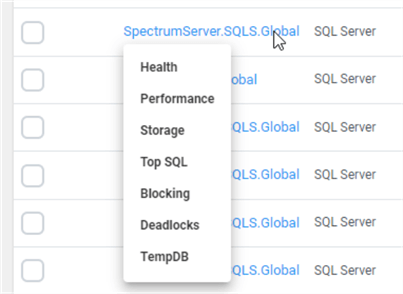
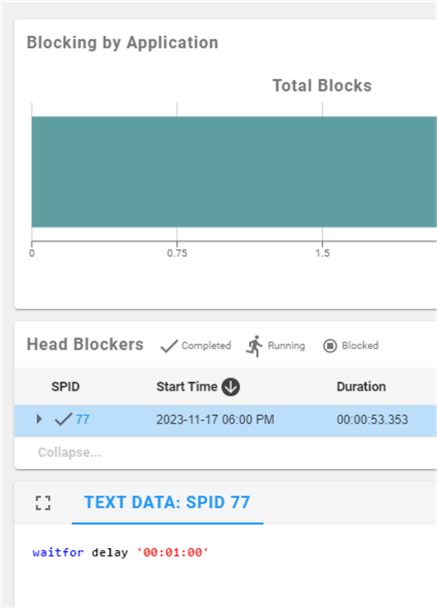
Choosing the Blocking option, the Portal takes us to the Blocking tab for SpectrumServer. Since this is a demo, the blocking is forced using waitfor. However, if there were serious blocking issues with a production SQL Server, SQL Sentry tells us a lot of helpful information: the # of blocks, which SPIDs are the worst at blocking, and exactly what a highlighted SPID is doing that is causing the blocking situation. If the SQL Server is experiencing blocking issues, SQL Sentry provides all the information to diagnose what's happening and how bad it is.
The Alert Log also indicated a deadlock situation during the time interval. Clicking on the Deadlocks tab, again, a DBA can access the information they need to diagnose how a deadlock happened, what processes were involved, and why.
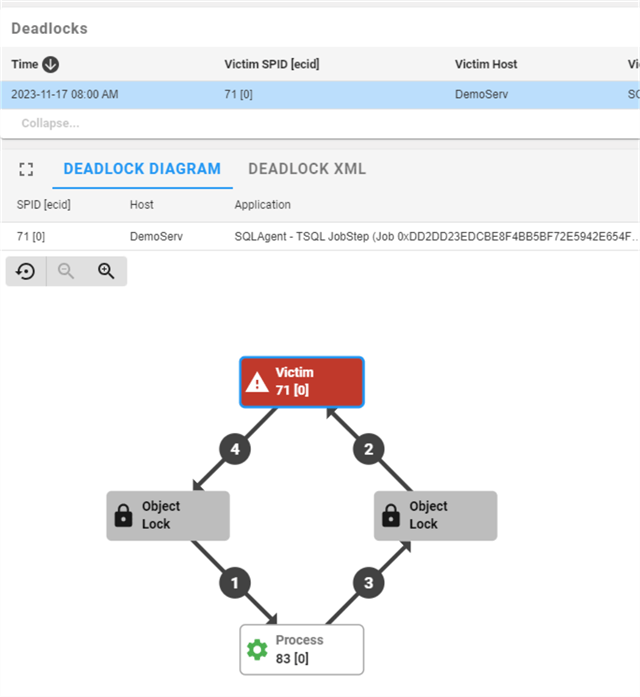
This is the left half of the page. Two SPIDs were involved, 71 and 83, with 71 chosen as the victim. Since SPID 71 is highlighted, there is enough detail about the application, the time, and the host to understand what was impacted. The details of the deadlock itself are shown on the right side of the page.
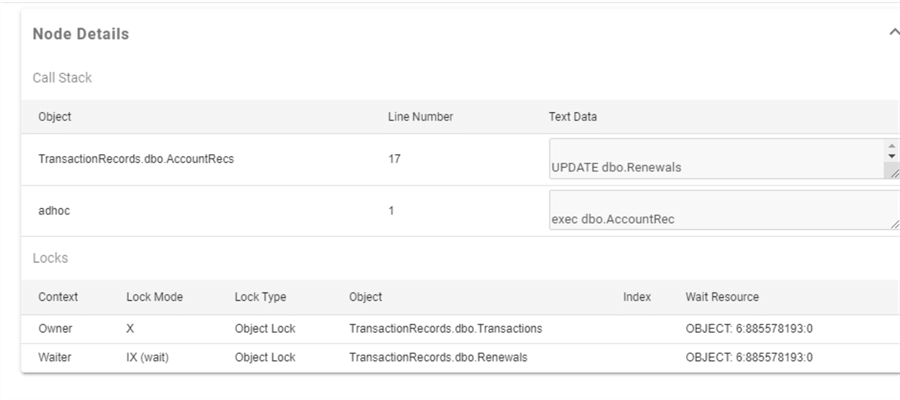
The two tables involved in the deadlock are Renewals and Transactions. SPID 71 had a lock on Transactions and was waiting on Renewals. SPID 83 (not shown) had a lock on Renewals and was waiting on Transactions. That's the definition of a deadlock. Note: The call stack, which resulted in the deadlock, is displayed. Here, we see that SPID 71 was calling a stored procedure, AccountRec. AccountRec had an update of Renewals within it. Again, there is more than enough information to diagnose the problem.
Performance Monitoring
SQL Sentry excels at performance monitoring and provides excellent graphs and counters of performance data, whether viewing history or data in near real-time. Here's a view of the performance dashboard for SpectrumServer for November 17:
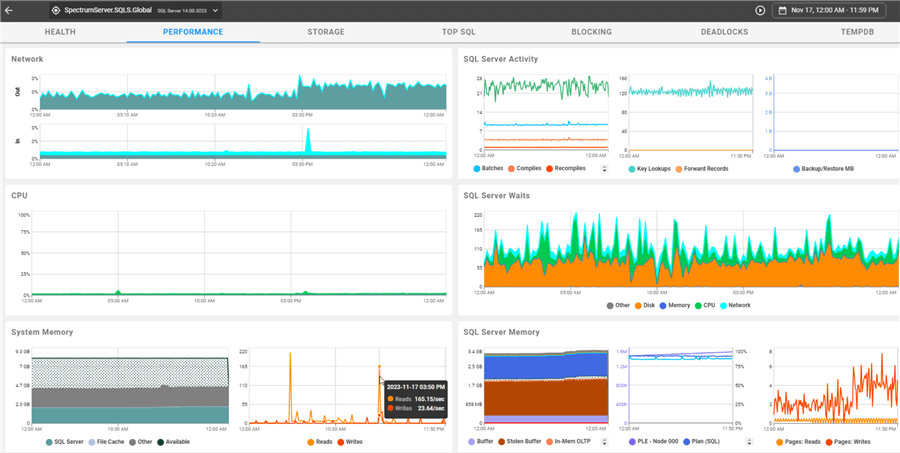
Note: Additional information is provided upon mouse-over. I've pointed my mouse at one of the spikes in system memory, and not only does Sentry One provide the graph, but it also displays the numbers.
On Windows-based systems, the OS and hardware-related data are on the left, while the SQL Server values are on the right. If you're already familiar with the fat client, the portal mirrors the same display.
What Is Supported
Of course, graphs and counters are great so long as the product is supported. What does SQL Sentry support? SQL Sentry supports:
- SQL Server (database engine) instances running on a full Windows or Linux OS (physical or virtualized, on-premises or cloud-deployed).
- SQL Server (database engine) instances running in a Linux container
- SQL Server Analysis Services instances running on an OS
- Azure SQL Database
- Azure Synapse SQL Pools (formerly Azure SQL Data Warehouse)
- Amazon Web Services (AWS) RDS for SQL Server
What Is Monitored
Digging deeper, SQL Sentry monitors (as applicable for the type of resource):
- Key OS and SQL Server performance counters
- Disk activity, capacity, and usage
- Index fragmentation and usage
- AlwaysOn (Availability Groups) health-related items
- Top SQL usage and query plans
- Blocking behavior
- Deadlocks
Beyond Physical Servers
SQL Sentry supports virtualization and getting the appropriate counters from the hypervisor. Both Hyper-V and VMware ESX Server are supported. In the case of VMware, this information is gathered via a connection to vCenter. Getting information from the hypervisor is important because what the virtual machine (VM) thinks has been allocated may not be physically allocated. For instance, if VMs are oversubscribed, "physical" memory, as far as the VM is concerned, may only be partially backed by physical memory and the rest by disk.
On the cloud side, VMs deployed can be monitored like on-premises servers. Therefore, it doesn't matter what cloud provider SQL Servers installed in this way are running on. They can be monitored as expected. Of course, the list beyond SQL Servers installed on VMs includes additional Azure and AWS offerings.
AlwaysOn Monitoring
If a database is configured for AlwaysOn, having the replication fail between the primary and one or more of the second nodes is a critical situation. Therefore, staying on top of the status of these setups is equally essential. SQL Sentry provides an excellent visual interface for quickly determining the health status of AlwaysOn configurations. Here's the overview portion of the AlwaysOn tab:
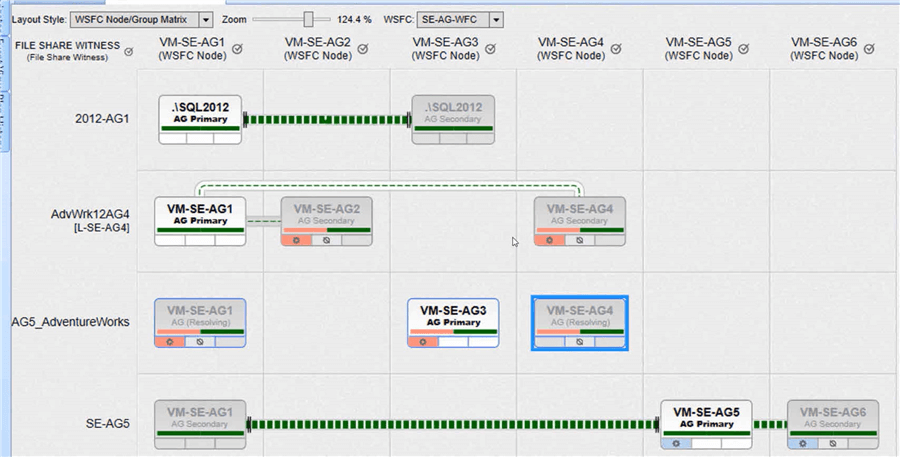
Note: The nodes, which node is primary, the replication traffic, and the mode of commit are all easy to spot. The size of the lines/pipes visually shows how much traffic is passing between the nodes. If the pipe has black lines on either end, it's in asynchronous commit mode, while the lines' absence indicates synchronous commit. If the pipe isn't present, replication isn't happening, as with AG5_AdventureWorks.
Looking a bit deeper, note the bar beneath the name of the instance. That bar is made up of two bars. The left portion indicates the health status of the availability group. Green is good, and pink is bad. The right side is the status of the replication queue. If the queue is healthy, it'll be green. Note that a queue could be healthy because data can't be replicated, such as with AG5_AdventureWorks. If the queue starts to grow, the color will change from dark green to light green and eventually to orange as the threshold for queue size is approached. If the queue size exceeds the threshold, it will turn red. The pipe likewise changes color based on pipe saturation with the same color transition.
Also, the bottom left corner of each instance indicates whether the AG is in fail-over mode. If there's a symbol there, it's in failover mode, with the node serving as the current primary also having the symbol. The failover was automatic if the symbol has the play indicator (triangle). Color also indicates a healthy or unhealthy failover, with pink being bad.
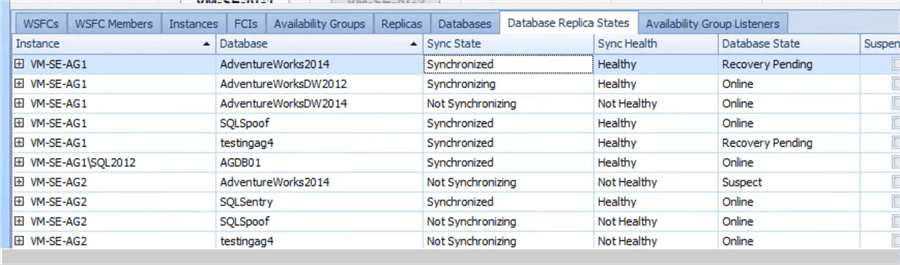
If reading a table is easier (such as in the case of a large farm), SQL Sentry provides that mechanism, too:
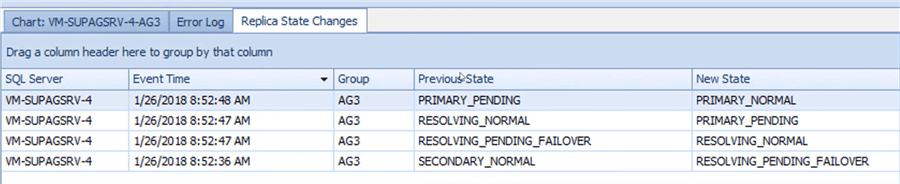
Finally, if you are investigating failovers, SQL Sentry captures changes and keeps a history of them.
Disk Activity and Usage Forecasting and Index Fragmentation
Typically, the slowest operations concerning SQL Server are when it performs disk reads and writes. Therefore, SQL Sentry includes the ability to analyze how disks are performing for a particular SQL Server instance. Here's the overall disk activity screen:
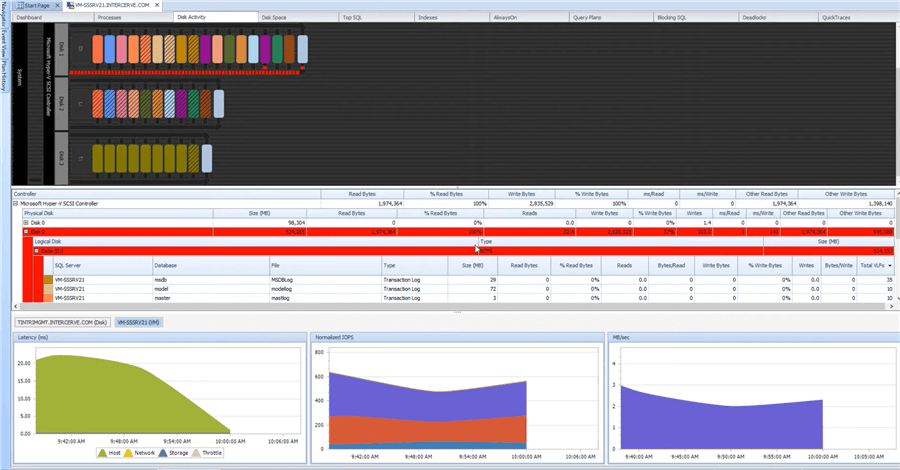
The top section shows current disk activity. Like with the AlwaysOn monitoring, the pipe size shows how much of something is going on; in this case, it is disk latency. The greater the latency, the bigger the pipe. Again, colors are used, and red is, of course, not good. If we zoom in on the top section, we can see an incredible amount of latency on disk writes. Reads are on top, writes are on the bottom, and individual ovals represent specific databases on that particular disk.
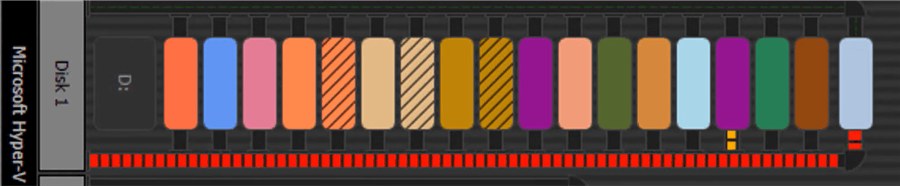
Here, we see some latency to one database, marked in orange, but it hasn't crossed the threshold yet. However, a second database is the cause for the red. It has crossed the threshold.
SQL Sentry has been forecasting disk usage for a long time. It looks at disk usage over time and forecasts how much space will be available at various time intervals. Of course, changes to the amount of usage will impact the accuracy of those forecasts. Still, if the system is mostly consistent with usage patterns, DBAs can plan ahead for when more storage is necessary. Here's an example screenshot of the forecasted usage of an individual disk over time:
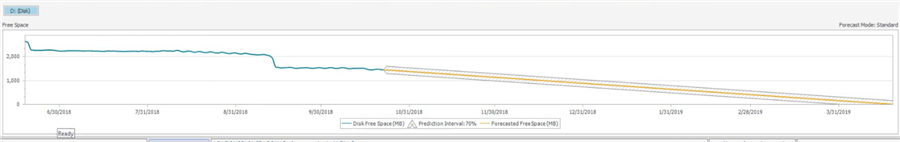
Note: In this screenshot, based on usage through October 2018, the disk was expected to run out of space in March 2019. This kind of forecasting provides the details needed to plan for necessary maintenance. Having about five months means it isn't an emergency, but the dwindling space should be handled quickly.
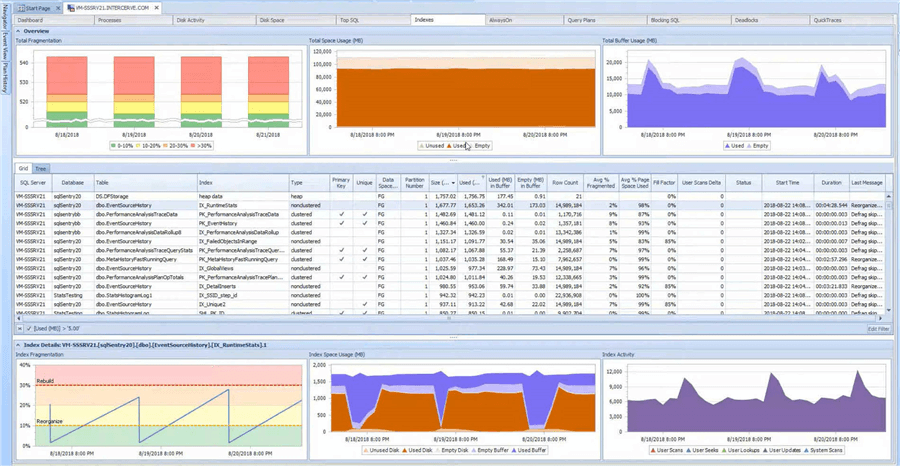
Another nice feature that SQL Sentry includes is the ability to check index fragmentation and perform defragmentation on a schedule as needed. DBAs previously relied on scripts written by community experts to handle these operations. However, maintaining indexes and statistics is essential for well-performing SQL Servers. Here's the Index page showing the overall status of the historical and current indexes. The top part of the interface shows historic information about fragmentation as well as space and buffer usage. The middle portion provides the current raw numbers. If a particular index is selected in the grid, the bottom portion provides a breakdown of fragmentation, space, and actual use.
I've intentionally not discussed setting up defragmentation because it's a multiple-step process. Instead, I'll refer to the SQL Sentry documentation on Fragmentation Manager, which covers each step.
Alerting: Conditions and Actions
For alerting, SQL Sentry has conditions and actions. Conditions are defined as thresholds or events that require action. Actions are what to do if a particular condition is met. Conditions to monitor for and actions to execute are defined on a hierarchy so that each organization can set up the alerting as needed.
Condition Categories
There are four categories of conditions:
- General Conditions
- Failsafe Conditions
- Audit Conditions
- Advisory Conditions
Most conditions lie within the general conditions category. If threshold-related, such as excessive CPU or a lack of memory, it'll be in the general conditions category. Likewise, other types of performance events, such as blocking or deadlocks, will also be found in the general conditions category.
Failsafe conditions are handled when instances or services go up or down. Failover events occur for availability groups, and other situations that represent environmental health. A full list of failsafe conditions is listed in the documentation. Audit conditions are not related to SQL Server but to SQL Sentry. An audit condition is fired when a SQL Sentry configuration change is made. One action for audit category conditions is to write the details to the database. This can't be turned off, nor would we want to. The final category comprises advisory conditions.
More on Advisory Conditions
SQL Sentry allows custom conditions to be created in the Advisory category. These can also be copied from an existing condition and modified accordingly. On the Advisory Conditions documentation page, a short video walks through copying a condition for excessive CPU and modifying it for a particular SQL Server instance. Therefore, if your environment needs more than the provided conditions, the Advisory conditions should be used.
Actions
When a condition fires, actions assigned to those conditions are then executed. Unlike older versions of SQL Sentry, the current version supports multiple actions firing on a condition. For instance, a particular condition could result in the following actions: sending emails, logging information to the database, and executing a PowerShell script, such as putting a notification into Microsoft Teams. Typical built-in actions include killing the task, executing a SQL script, logging to various locations, and sending emails and pages. There are also actions to execute processes or PowerShell scripts, so basically, anything is the limit.
Notification via email or page should be tied to when staff are available. In the contact management configuration, email information can be sent to someone who receives a notification as part of an action. Additionally, SQL Sentry has the concept of windows to assign notifications. For instance, if an organization has DBAs in several time zones to "follow the sun," windows can be set up so the on-duty group gets notified.
Here's an example of several General conditions and the type of actions to take:
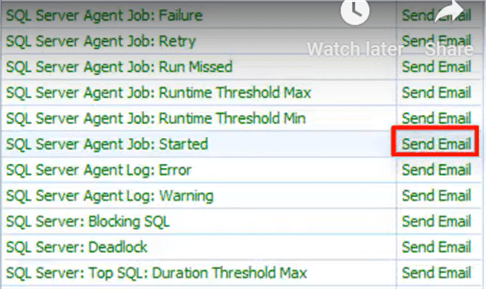
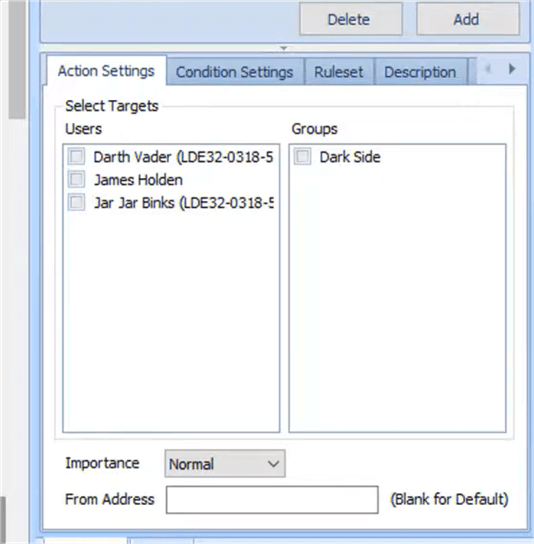
Below the set of conditions and action are targets for those actions. Here's an example of some potentially questionable "employees" who can be selected to receive an email alert when a SQL Server Agent job is started. Note also the ability to support groups.
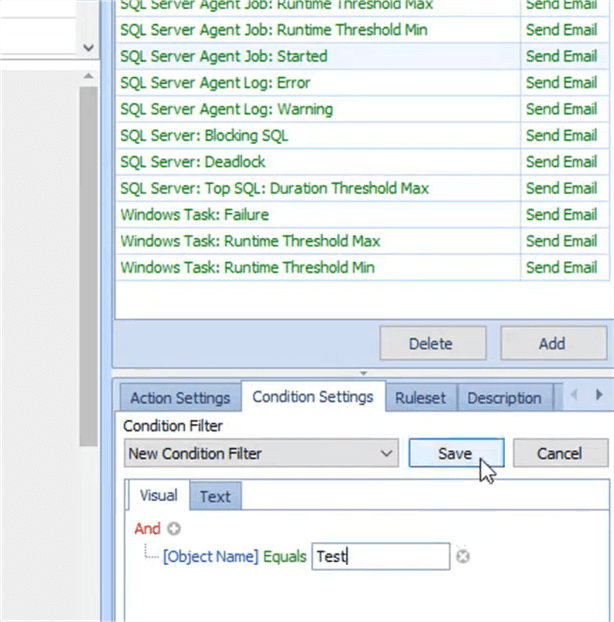
Finally, SQL Sentry can be granular in what causes a condition to fire. For instance, here's an example of a condition filter that only fires when a SQL Agent job named Test is started.
Events
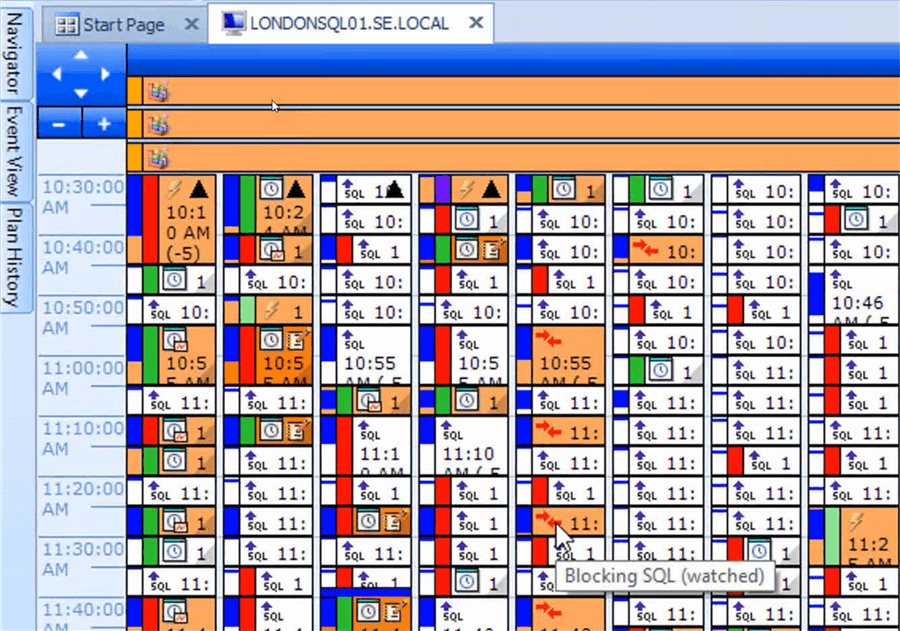
In SQL Sentry terms, events are jobs, other scheduled tasks, and occurrences like deadlocks and blocking. Basically, if the occurrence is something of interest that can be associated with a particular time, it's an event. SQL Sentry collects information about these events from SQL Server Agent, AWS, etc., and puts them visually together. Looking back at the deadlock example, the victim process was executed from a SQL Server Agent job. Was this job running concurrently with some other event? If so, could one of the events be moved so the two events execute separately? It's easier to answer these questions when we can see what's executing when. That's the power of the SQL Sentry Events. For example, here's a snapshot of events for a particular SQL Server.
Note: SQL Sentry provides visual indicators to show whether events were completed successfully (colors such as green for successful and red for failed), where events conflict with one another (all events in conflict are colored orange), and even "glyphs" to provide more detail via the use of icons. Here's an example of the interface to see all the events on a particular SQL Server instance:
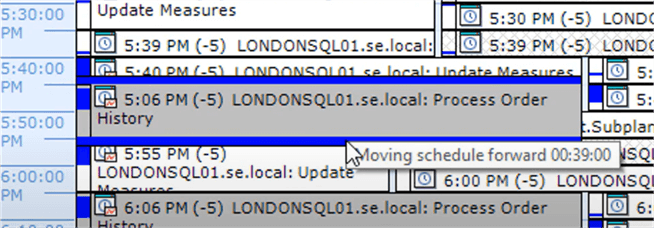
In addition, SQL Sentry allows rescheduling events through the SQL Sentry interface via drag-and-drop, so DBAs don't need to flip through multiple applications/pages to make changes. Here's an example where an event execution is being changed:
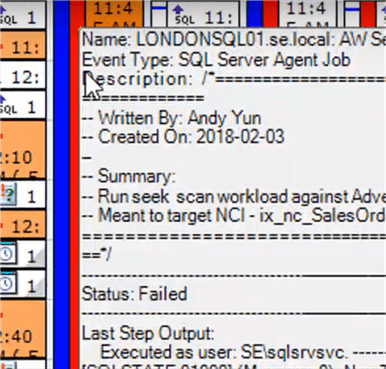
For completed events, SQL Sentry provides details about the event by hovering over said event. Here's an example where the details of a job failure can be viewed right from the calendar:
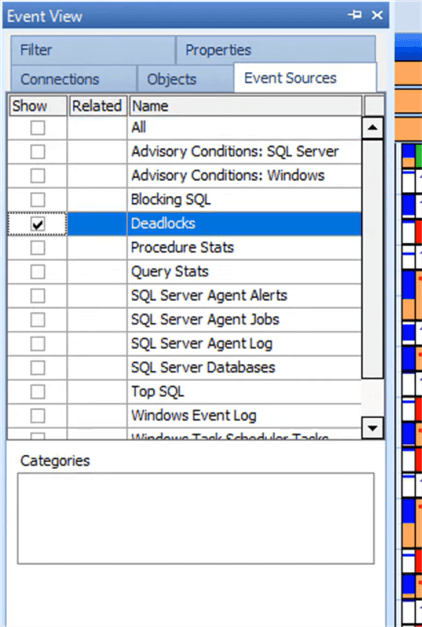
In addition, SQL Sentry provides additional readability enhancements for when there is a lot of data to display. For instance, if deadlocks are a problem and you only need to see deadlocks, you can filter the view:
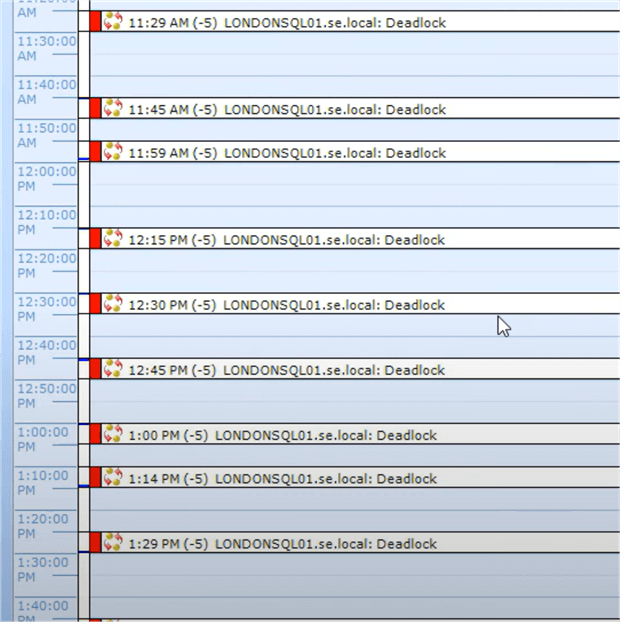
With the filter applied, the calendar is more readable, and we can see a definite issue with deadlocks on this SQL Server instance. SQL Sentry can also save the view with the filters applied as a custom calendar if it can be re-used. For example, a view showing blocking and deadlocks could be saved as a custom calendar and pulled up when reports of nightly processing run slower than usual or some other performance issue that could be tied to blocking.
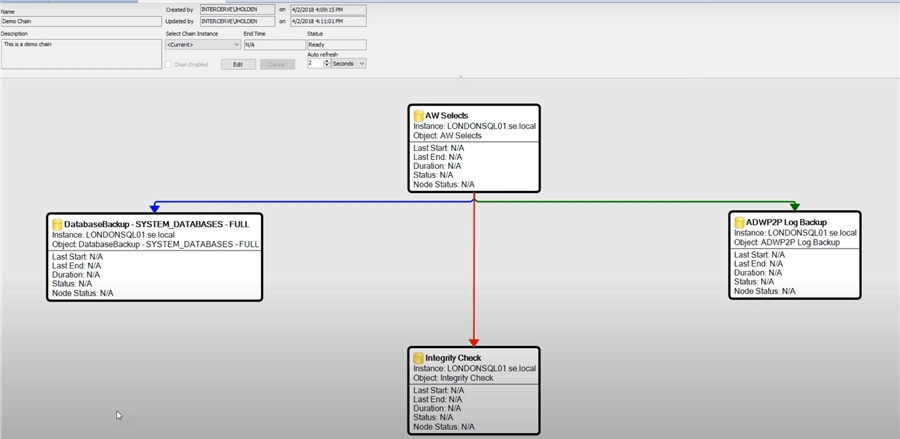
In addition, SQL Sentry allows for event chaining across different platforms and based on certain conditions. Here's an example of a demo event chain:
Returning to event conflicts, SQL Sentry provides an additional view showing all the event conflicts using a grid view.
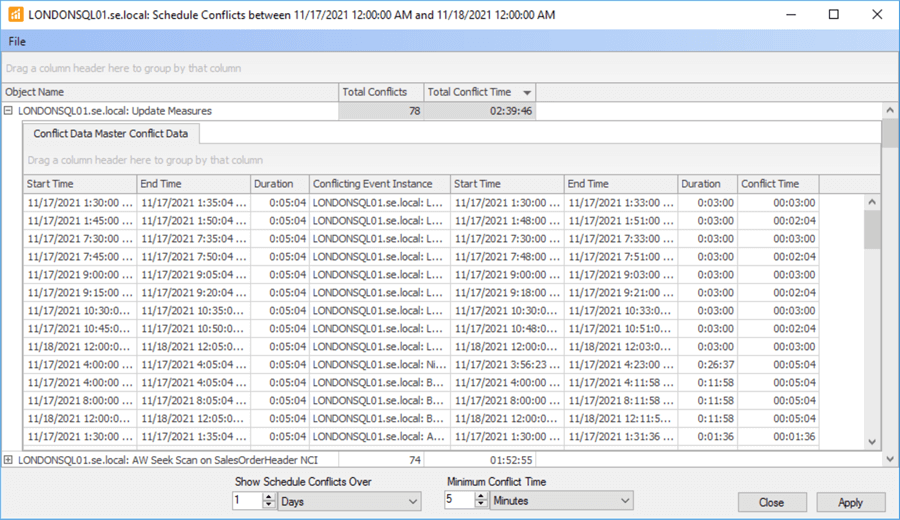
The Events portion of SQL Sentry is one of the product's greatest strengths. Since everything of significance is captured under Events, it's a great feature to correlate what may seem like separate job runs, etc., resulting in the problem being experienced.
Why SQL Sentry?
I admit I am biased for SQL Sentry because it's a product I've used for a long time. It has always done what I expected: help me find the problem quickly, alert me to issues as they develop, and allow me to understand how my SQL Servers are being used and which ones need more care and feeding than others. The new web-based portal only has the performance analysis aspects of the full client, but it has enough to research and diagnose most issues. The portal is an excellent example of how the team regularly expands SQL Sentry's feature set in valuable ways.
Next Steps
- Decide to evaluate SQL Sentry for your environment.
- Review the use cases and features to dig further into what SQL Sentry offers.
- Investigate the portal functionality at the SQL Sentry demo site.
- Download a free trial and begin your evaluation of SQL Sentry.
- Browse the technical documentation, which includes short videos showing how SQL Sentry works and how to perform specific administrative tasks
MSSQLTips.com Product Spotlight sponsored by SolarWinds, makers of SQL Sentry.
About the author
 K. Brian Kelley is a SQL Server author and columnist focusing primarily on SQL Server security.
This author pledges the content of this article is based on professional experience and not AI generated.
View all my tips
Article Last Updated: 2023-12-19