By: Ben Snaidero | Updated: 2014-08-08 | Comments (2) | Related: > Performance Tuning
Problem
I think that my SQL Server queries would benefit by being executed with multiple parallel threads. In some cases in the past I've used the MAXDOP option in my T-SQL to reduce the level of parallelism, but is there a way that I can increase the number of threads that my query uses during execution?
Solution
While in most cases the SQL optimizer will pick the best execution plan, there are instances where for whatever reason it does not. To answer the question posed in our problem we can use the DBCC SETCPUWEIGHT (value) command which essentially applies a multiplier to the cost component of the optimizer. When set large enough, above 1, it will cause the optimizer to use parallelism when executing the query. The inverse is also true. You can use the command with a multiplier between 0 and 1 to reduce the likelihood that the optimizer will generate a plan that uses parallelism.
Let's take a look at a simple example to illustrate this point.
For this example we'll use the AdventureWorks2008 database as our sample data set and the following query.
SELECT * FROM Sales.SalesOrderHeader SOH INNER JOIN
              Sales.SalesOrderDetail SOD on SOH.SalesOrderID=SOD.SalesOrderID INNER JOIN
              Production.Product P on SOD.ProductID=P.ProductID
GO
If we take a look at the explain plan for this query we see that the optimizer has chosen an execution path that does not use any parallel threads.

Now let's run the DBCC SETCPUWEIGHT command below and regenerate the plan and see if we get a parallel execution plan. Note that we also must flush the SQL cache so the optimizer will generate a new plan for our test query. Here is the TSQL to accomplish these steps.
DBCC FREEPROCCACHE
DBCC SETCPUWEIGHT(500)
GO
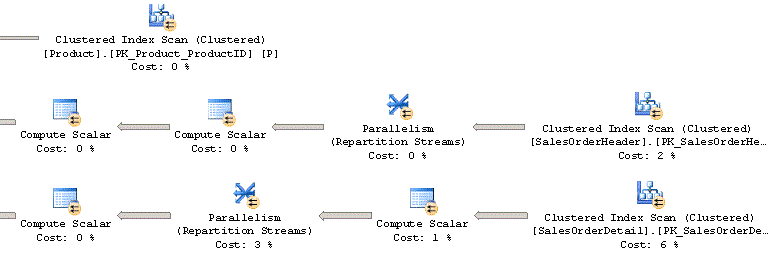
Looking at this updated explain plan we see the optimizer had indeed chosen a parallel execution path.


The optimizer now chooses to run the above query using 48 threads. We can also control the number of threads the optimizer uses by using the MAXDOP option as I am sure many of you have done in the past. Here is an example of this query.
SELECT * FROM Sales.SalesOrderHeader SOH INNER JOIN
              Sales.SalesOrderDetail SOD on SOH.SalesOrderID=SOD.SalesOrderID INNER JOIN
              Production.Product P on SOD.ProductID=P.ProductID OPTION (MAXDOP 6)
GO
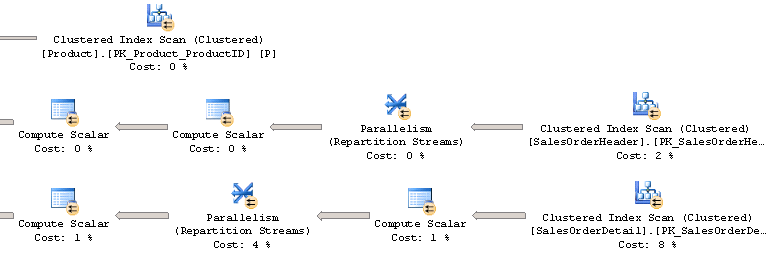
Looking at the explain plan for this query we can see that by changing the number of threads the optimizer can use, the cost of some of the execution plan steps has also changed. Another thing to note is that this MAXDOP setting of 6 will actually result in the query using 24 threads. An explanation as to why this happens during parallel query processing can be found here.


Now that we have a few different execution plan options for our query, let's use Profiler to see if any one performs better than the others. Here are some performance statistics for each query that were taken using the average statistics from 10 executions.
| Query | Reads | Writes | CPU | Duration |
|---|---|---|---|---|
| Original | 1939 | 0 | 1248 | 3725 |
| DBCC SETCPUWEIGHT(500) | 2148 | 0 | 3367 | 2866 |
| DBCC SETCPUWEIGHT(500) and MAXDOP | 2736 | 0 | 3169 | 3092 |
We can see from these results that our query does execute a little bit faster
when we introduce parallelism, but it also uses more CPU and performs more reads in both cases. If you decide that all you want is faster execution then you could generate this plan and
force SQL Server to use that plan as described here.
Next Steps
- Perform IO query tuning by using the DBCC SETIOWEIGHT command
- Read more on the MAXDOP option
About the author
 Ben Snaidero has been a SQL Server and Oracle DBA for over 10 years and focuses on performance tuning.
This author pledges the content of this article is based on professional experience and not AI generated.
View all my tips
Article Last Updated: 2014-08-08


