By: Thomas LeBlanc | Updated: 2014-09-05 | Comments (7) | Related: > Analysis Services Development
Problem
In the health care world, claims are identified by many attributes. A frequently requested attribute is Diagnosis. These codes are used to identify types of claims and categorize claims for reporting and analytics. But once users request slicing by more than just the Primary Diagnosis, the one to many option is no longer valid. What can be done in Dimensional Modeling and Multidimensional Analysis Services to handle this request?
Solution
Many-to-Many Data Mart
Analysis Services multidimensional cubes have the enterprise level features to support slicing and dicing for large volumes of claims using a many-to-many relationship. The Kimball Group suggests different paths for Data Marts to take when modeling Many-to-Many relationships. The method we will look at involves relating a group of Diagnosis to each line item in a claim.
The data comes in 2 separate tables – ClaimDiag and ClaimRevenue. They each have multiple rows related to one unique claim number. Here is a look at a Data Diagram (simplistic).
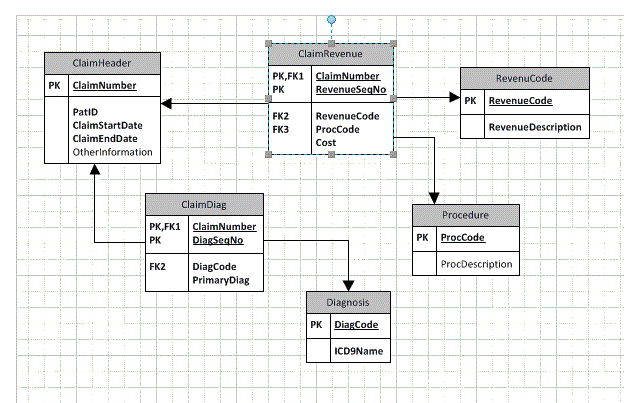
The Claim Revenue table is going to be the main source of the Fact table in this OLAP design and Cost is used as the measure along with counts. The Claim Diagnosis table will be related in a Many-to-Many fashion. This means that one Diagnosis Code for a claim can be related to each Line Item (Revenue) in a claim. Here is our star schema without the Diagnosis:
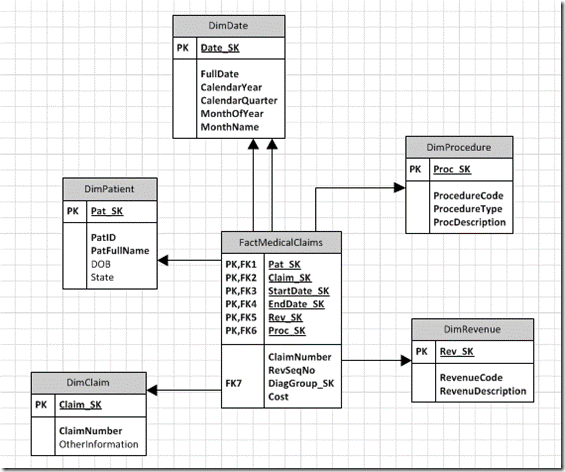
Adding Many-To-Many Dimension and Fact Tables to Data Mart
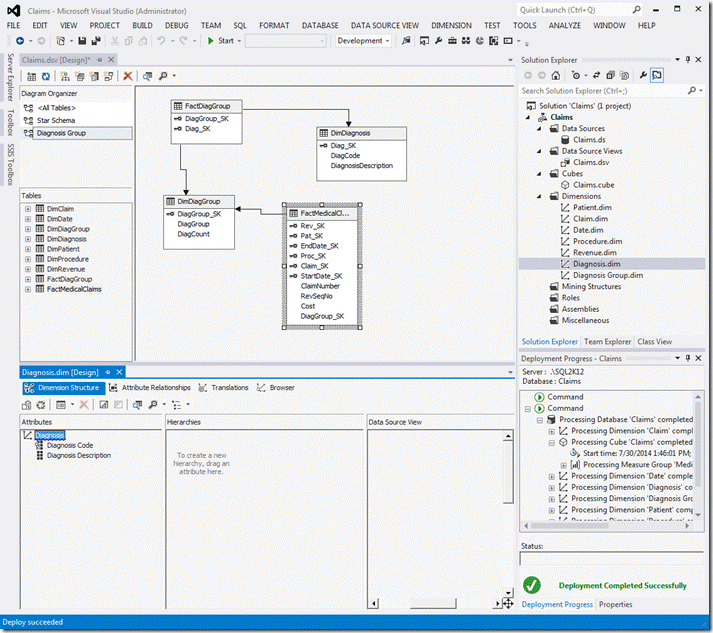
We will add 3 additional tables to the design: DimDiagnosis, DimDiagGroup and FactDiagGroup. The surrogate key from DimDiagGroup will be added to the FactMedicalClaims table. The following diagram shows that the Line Items in Medical Claims has an indirect relationship to DimDiagnosis through the DimDiagGroup (Dimension) and FactDiagGroup (Bridge Fact) tables.
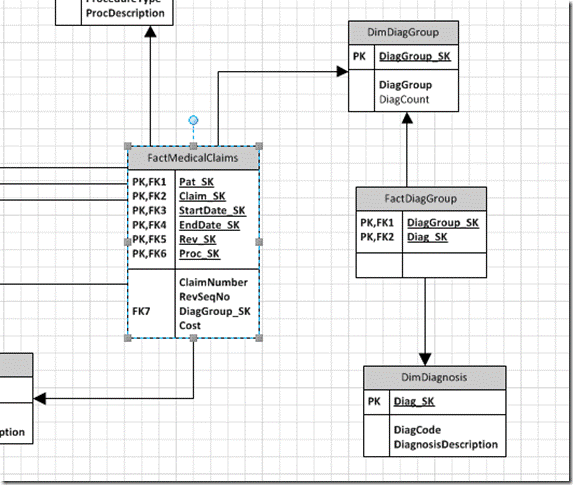
The DimDiagGroup table contains different combinations of Diagnosis Codes found in the Medical Claims. This table does not have to have all possible combinations, but needs to have the ones related to the known claims.
Diagnosis Groups
Here is an example of some data from the Diagnosis Grouping table. The combination of Diagnosis Codes are representing the possible combinations on one or more claims. Each line item will be related to this grouping.
DiagGroup_SK |
Group Names | Group Count |
|---|---|---|
| 1 | 0100,0200,0300 | 3 |
| 2 | 0130 | 1 |
| 3 | 0400,0500,0060,0080 | 4 |
Dimension Relationships
Setting up this relationship in Analysis Services requires 2 new Dimensions - Diagnosis and DiagnosisGroup. The DiagnosisGroup will not be visible in the cube. The cube without the Many-To-Many looks like the following:
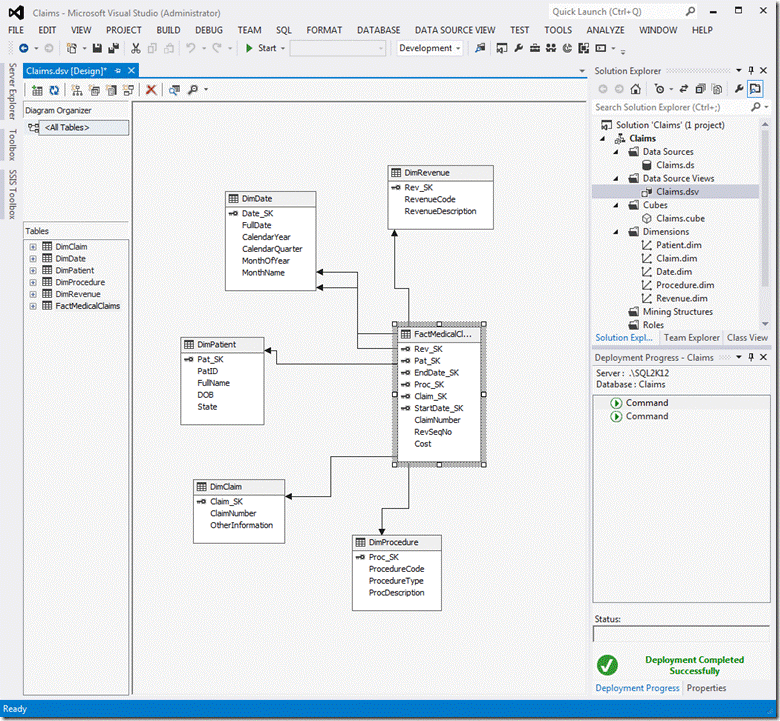
The Data Source View (DSV) will now include the 3 new tables. The 2 new dimension tables will have dimension objects created in the cube.
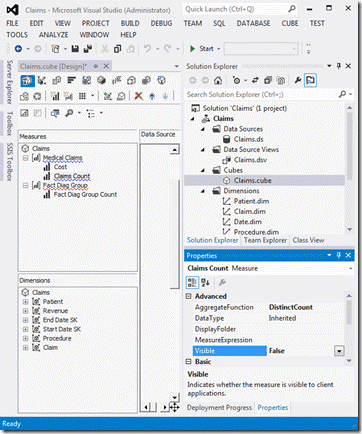
Next, we create a Measure and Measure Group for the FactDiagGroup as a count, but Visible is false. This Measure Group is needed for the eventual many-to-many relationship.
There is an error identified that there is no relationship between the new measure and any dimension. We will need to add the Diagnosis Dimension to the Cube.
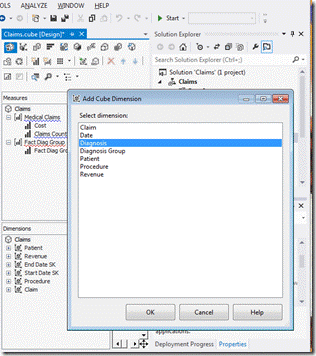
This will give the Diagnosis dimension a relationship with the Fact Diag Group measure group through the Diagnosis surrogate key. The Cube understands the join because a relationship was setup in the Data Source View (DSV) between these tables.
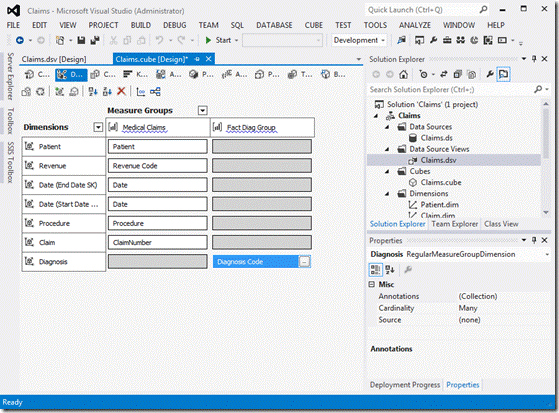
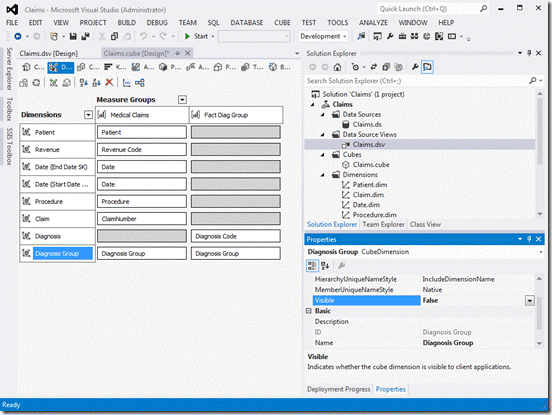
Before we can setup the many-to-many relationship between Medical Claims and Diagnosis, we need to add the Diagnosis Group dimension to the Dimension Usage area of the cube and make Visible = False for the Diagnosis Group dimension.
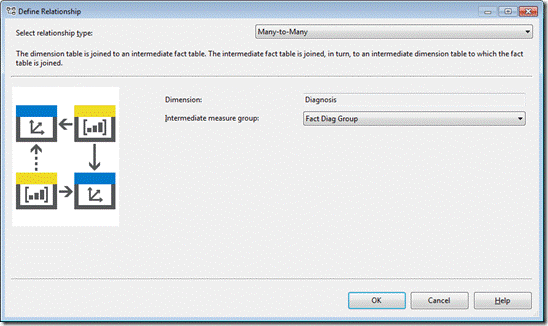
To add a Dimension Usage between the Medical Claims measure group and Diagnosis dimension, we need to setup a many-to-many.
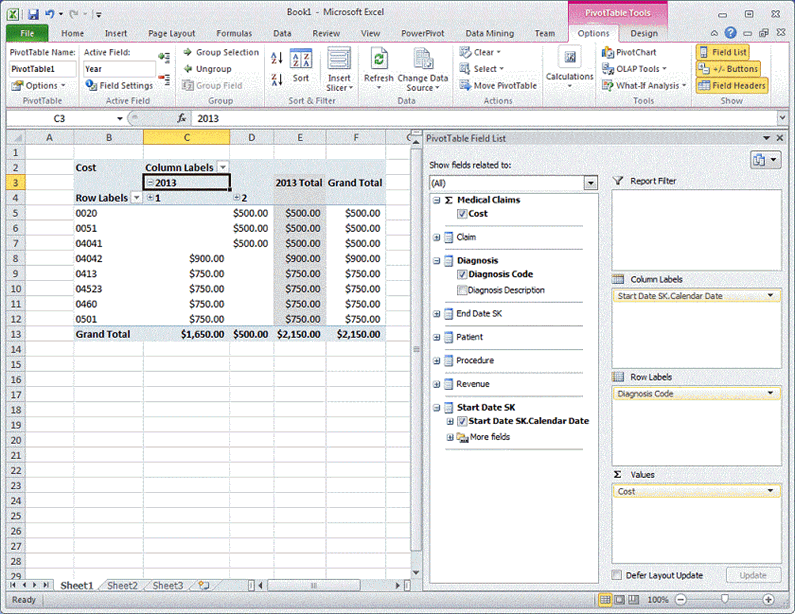
And now will can slice the Cost by Diagnosis Codes. The Costs (and Counts) of a claim is now associated with a Diagnosis (or really more than one diagnosis).
Next Steps
- Keep this technique in your toolbox as you design your SQL Server data marts.
- Check out these SQL Server Business Intelligence resources.
About the author
 Thomas LeBlanc is a Sr DBA and MCITP 05/08 DBA & 08 BI has spoken at the PASS Summit 2011/12, SQL Rally & many SQL Saturday’s.
This author pledges the content of this article is based on professional experience and not AI generated.
View all my tips
Article Last Updated: 2014-09-05


