By: Rick Dobson | Comments (3) | Related: > TSQL
Problem
Demonstrate some simple examples of how to build, populate, and query a data warehouse for time series data in SQL Server. Please present sample code and results that facilitates adapting the solution to other time series datasets.
Solution
A prior tip illustrated how to collect time series data from Yahoo Finance to populate a table in SQL Server. Stock price and volume data are a free, public source for time series data. The table of values collected from Yahoo Finance contained millions of rows!
This tip demonstrates how to build on the prior tip by populating a data warehouse with the collected data. More specifically, you will see how to create dimension and fact tables for a data warehouse. You will also discover simple examples of how to query the data warehouse to answer common questions for time series data.
An overview of the data warehouse
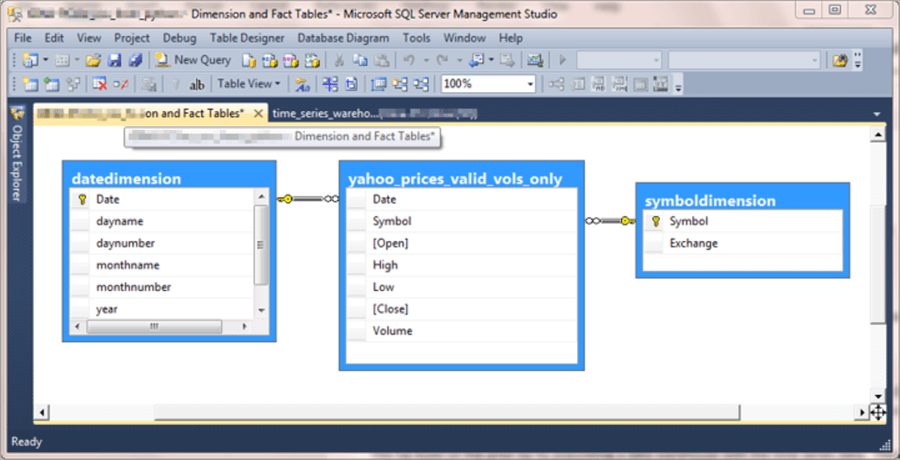
The screen shot below shows a database diagram of the data warehouse model. The model’s design can be easily adapted to time series data from many different domains.
- The fact table in this tip has the name yahoo_prices_valid_vols_only.
This table contains three kinds of data common for time series datasets.
- The Date column denotes a datetime dimension – when were the facts assessed.
- The Symbol column denotes an entity type for the tracking of time series data. In this case, the entity is a stock symbol. However, it could as easily denote a product sold by a company or a weather station from which temperature and precipitation are measured.
- The Open, High, Low, Close, and Volume columns denote measures on entities that can change over time.
- A dimension table in a data warehouse model characterizes a column in the
fact table as belonging to a dimension value, such as a date or a symbol.
The diagram below shows two tables used for storing dimension values.
- The datedimension table denotes sequential trading dates and related measures to help track and analyze datetime values.
- The symboldimension table contains values identifying different entities. In this tip, the entities are symbols, but they can be anything else about which you are collecting measurements over time. The symboldimension table, like the datedimension table, includes one or more additional columns; the additional column in the symboldimension table is named Exchange. The Exchange column values denote the name of the exchange on which a symbol trades (AMEX, NASDAQ, and NYSE).
Building and populating the dimension tables
When designing a data warehouse in SQL Server, you will typically build and populate the dimension tables prior to the fact table. This is because the fact table specification references the dimension tables.
All dimension tables for time series data must have a dimension pointing at datetime units. The dimension table for datetime in this tip has the name datedimension. The code at the beginning of the following script conditionally removes any prior version of the datedimension table. The specification for the datedimension table appears below.
- Its primary key is date, which has a date data type.
- The dayname and daynumber columns contain two different ways of characterizing the day of the week for a date value.
- The monthname and monthnumber columns contain two different ways of characterizing the month to which a date belongs.
- The column named year contains an integer value for the year in a date.
- Note from the comments at the top of the script that no foreign key reference should point at the dimension table prior to its creation. This can become an issue if you try to create a dimension table after creating a fact table.
-- drop table for dbo.datedimension if it exists
-- assumes no foreign key reference already exists to the table
-- view the code in the "Building and populating the fact table" section
-- for sample code to remove a foreign reference to this table
if (select(object_id('dbo.datedimension'))) is not null
drop table dbo.datedimension
go

-- create table for datedimension
create table dbo.datedimension(
   [Date] date not null primary key,
   [dayname] nvarchar(10) not null,
   [daynumber] tinyint not null,
   [monthname] nvarchar(10) not null,
   [monthnumber] tinyint not null,
   [year] int not null
)
The following script populates and displays the datedimension table. An insert statement populates the datedimension table from a select statement, which has an inner select statement named for_distinct_dates. The query for_distinct_dates extracts distinct dates from a table named yahoo_prices_volumes_for_MSSQLTips. The process for populating the table in the sub-query appears in the prior tip for collecting time series data for over 8,000 symbols from Yahoo Finance. Dayname, daynumber, monthname, monthnumber, and year are computed fields based on date column values.
-- simple date dimension table
insert datedimension (date, dayname, daynumber, monthname, monthnumber, year)
select
 date
,datename(weekday,date) dayname
,datepart(weekday,date) daynumber
,datename(month, date) monthname
,month(date) monthnumber
,year(date) year
from (select distinct date date from dbo.yahoo_prices_volumes_for_MSSQLTips) for_distinct_dates
order by date

-- echo datedimension
select * from datedimension
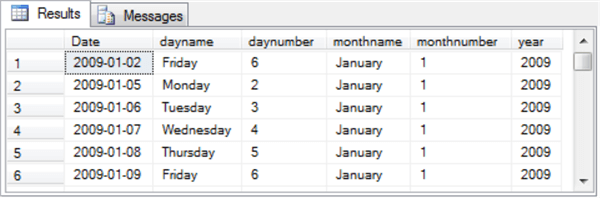
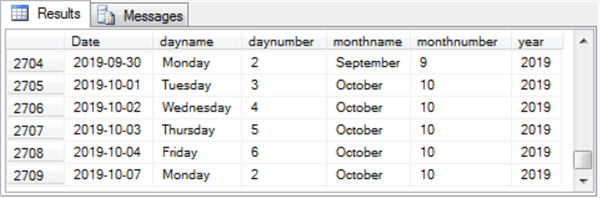
The following screen shot shows the first and last six rows from the datedimension table.
- The date values start with the first trading date in 2009, January 2, 2009.
- The date values end with the last trading date for which prices and volumes were collected. This date is October 7, 2019.
- The daynumber and monthnumber column values facilitate sorting query results
by day-of-week and month order instead of alphabetical order for dayname or
monthname.
- Daynumber refers to a weekday number starting with 2 for Monday. The last trading date for a week corresponds to a daynumber value of 6 for Friday.
- Monthnumber refers to the number for a month starting with 1 for January and running through 12 for December.
You will typically need a categorical dimension to track entities to which time series measurements belong. This tip uses the name symboldimension for the table holding entity identifiers and other values that characterize entities. The entities in this tip are symbols trading on one of three stock exchanges. Each stock symbol is characterized by an exchange name where the stock symbol is listed for trading.
Here’s the T-SQL specifying the symboldimension table. Some conditionally executed code at the beginning of the script removes any prior version of the symboldimension table in the dbo schema. This dimension table has two columns – one for the symbol and another for the exchange on which a symbol trades. Both columns have an nvarchar data type.
-- drop table for dbo.symboldimension if it exists
-- assumes no foreign key reference already exists to the table
-- view the code in the "Building and populating the fact table" section
-- for sample code to remove a foreign reference to this table
if (select(object_id('dbo.symboldimension'))) is not null
drop table dbo.symboldimension
go

-- create table for symboldimension
create table dbo.symboldimension(
   Symbol nvarchar(10) not null  primary key,
   Exchange nvarchar(10) not null
)
The following T-SQL script populates the symboldimension table based on two sources.
- The yahoo_prices_volumes_for_MSSQLTips table is a table with time series data for the symbols. The distinct keyword in the select statement within the from clause returns just one row for each symbol across all the time series rows for each symbol. The time series data is derived originally from Yahoo Finance.
- The ExchangeSymbols table is from the eoddata company, which provides Exchange names for where the symbols are listed for trading. This information is available without charge; the process for collecting the data is described here.
-- simple symboldimension table
insert symboldimension
select one_row_one_symbol.symbol, ExchangeSymbols.Exchange
from
(select distinct symbol symbol
from dbo.yahoo_prices_volumes_for_MSSQLTips) one_row_one_symbol
inner join dbo.ExchangeSymbols
on one_row_one_symbol.symbol = ExchangeSymbols.symbol
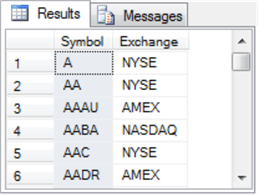
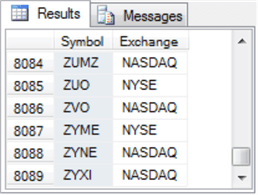
Here are two excerpts from the symboldimension table. The first excerpt shows the first six rows from the table, and the second excerpt from the table shows the last six rows.
- The first excerpt shows the symbols starting in alphabetical order (Symbol is the primary key for the table). The second column is an identifier for the exchange on which a symbol trades.
- The second excerpt shows there are 8089 symbols in the time series dataset.
Building and populating the fact table
Here’s the script for specifying the fact table. The fact table stores the time series data for the entities in the data warehouse.
- The name for the fact table is yahoo_prices_valid_vols_only. This name reflects fact that the source data are cleaned in some way from the original source data from Yahoo finance. In particular, the fact table only includes rows for trading dates on which there is a valid volume value – namely one that is neither null nor zero. A date is not a trading date if no shares are exchanged for the symbol on that date.
- There are seven columns in the fact table.
- Date references the Date column in the datedimension table.
- Symbol references the Symbol column in the symboldimension table.
- Open through Volume represent measures on a symbol for a trading date.
- Open through Close represent different prices for a security during
a trading date.
- Open is the opening price on a trade date.
- High is the largest price over the course of a trade date.
- Low is the smallest price over the course of a trade date.
- Close is the closing price on a trade date.
- Volume denotes the number of shares exchanged during a trading date.
- Open through Close represent different prices for a security during
a trading date.
- The script closes with the addition of two foreign key constraints that
tie the fact table to the dimension tables as well as a primary key based on
Symbol and Date. Every row in a time series dataset is unique based on
the entity and date for which the measures were collected.
- The fk_date constraint links Date column values from the fact table to Date column values in the datedimension table.
- The fk_symbol constraint links Symbol column values from the fact table to Symbol column values in the symboldimension table.
- The primary key is not strictly necessary. This constraint can facilitate visual verification of the results sets derived for queries based on the fact table along with dimension tables.
- The go keywords after alter table statements for constrains are not strictly necessary, but their use facilitates debugging statements to conditionally drop and add constraints through the display of error statements for code blocks.
-- drop and re-create dbo.yahoo_prices_valid_vols_only table
-- dbo.yahoo_prices_valid_vols_only is the fact table for the data warehouse
if (select(object_id('dbo.yahoo_prices_valid_vols_only'))) is not null
drop table dbo.yahoo_prices_valid_vols_only
go

create table dbo.yahoo_prices_valid_vols_only(
   [Date] [date] NOT NULL,
   [Symbol] [nvarchar](10) NOT NULL,
   [Open] [money] NULL,
   [High] [money] NULL,
   [Low] [money] NULL,
   [Close] [money] NULL,
   [Volume] [bigint] NULL
)

go

--  conditionally drop primary key named pk_symbol_date
if (select(object_id('pk_symbol_date'))) is not null
alter table dbo.yahoo_prices_valid_vols_only drop constraint pk_symbol_date;
go

alter table dbo.yahoo_prices_valid_vols_only
   add constraint pk_symbol_date primary key clustered (Symbol, Date);
go


-- conditionally drop foreign key constraint named fk_date
if (select(object_id('fk_date'))) is not null
alter table dbo.yahoo_prices_valid_vols_only drop constraint fk_date;
go

alter table dbo.yahoo_prices_valid_vols_only
   add constraint fk_date foreign key (Date)
      references dbo.datedimension (date)
      on delete cascade
      on update cascade;
go


-- conditionally drop foreign key constraint named fk_symbol
if (select(object_id('fk_symbol'))) is not null
alter table dbo.yahoo_prices_valid_vols_only drop constraint fk_symbol;
go

alter table dbo.yahoo_prices_valid_vols_only
   add constraint fk_symbol foreign key (Symbol)
      references dbo.symboldimension (Symbol)
      on delete cascade
      on update cascade;
Here’s a T-SQL script for populating the fact table from the yahoo_prices_volumes_for_MSSQLTips table, which contains the original source data from Yahoo Finance.
- The where clause performs cleaning of the source data to remove rows for trading dates during which no shares were exchanged. The comment lines at the top of the following script denote the original number of rows in the source data and the number of rows in the cleaned fact table.
- The order by clause is not strictly necessary, but it ensures the time series data pumped into the fact table is arranged by date within symbol. If you care to visually inspect the source data before insertion into the fact table, the order by clause adds value.
-- populate dbo.yahoo_prices_valid_vols_only
-- yahoo_prices_volumes_for_MSSQLTips
-- with volume is not null and volume != 0
-- source table has 15483188 rows
-- where clause filters out 862303 rows
-- cleaned results set has 14620885 rows
insert into dbo.yahoo_prices_valid_vols_only
select
 [Date]
,[Symbol]
,[Open]
,High
,Low
,[Close]
,Volume
from dbo.yahoo_prices_volumes_for_MSSQLTips
where ([volume] is not null) and ([volume] != 0)
order by Symbol, Date
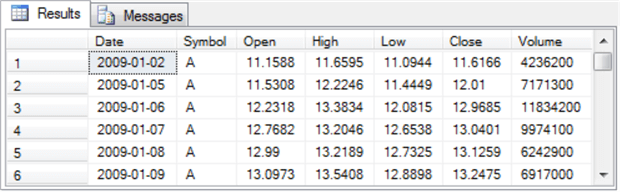
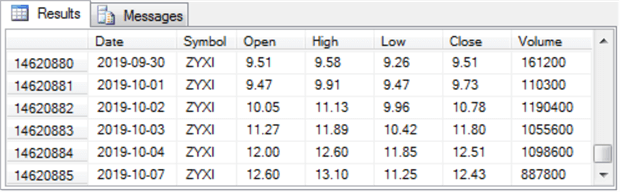
Here are excerpts from the full display of the fact table via a T-SQL script (select * from dbo.yahoo_prices_valid_vols_only).
- The first screen shot is for the first six rows from the fact table. This shot features the A symbol beginning with the first trade date in the table.
- The second screen shot is for the last six rows from the fact table. This shot features the ZYXI symbol ending with the last trade date in the table.
- The primary key for the fact table determines the order of rows by trade date within symbols.
Introduction to querying the fact and dimension tables
This section introduces you to some basics for querying fact and dimension tables with the data from this tip. The following query computes three aggregations of the data for the fact table joined to the dimension tables.
- The aggregations are for
- the count of distinct symbols from the symboldimension table
- the count of distinct trading dates from the datedimension table
- the count of trading dates for all symbols across all dates in the fact table
- The data source for the query is the fact table inner joined to
- the datedimension table by Date
- the symboldimension table by Symbol
- The query groups the joined data sources by Exchange column values from the symboldimension table
-- aggregation for count of distinct symbols,
-- count of distinct date dimension values (distinct_trading_dates) and
-- count of rows (number_of_trading_dates)
-- grouped by and ordered by Exchange in symboldimension
select
 symboldimension.Exchange
,count(distinct symboldimension.Symbol) distinct_symbols
,count(distinct datedimension.Date) distinct_trading_dates
,count(*) number_of_trading_dates
from dbo.yahoo_prices_valid_vols_only
inner join datedimension
on yahoo_prices_valid_vols_only.Date = datedimension.Date
inner join symboldimension
on yahoo_prices_valid_vols_only.Symbol = symboldimension.symbol
group by symboldimension.Exchange
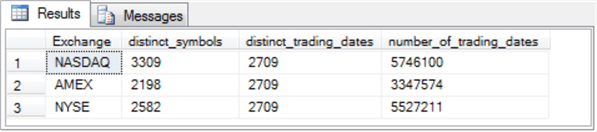
Some readers may be able to enhance their understanding of the query code by examining its results set.
- There are three rows in the results set – one for each of the three stock exchanges contributing time series data to the data warehouse.
- Aside from the column values denoting exchanges, there are three columns
for aggregate values.
- The distinct_symbols column presents a count of the distinct symbols from the symboldimension table. The sum of the values in the distinct_symbols column across all three exchanges (3309+2198+2582) is 8089. The listing of symbol values in the symboldimension table confirms this value.
- The count of distinct trading dates is the same for all three exchanges. This value is 2709. The listing of date values in the datedimension table confirms this value.
- The number of trading dates varies by exchange – especially for the AMEX exchange relative to the NASDAQ and NYSE exchanges. The sum of the number of trading dates across all three exchanges (5746100+3347574+5527211) is 14620885. The listing of rows in the fact table confirms this value.
Is there a day-of-week effect?
One reason for performing queries on the contents of a data warehouse is to test different hypotheses about the warehouse contents. For example, some manager or analyst may ask: are close prices consistently higher on one day of the week and lower on another day of the week? This section reviews a couple of query designs with their results sets to illustrate different approaches for developing results bearing on a question like this.
The first query design computes the average close price and count of trading dates for each day of the week. The code for the query design appears below. The query design is a nested one.
- The inner query named for_daily_average_close extracts base data from the
fact table and the datedimension table.
- The fact table provides base data for close prices along with their trading dates.
- The datedimension table provides base data on the day of the week to which a trading date belongs. Day of the week is denoted by both daynumber and dayname.
- The outer query includes a group by clause for daynumber and dayname for
the results set from the inner query. The outer query also orders its
result set rows by dayname within daynumber.
- The select list for the outer query includes aggregate functions for computing average close price and number of trade dates by day of the week.
- The select list also includes daynumber and dayname fields to work in coordination with the group by clause. These fields support the display of average close price and number of trade dates by day of the week.
- The final order by clause arranges the rows of output from the outer query in day-of-the-week order instead of alphabetical order by dayname.
-- close by day of week across all symbols
select daynumber, dayname, avg([close]) [Close], count(*) trade_dates
from
(
select
 yahoo_prices_valid_vols_only.Date
,datedimension.daynumber
,datedimension.dayname
,dbo.yahoo_prices_valid_vols_only.[close]
from dbo.yahoo_prices_valid_vols_only
inner join datedimension
on yahoo_prices_valid_vols_only.Date = datedimension.Date
) for_daily_average_close
group by daynumber, dayname
order by daynumber, dayname
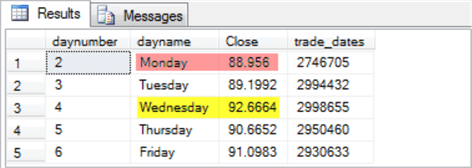
Here’s the results set from the first query design.
- You can see that the daynumber column values appear in numerical order from 2 through 6 so the dayname column values appear from Monday through Friday.
- There are two easily identifiable points about the close prices and number
of trading dates.
- The largest average close price is for Wednesday (appears with a yellow background), and the smallest average close price is for Monday (appears with a red background).
- The weekdays of Tuesday through Friday each have about 2.9 million trading dates, but Monday only has about 2.75 million trading dates.
The preceding screen shot shows average close price and number of trading dates across all symbols. Recall that the data in the data warehouse are for over 8,000 symbols. Do the results across all symbols match those for individual stock symbols?
The following script shows an adaptation of the preceding script. Instead of reporting average close price and number of trading dates by day of the week across all symbols, the following script reports these results for a single symbol -- namely, SPY, which is a symbol based on the aggregation of price and volume for all individual symbols in the S&P 500 index.
- As with the preceding query, this new query design relies on a nested query.
- The inner query has two changes from the preceding query design for results
across all symbols.
- The inner query includes an inner join of the fact table with the symboldimension table.
- In addition, the inner query includes a where clause to return a results set of average close price and number of trading dates only for the SPY symbol.
- The outer query also has two changes from the preceding query design for
results across all symbols.
- The group by clause is for Symbol as well as daynumber and dayname.
- Also, Symbol appears in the first field in the select list.
-- close by day of week for SPY
select Symbol, daynumber, dayname, avg([close]) [Close], count(*) trade_dates
from
(
select
 yahoo_prices_valid_vols_only.Symbol
,yahoo_prices_valid_vols_only.Date
,datedimension.daynumber
,datedimension.dayname
,dbo.yahoo_prices_valid_vols_only.[close]
from dbo.yahoo_prices_valid_vols_only
inner join datedimension
on yahoo_prices_valid_vols_only.Date = datedimension.Date
inner join symboldimension
on yahoo_prices_valid_vols_only.Symbol = symboldimension.symbol
where symboldimension.symbol = 'SPY'
) for_daily_average_close
group by Symbol, daynumber, dayname
order by daynumber, dayname
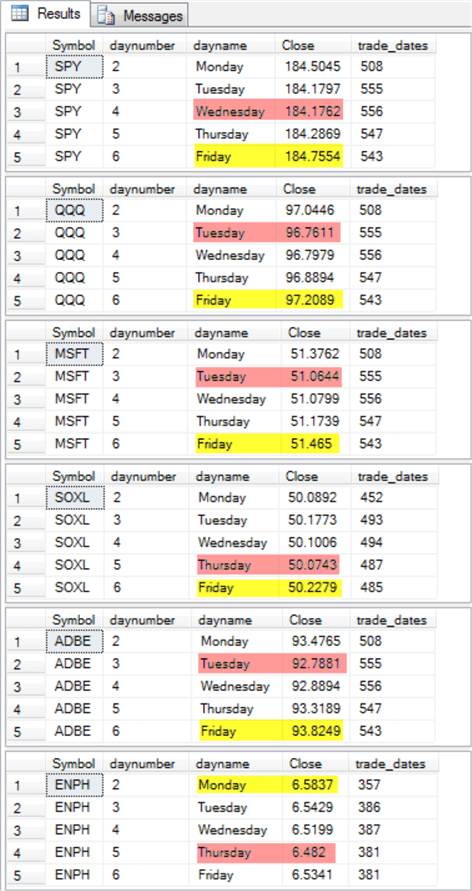
By replacing SPY in the preceding script with other symbols, you can easily generate results for a range of individual symbol values. In this way, you can generate results that allow a verification of whether the average results for weekday effects across all symbols is consistent with comparable results for individual symbols. Of course, you can also assess if the weekday effects are the same across a select set of individual symbols. The following screen shot shows the results for this select set of individual symbols: SPY, QQQ, MSFT, SOXL, ADBE, and ENPH.
- The largest average weekday price for each symbol has its dayname and average close price highlighted in yellow.
- The smallest average weekday price for each symbol has its dayname and average close price highlighted in red.
The largest average close price is on Friday for all the selected symbols, except ENPH. This outcome is at variance with the results across all symbols where the average highest close price is on Wednesday. The smallest average close price varies among the members of the select set of individual symbols. Also, the smallest average weekday close across all symbols does not match the smallest weekday close for any of the select set of symbols. The easy take-away from these query results is that there is no evidence of a consistent day-of-the-week effect
- for largest or smallest close prices across different symbols
- or for a select set of symbols versus all the symbols.
Next Steps
Try out the code examples for this tip. All the referenced scripts are in this tip’s download file. You will additionally need to run the scripts from this other tip to create the dbo.yahoo_prices_volumes_for_MSSQLTips table and ExchangeSymbols table to which this tip refers.
- Try to duplicate the results in this tip with the same symbols as in this tip.
- If you are not interested in three major US exchanges, try using symbols from other exchanges available from eoddata.
- You can also try to use the approach described here for ticker symbol data to other kinds of data, such as readings from weather stations or product sales and production data over time.
- Finally, leave a comment about your success in adapting this tip for your business as well as any related issues you want covered in future tips.


About the author
 Rick Dobson is an author and an individual trader. He is also a SQL Server professional with decades of T-SQL experience that includes authoring books, running a national seminar practice, working for businesses on finance and healthcare development projects, and serving as a regular contributor to MSSQLTips.com. He has been growing his Python skills for more than the past half decade -- especially for data visualization and ETL tasks with JSON and CSV files. His most recent professional passions include financial time series data and analyses, AI models, and statistics. He believes the proper application of these skills can help traders and investors to make more profitable decisions.
This author pledges the content of this article is based on professional experience and not AI generated.
View all my tips
