By: Scott Murray | Updated: 2022-05-11 | Comments | Related: > Power BI
Problem
What is the Power BI Desktop tool and how can it best be used for business intelligence and data visualization projects?
Solution
Power BI Desktop is the stalwart development tool used for the bulk of interactive reports and dashboard design work in Microsoft Power BI. Although a report designer can use Power BI Report Builder for design work, that tool is a lightweight version generally used for one off development tasks. Power BI Desktop provides the richest experience for the development, design and transformation of dashboard reports that will be published to the Power BI service. However, Power BI desktop can also be used in other situations by Data Analysts such as data discover work along with minor to major transformations of data sources on-premises and in the Azure cloud.
Within this tip, we will be using Power BI Desktop for a limited number of examples. Thus, to get started Power BI Desktop must be downloaded. Additionally, we will be using the WideWorldImportersDW database as a basis for our data sources; this database can be downloaded from GitHub. If you need a refresher on bringing data into Power BI please see: Querying SQL Server Data with Power BI Desktop.
What is Microsoft Power BI Desktop?
For those who may be on the fence about using the tool, one significant benefit is that it is free to use; that is until you are wanting to publish to the Power BI Service which then requires a per license or enterprise licensing agreement along with, generally, an organization or corporate email account. Even with this limitation Power BI Desktop can be a useful tool for data exploration, discovery and even cleaning. Additionally, some work done in the query editor can be shared with other applications such as SQL Server Integration Services (SSIS).
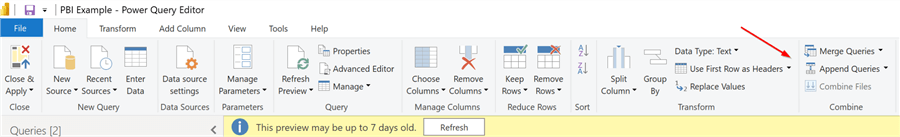
Let us start with a tour of some of the features of Power BI Desktop. The number one task that will be used is the transform data button which opens the Query Editor.
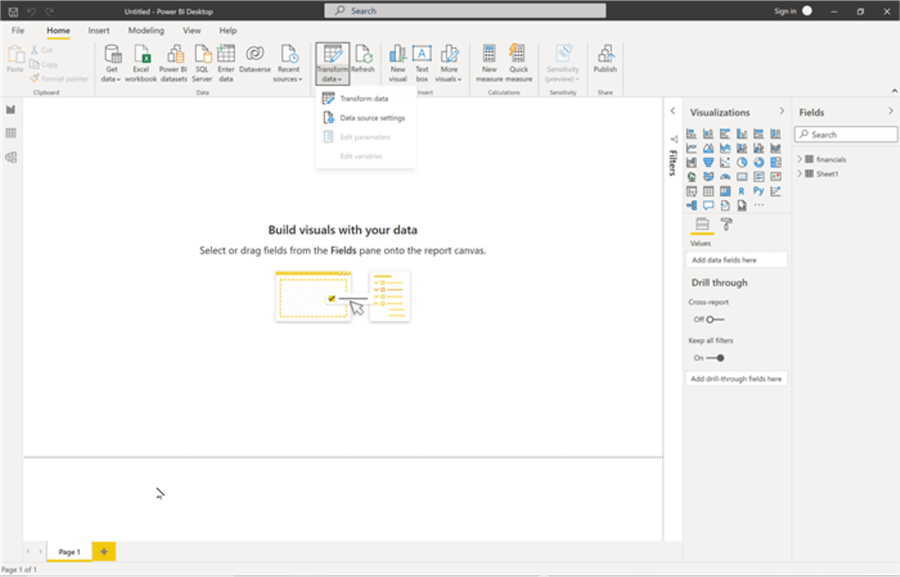
The query editor is the main location for importing and transforming data. It allows for many changes including:
- Column data types
- Column additions
- Merging queries
- Appending queries
- Duplicating columns
- Filtering data
- Parsing and extracting data
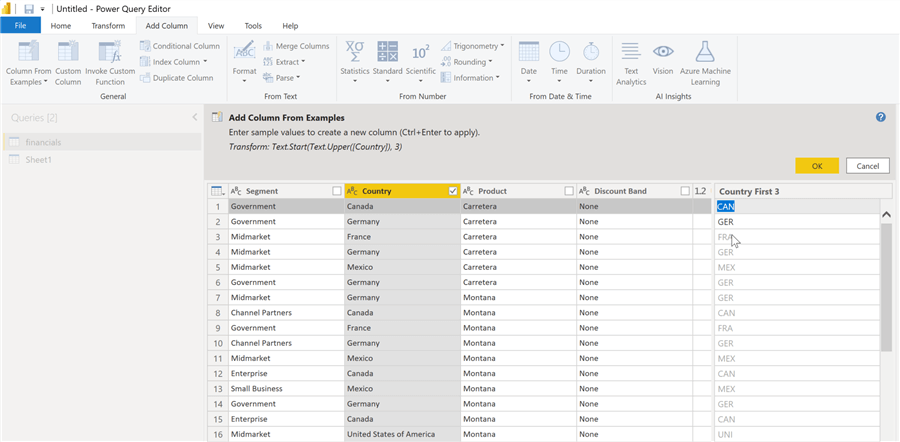
One of my favorite options is to use the Column from Example option.
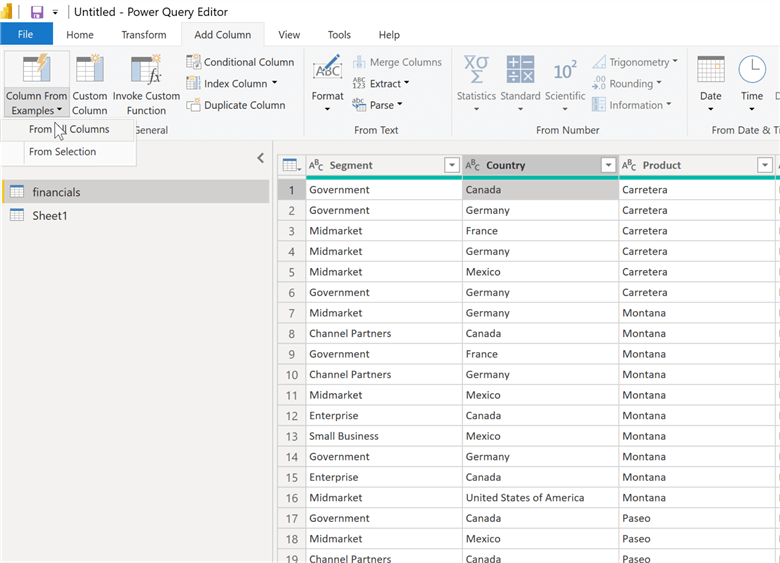
You can simply start typing what you want to appear in the column data.
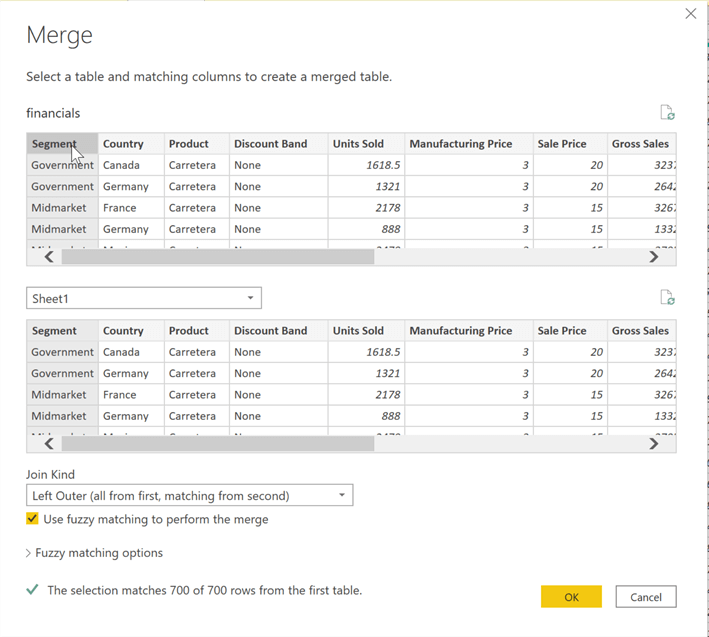
Of course, column transformations are just the beginning of the influence of Power BI Desktop. Another chief feature that can be utilized is merging and appending data sets. Therefore, two distinct but related data sets can be imported or loaded into Power BI and then merged together or appended together. Appending is like "adding" more rows to the bottom of a data set whereas merging is like a SQL join and generally adds columns to a data set (see this tip - Power BI Merge Queries and Append Queries).
As shown below, the merge functionality includes the ability to complete the matching or joining of the data based on one or multiple columns. Note, this relationship set up is different than establishing a relationship in the design grid where only one field / column can be joined together.
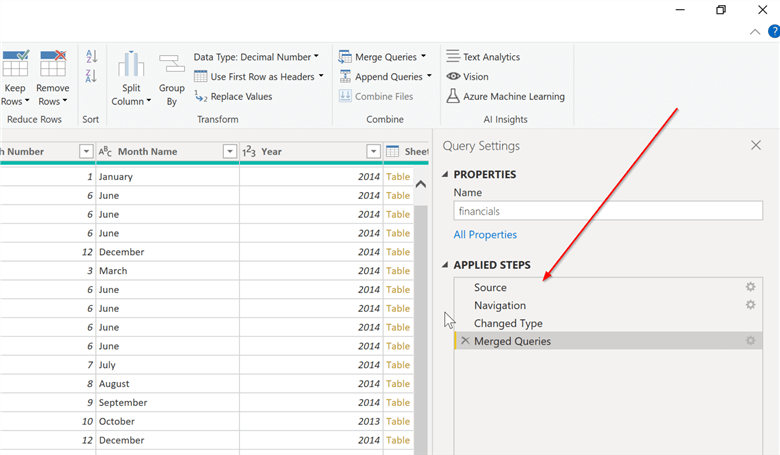
As these transformations, merges, appends, and other changes take place, Power BI records each step which can easily be re-ordered or deleted.
Furthermore, in addition to the basic steps shown above, Power BI also allows the detailed transformation steps to be reviewed. The details steps, as shown below, are recorded in the M language (also see these tips - Concatenate Strings in Power BI Using Power Query M Language & Text Extraction using the M Language with Power BI & Create Calendar Table Using Power Query M Language).
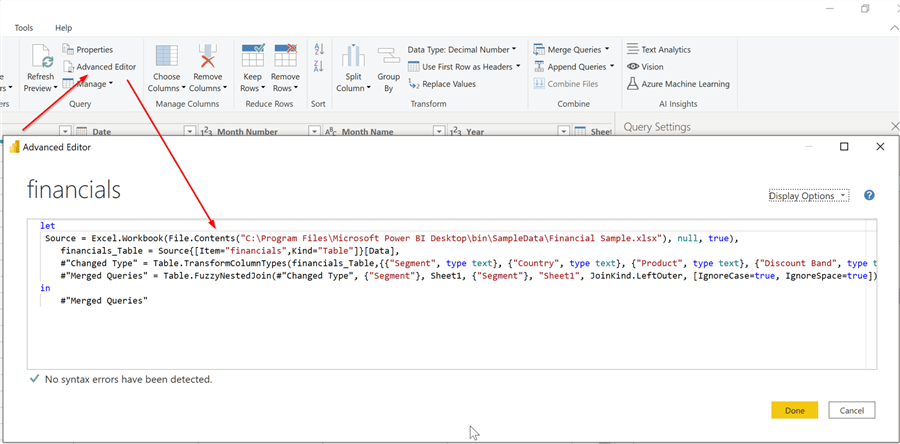
The M language allows for coding by hand which can be very helpful if you need to make many changes and you can just write the new lines manually (like you would in PowerShell or Bash for instance).
How Power BI Desktop Works
Up to this point in the tips, most the discussion has been on what Power BI is and what are some of the main or interesting features that are used in Power BI. Now we will move on to how Power BI Desktop works. Power BI Desktop is a separate tool from the online service and works differently from the Power BI Service. Additionally, it works differently from SQL Server Reporting Services (SSRS) which executes a report either on demand or on a subscription schedule. Power BI Desktop imports data into the file and does so in a way that automatically compresses the data in a format that reduces the data size.
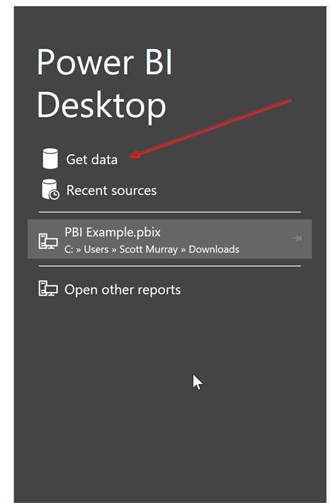
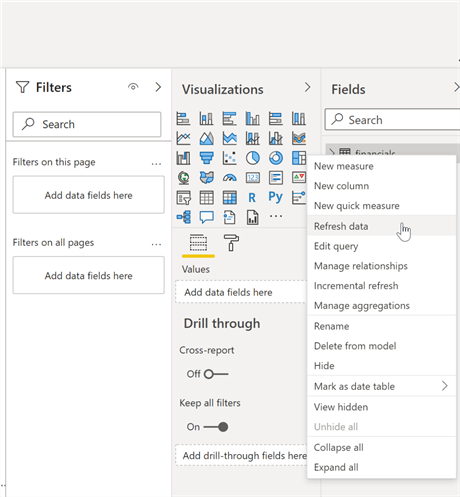
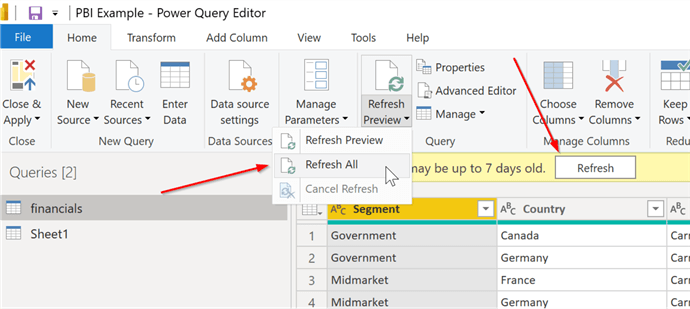
As shown above, the data import can occur in several different locations, either using the Get Data Option or using the Refresh options in the design grid or in the query editor. When the get data or refresh is initiated, the actual query will be executed against the data source. Additionally, when many transformation steps are executed, the query will often be executed as each step is added or changed. Additionally, during the initial execution, at times, the query could actually be executed twice, once to establish the schema, and then to actually retrieve the data (see Querying SQL Server Data with Power BI Desktop, Read API Data with Power BI using Power Query and Using Power BI with JSON Data Sources and Files).
Hopefully, you can see that you have to be careful about the execution of long running queries as they could impact the dashboard design process. It is often the best idea to limit, during initial development, the query results and query run time to prevent a designer from having to wait after each data refresh. On the flip side, you will also need to return enough data to properly be able to create the needed data transformations, filters, other steps, relationships, and merges.
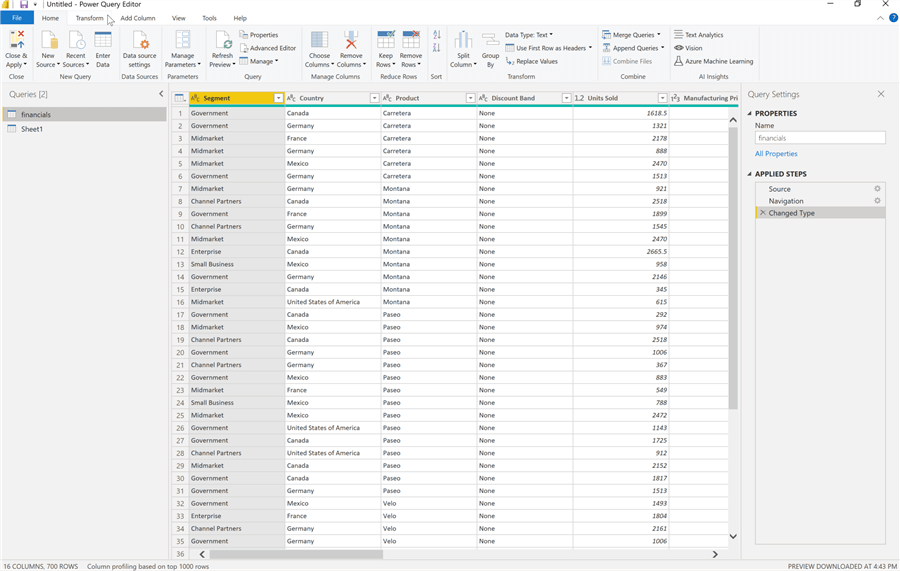
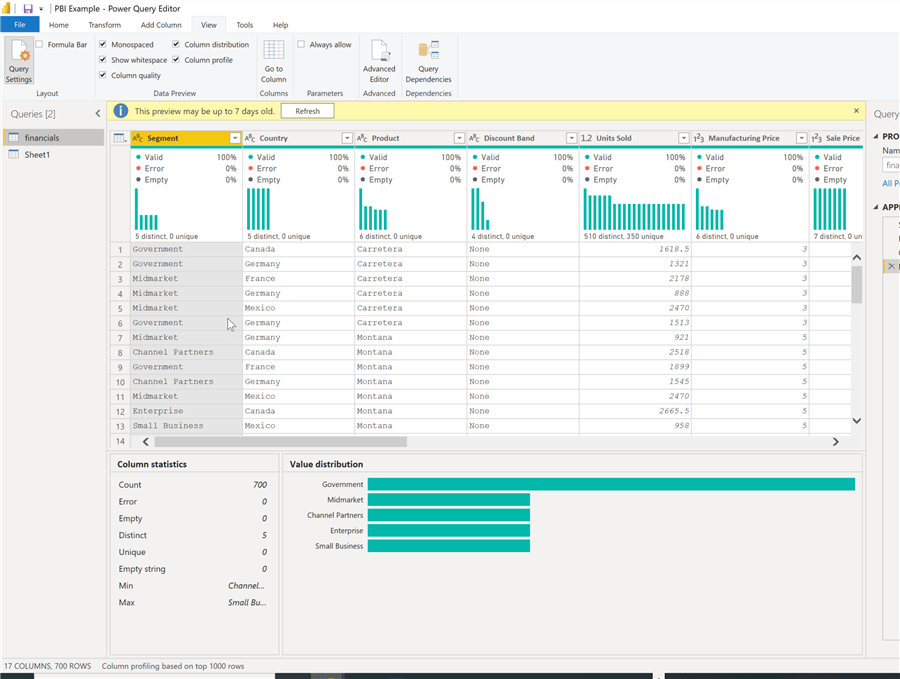
After working through the data load process, Power BI can also provide profile demographics about the data that was just loaded. Power BI samples the first 1,000 rows of data to discern various statistics such as null rows, error rows, unique values, empty strings, min and max values. This analysis can provide data exploration and data discovery points about the loaded data. However, if you have a significant number of columns, the processing of this data, could be sluggish.
Another feature about Power BI centers on the fact that Microsoft is using a monthly continuous improvement release cycle which means that new features and more importantly many bug fixes are pushed out on a frequent basis. Generally, updates are backward compatible; however, they are not normally forward compatible. This situation means that if someone sends you a Power BI pbix file that was created and/or modified in a later version, an older version of Power BI will be unable to open this file or execute certain features. Additionally, some release features are provided in "preview" mode which means that bugs may exist, or the feature may not be fully developed if in preview mode.
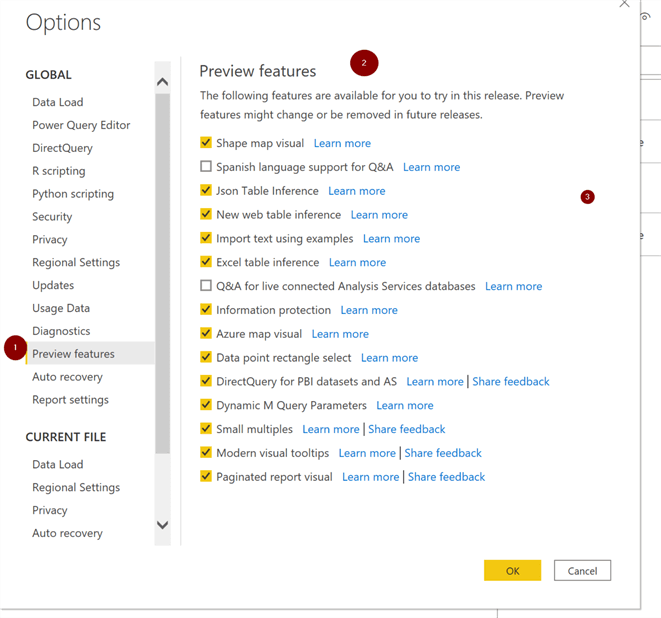
Often when these preview features are implemented, you will need to enable the preview feature in Power BI Desktop Options > Preview features. As shown subsequently, each desired preview feature will need to be enabled to begin using that particular feature. Also, care and research are needed to validate if the feature that is enabled in Power BI Desktop is enabled and will actually work in the Power BI Service. At times, features are only enabled in Desktop or in the Service and not in both (this feature started as a preview feature - Power BI Smart Narrative).
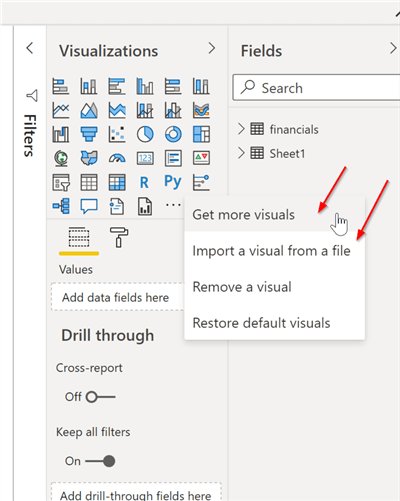
Probably one of the biggest front facing item within a PBIX file centers on the actual visuals used by the report designers. Power BI and specifically Power BI Desktop are designed to be interactive and reactive in nature. Thus, when multiple visuals are added to a design grid, they will automatically and contextually interact with each other based on the clicking of specific parts of the visual, for instance, clicking on a bar in a bar chart or selecting a data square on a tree map visual. Additionally, Microsoft offers a visualization store for Power BI. These visuals can be imported in file format, or they can be "retrieved" from the Microsoft App Store for Power BI visuals, as shown below. When Power BI Desktop uses an imported from file visual, the version used in the Power BI service may be different. Again, these items should be researched when using these imported visuals.
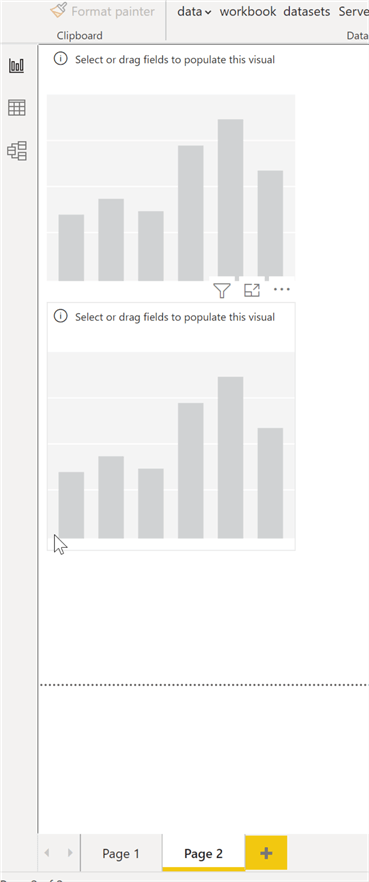
As more and more development occurs on the design grid, and the whole concept of visual and report design needs to be reviewed. Within Power BI Desktop, the creation of visuals requires them to be added to a page or tab. Of course, real estate is finite on any tab or page. Thus, the number of visuals is also limited. However additional tabs can be added to the PBIX file / report which give you an unlimited number of tabs. Here is where the whole concept of a dashboard gets fuzzy when comparing Power BI Desktop with the Power BI Service. That is because, once a PBIX file is published to the Power BI Service, individual visuals can be pinned to a dashboard. In essence, Power BI Desktop is just creating a report with tabs, and each tab can contain a number of visuals. A designer needs to think through this concept and setup to create the most appropriate layout.
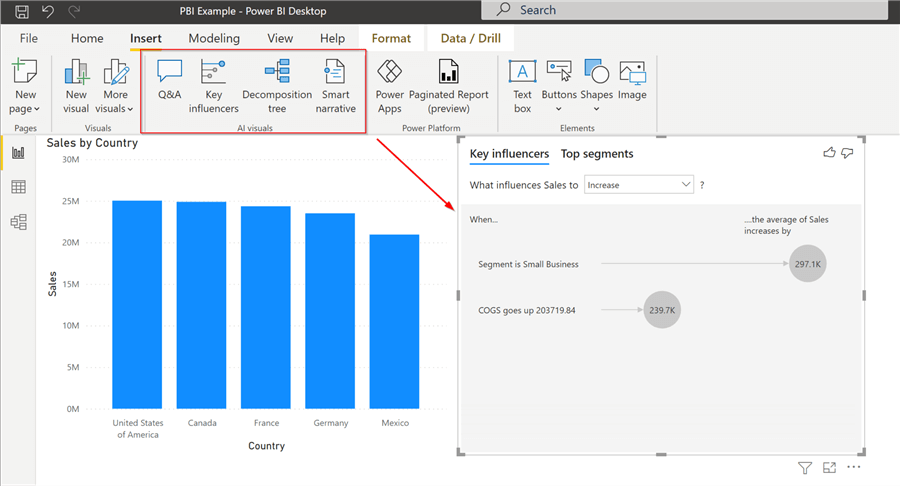
The final how surrounding Power BI desktop is its ability to add AI visuals to your desktop. Out of the box, Power BI Desktop provides four different visuals that can be used to automatically analyze your data sets. These items include: Q & A, Key Influencer, Decomposition Tree, and Smart Narrative.
Within this tip, we covered some of the basic "whats" and "hows" surrounding Power BI Desktop. Power BI Desktop is a different and distinct Windows application (sorry MAC users) and is not the same as the Power BI Service or the Power BI Report Builder. The application is free and can certainly make an excellent data exploration and discovery tool.
Next Steps
- Check out these resources:
Learn more about Power BI in this 3 hour training course.


About the author
 Scott Murray has a passion for crafting BI Solutions with SharePoint, SSAS, OLAP and SSRS.
This author pledges the content of this article is based on professional experience and not AI generated.
View all my tips
Article Last Updated: 2022-05-11
