By: Kenneth A. Omorodion | Updated: 2022-06-23 | Comments | Related: > Power BI Formatting
Problem
By default, a Power BI report page canvas orientation has a size of 16:9. This can become challenging when you need to include more visuals or details in a single report page. Power BI has a way to re-configure the canvas settings of the page to allow it to have an increased Portrait Orientation depending on your requirement so that you can more space to add your visuals. Let's look at how this can be done in Power BI Desktop.
Solution
I understand that most Power BI developers already know how to configure this easily, but from experience I can guarantee you that not everyone knows how to do this, particularly those new to Power BI. Hence, I have put in a detailed step-by-step to configure this in Power BI Desktop as follows.
To demonstrate this, lets first look at the two diagrams below and understand what we are trying to achieve.
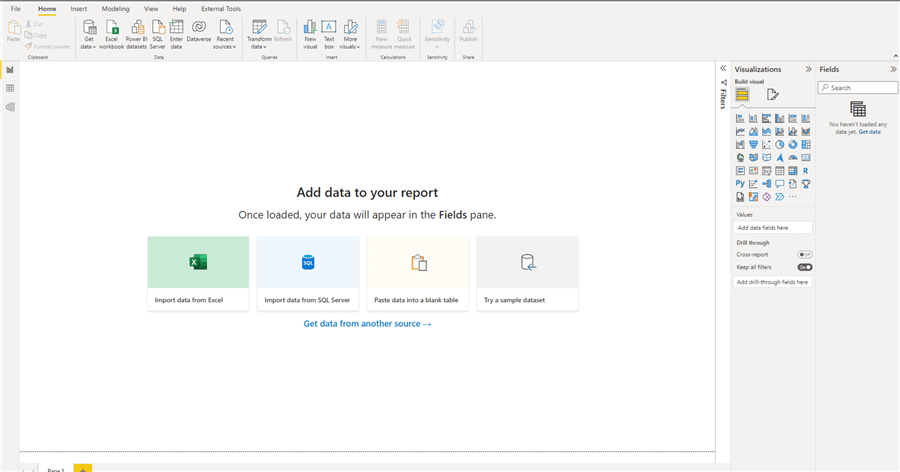
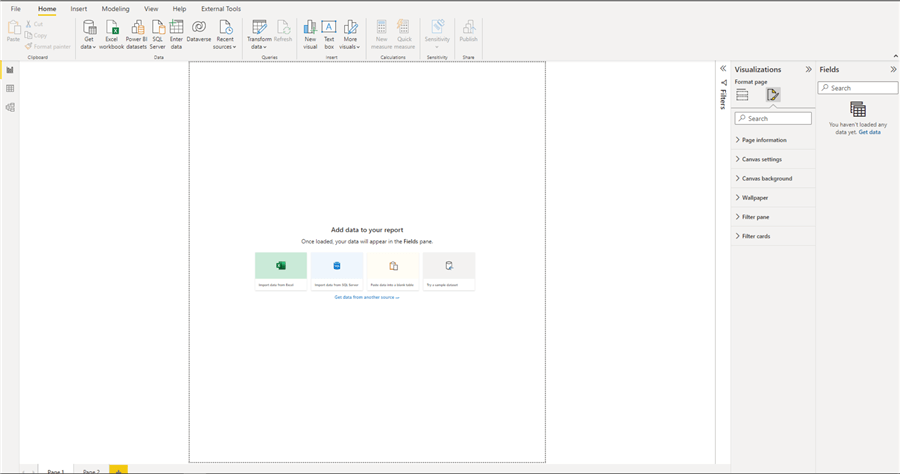
The diagram above shows the default page view of a Power BI Desktop report. The canvas size for this default view is 16:9. So you would be limited in how much information/visuals you can add on this page.
There are options to change this view, but in this article, we are just interested in increasing the vertical orientation to ensure there is more space for more visuals. The diagram below shows what we are trying to achieve.
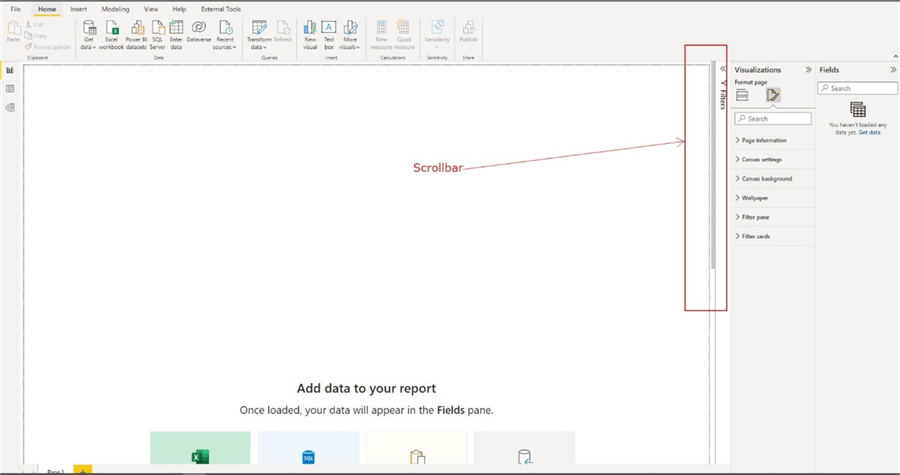
From the diagram above, you can now observe that on the right side of the page there is now a scroll bar to scroll to the bottom of the page vertically, thereby increasing the size of the page to allow for more visuals/information for this page.
So how was the increased portrait orientation achieved? Let's look at this step-by-step.
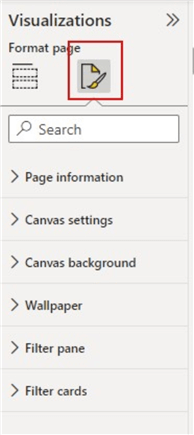
Step 1: Go to Format section within the Visualizations pane of the page as seen in the diagram below.
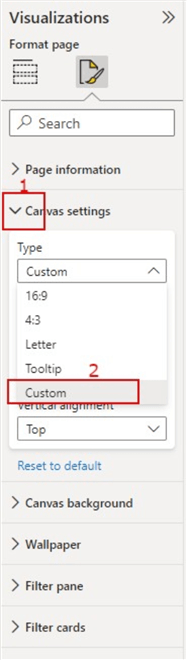
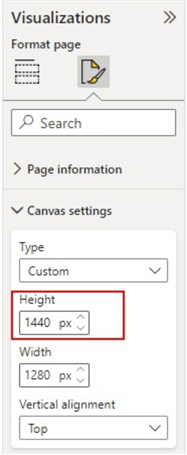
Step 2: Change the page canvas type to "Custom" as seen in diagram below.
Step 3: Change the default Canvas Settings height from 720 px to a desired height. In this demo I have just multiplied the default value of 720 px by 2, you can always increase or decrease accordingly. See diagram below.
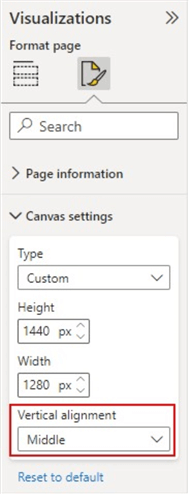
Step 4: Change the vertical alignment to "Middle". This just ensures the page is aligned to the middle of the page rather than to the top. This can be optional though. See diagram below.
Your page orientation should now look like the diagram below.
I can imagine someone saying that does not look like what we expect. Yes, you are right, there is still one more step left as detailed below.
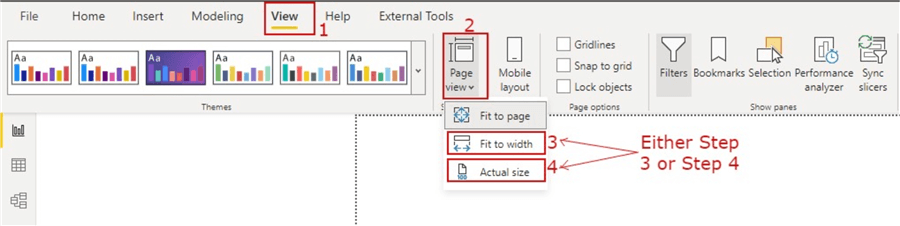
Step 5: Change the Page View to either "Actual Size" or "Fit to Width". To do this, navigate to the "View" tab on the Power BI Desktop ribbon, then click on the drop-down on the "Page View" and then select which one suits your requirement best. That's all! See diagram below on how to do this.
Summary and Considerations
Note that this only affects the current page you have configured it on, if you need to have extended page size on other pages you might need to either duplicate this current page or configure it separately on the other pages as required.
Next Steps
- Read more on applying page display settings in Power BI here.
- You would also get additional information from this blog from DataVeld.
- Try this tip out in your own data as business requires.
Learn more about Power BI in this 3 hour training course.


About the author
 Kenneth A. Omorodion is a Business Intelligence Developer with over eight years of experience. He holds both a bachelor’s and master’s degree (Middlesex University in London). Kenneth has the MCSA, Microsoft Data Analyst - Power BI and Azure Fundamentals certifications. Kenneth is a Microsoft Certified Trainer and has delivered corporate training on Power BI, SQL Server, Excel and SSRS.
This author pledges the content of this article is based on professional experience and not AI generated.
View all my tips
Article Last Updated: 2022-06-23
