By: Rick Dobson | Updated: 2023-05-24 | Comments | Related: > TSQL
Problem
I am a T-SQL developer recently assigned to a team of technical analysts. The team is responsible for computing key performance metrics via common descriptive statistics. Another key role for the team is integrating time series data with the key performance metrics. I seek T-SQL code samples for merging different types of descriptive statistics to time series data. I am particularly interested in subquery examples for implementing descriptive statistics and integrating different kinds of key performance metrics with a core data set.
Solution
Technical analysis is often used to track and visualize trends in stock market time series data, such as price changes across trading days for a company's stock shares. Quantitative methods are often used with technical analysis techniques to implement descriptive and inferential statistics.
One class of descriptive statistics is central tendency statistics for an attribute of an object. The object can be households in different geographic locales, sales offices for a company, or a company's stock. The attributes can be annual household income, sales dollars by sales office, or a company's stock price over successive trading days.
Wikipedia reports many kinds of statistics for computing an average value. This tip drills down on how to compute and compare three of these statistics via T-SQL. The three average statistics are the arithmetic mean, the geometric mean, and the median. Another key deliverable from this tip is a demonstration of how to use T-SQL to merge the three average statistics for complementary subsets of a dataset.
An Overview of Three Average Statistics
Perhaps the most common average statistic is the arithmetic average. This statistic is computed as the sum of a set of numbers divided by the count of the numbers in a set. Each number corresponds to the value of an object's attribute in a set. For example, the average close price for a stock in a year of trading days is the sum of the close price for each trading day in the year divided by the number of trading days in the year. Similarly, the average rainfall in a year is the total amount of rainfall in a year divided by the number of calendar days in a year.
Another widely used average statistic is the geometric average. The computation of a geometric average is the nth root of the product of a set of numbers. For example, if the set of numbers were comprised of two instances of 4, then their product equals 16. Also, the square root of 16 (sometimes called the second root of 16) equals 4.
The computation of a geometric average statistic is restricted to sets of non-negative numbers that contain no zero values in a set. It is also common to compute a geometric average as the sum of logarithm values divided by the count of the numbers in a set. The geometric average is the sum divided by the count raised to the base for the logarithm values in a set. The two most common bases for logarithms are 10 and e (2.71828…).
The third central tendency statistic examined in this tip is the median. The median statistic is based on a numerically ordered set of values. The median is computed in one of two complementary ways depending on whether the count of values is odd or even. If the count of values is odd, then the median is the value that separates the top half from the bottom half. If the count is even, then the median value is the arithmetic average of the pair of values that separates the top half from the bottom half.
For datasets with a disproportionately large or small set of values, the arithmetic average is not a central value. This is because the sum of the values will be disproportionately large or small depending on whether the dataset contains more large or more small numbers. In contrast, the median value will always evenly divide the top half from the bottom half. Wikipedia offers an algebraic verification that the geometric average will always be less than the arithmetic average when at least one of the numbers in a dataset is not equal to all the other non-zero, non-negative numbers in a dataset. Recall that the geometric mean is defined only for the non-zero, non-negative numbers in a dataset.
The Sample Data for this Tip
The source data for this tip was originally downloaded from Yahoo Finance and re-formatted for rapidly processing time series data in SQL Server. The steps for implementing the re-formatting are described in a pair of prior tips ("SQL Server Data Mining for Leveraged Versus Unleveraged ETFs as a Long-Term Investment" and "Adding a Buy-Sell Model to a Buy-and-Hold Model with T-SQL"). This tip excerpts selected columns and rows from the emas_for_model table in the prior tips.
As you can see in the from clause of the following code sample, the emas_for_model table resides in the dbo schema of the DataScience database. The following script lists the distinct ticker symbols in the emas_for_model table.
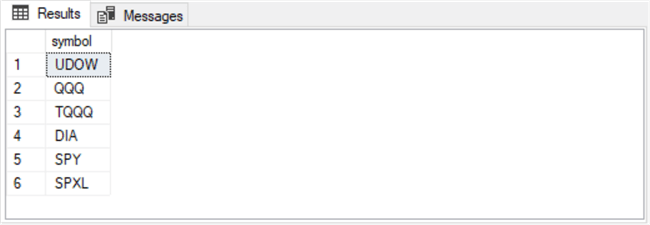
-- list the distinct ticker symbol values
-- from [DataScience].[dbo].[emas_for_model]
select distinct symbol
from [DataScience].[dbo].[emas_for_model]
The following screenshot displays the result set from the preceding script. As you can see, there are six distinct ticker symbol values in the source data. The UDOW, TQQQ, and SPXL ticker values are for leveraged tickers that provide three times the return of their underlying index on a daily basis. The QQQ, DIA, and SPY symbols denote unleveraged tickers that provide the same percentage return as their underlying index on a daily basis.
The next script displays the six ticker symbols along with the first and last trading dates collected from Yahoo Finance. The first date column is for the initial public offering date for a security. The last date column is for the final trading date for which data were collected in Yahoo Finance. The T-SQL built-in min and max functions simplify recovering, respectively, the first and last dates from a column of grouped date values.
-- first and last dates from [DataScience].[dbo].[emas_for_model]
select distinct symbol, min(date) [first date], max(date) [last date]
from [DataScience].[dbo].[emas_for_model]
group by symbol
Here is the output from the preceding script. The first column (symbol) is for distinct symbol values. The second column (first date) is for the initial public offering date for the ticker symbol on a row. Notice that date values for this column change from one row to the next because ticker symbols can be initially offered for sale on different dates. The third column (last date) has the same value for all tickers because the tickers for this data source are all available through the same end date (2022-11-30), which is the last date for which data were collected from Yahoo Finance.
![first and last dates from [DataScience].[dbo].[emas_for_model]](/tipimages2/7678_subqueries-for-averages-when-data-mining-t-sql.002.png)
The last code segment for this section is suitable for displaying the first and last ten rows in the original version of the emas_for_model table from the two prior tips referenced at the beginning of this section. The current tip only requires the first three columns (date, symbol, and close) from the results set.
- The symbol and date columns are identifier columns for the rows in the script's
results set
- The date column is the time series identifier
- The symbol column is a category identifier. There is one unique value for each of the six distinct ticker symbols in the emas_for_model table
- The third column of the tip's results set contains close price values for a ticker symbol on a trading day
- The other four columns (ema_10 through ema_200) are meant to help implement an AI model based on exponential moving averages with different period lengths. These last four columns are not needed for the current tip
- The next section illustrates how to populate the remaining columns after the first three columns with information for key performance metrics
-- list rows and columns from
-- [DataScience].[dbo].[emas_for_model]
select
[date]
,[symbol]
,[close]
,[ema_10]
,[ema_30]
,[ema_50]
,[ema_200]
from [DataScience].[dbo].[emas_for_model]
The next two screenshots show the first and last ten rows for the results set from the preceding script.
- The first screenshot for the first ten rows has null values for the ema_10 through ema_200 columns in the first row. These first-row columns are undefined by definition because emas require an immediately preceding row, and there is no immediately preceding row for the first row in a results set
- The second screenshot also has ten rows, but these are for the final ten rows for the results set from the preceding script
- The symbol column values are different for the first and last ten rows because the original results set is ordered by date and symbol; the order of rows is specified by a primary key constraint. These two sets of row excerpts are for two of the six distinct ticker values
![list rows and columns from [DataScience].[dbo].[emas_for_model]](/tipimages2/7678_subqueries-for-averages-when-data-mining-t-sql.003.png)
![list rows and columns from [DataScience].[dbo].[emas_for_model]](/tipimages2/7678_subqueries-for-averages-when-data-mining-t-sql.004.png)
Computing Arithmetic Average, Geometric Average, and Median Values for a Subset of a Dataset
This section demonstrates an approach for computing arithmetic average, geometric average, and median metrics for a subset of the values in a dataset. Each of the three measures of central tendency has its values added to selected columns from the underlying dataset, such as the emas_for_model table in this tip. These measures of central tendency denote three different key performance metrics.
The approach this section demonstrates depends on a stored procedure named compute_overall_median and a pair of T-SQL scripts. The stored procedure was initially described in a tip called "T-SQL Starter Statistics Package for SQL Server." Therefore, this section merely reviews the steps for invoking the stored procedure as well as a step for returning the median value from a column of values from a global temp table named ##table_for_overall_median (see this "Local vs Global SQL Server Temporary Tables" if you want to learn more about global temp tables).
- The first T-SQL script for computing arithmetic average, geometric average, and median values and merging them with a subset of the source data to return a results set with a row of identifier values as well as the computed central tendency values. The identifier column values designate the dataset subset for which the central tendency measures are computed
- The second script generates results for a unit test that can validate the stored procedure for computing a median value
Here is a sample script for creating a fresh copy of the compute_overall_median stored procedure.
- The use statement designates the name of the database into which you are installing the stored procedure
- The drop procedure statement removes any prior version of the stored procedure from the database
- The create procedure statement creates a fresh copy of the stored procedure in the database
- The nested select statement named for_median is a subquery that extracts values from the ##table_for_overall_median global temp table
-- create a fresh copy of the dbo.compute_overall_median stored procedure
use DataScience

drop procedure if exists dbo.compute_overall_median;

go
create procedure dbo.compute_overall_median
as
begin
   set nocount on;

   -- distinct in select statement shows just one overall median row value
   select
      distinct percentile_cont(.5)
         within group (order by column_for_median)
         over(partition by category_value) median_gc_dc_change
   from
   (
      select
          *
         ,'overall' category_value
      from ##table_for_overall_median
   ) for_median

   return

end
The T-SQL script for computing and displaying the arithmetic average, geometric average, and median values appear next.
- The first part above the line of comment markers (--) designates a subset of values to compute and display central tendency measures. This part also populates the ##table_for_overall_median global temp table
- The second part computes and displays the central tendency measures
Within the first part, the three local variables named @ticker, @start_date, and @end_date are declared and populated to designate a subset of rows from the original data source for this tip (the emas_for_model table). A subquery within an outer query specifies criterion values for the symbol and date column values in the emas_for_model table. The subquery also returns three columns named date, close, and nat log of close. The last column is an input to the outer query's results set. This column eventually becomes an input to the expression for computing a geometric average in the second part of the T-SQL script.
The outer query in the first part of the T-SQL script populates the ##table_for_overall_median global temp table.
The second part of the script begins by invoking the compute_overall_median stored procedure.
- The exec statement invokes the stored procedure
- The insert statement preceding the exec statement populates the @tmptable table variable
- The declare statement preceding the insert statement declares a table variable named @tmptable
The second code block in the second part of the script relies on another outer query with a corresponding subquery.
- The subquery extracts rows from the emas_for_model table rows with ticker
values matching @ticker as well as
- date values greater than or equal to @start_date and
- date values less than or equal to @end_date
- The outer query specifies seven columns for display
- @ticker, @start_date, and @end_date are identifier column values
- count is a value for the number of rows designated by the subquery, which is 230 in this code example
- arithmetic mean, geometric mean, and median are for three computed central
tendency values for the subset of rows designated in the subquery
- the arithmetic mean is computed with the T-SQL avg function for the close values
- the geometric mean is computed as the exp function for the average of nat log of close values
- the median is computed as the return value (@tmpTable) from the compute_overall_median stored procedure
-- start of script to
-- compute an arithmetic mean, a geometric mean and a median
-- for a ticker from a start date through an end date

go
declare
 @ticker nvarchar(10)
,@start_date date
,@end_date date

set @ticker = 'UDOW'
set @start_date = '2022-01-01'
set @end_date = '2022-11-30'

-- populate a fresh copy of ##table_for_overall_median
-- global temp table
-- from [DataScience].[dbo].[emas_for_model]
-- for local @ticker, @start_date, @end_date local variable settings
drop table if exists ##table_for_overall_median

select
 @ticker [ticker]
,[date]
,[close] [column_for_median]
into ##table_for_overall_median
from
(
-- select for ticker from start through end dates
select date, [close], log([close]) [nat log of close]
from [DataScience].[dbo].[emas_for_model]
where
 symbol = @ticker and
 date >= @start_date and
 date <=@end_date
) closes_and_nat_logs

-----------------------------------------------------------------------------

-- invoke compute_overall_median stored procedure
-- display median as median_value from @tmpTable
declare @tmpTable table (median_value float)
insert into @tmpTable
exec dbo.compute_overall_median

-- display results set from
select
 @ticker [ticker]
,@start_date [start_date]
,@end_date [end_date]
,count(*) [count]
,avg([close]) [arithmetic mean]
,exp(sum([nat log of close])/count(*)) [geometric mean]
,(select * from @tmpTable) [median]
from
(
-- select for ticker from start through end dates
select date, [close], log([close]) [nat log of close]
from [DataScience].[dbo].[emas_for_model]
where
 symbol = @ticker and
 date >= @start_date and
 date <=@end_date
) closes_and_nat_logs
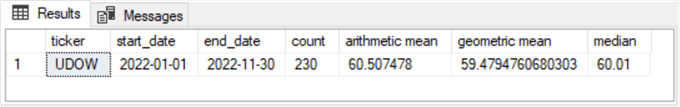
The following screenshot shows the results set from the preceding script.
- The first three columns are identifier values for the subset of rows for which the central tendency metric values are computed
- The count column is a count of rows with identifier values; this column is not strictly required. Nevertheless, you may find the count column value helpful for validating the central tendency metric computations manually
- The last three columns are numeric values for the three central tendency
measures
- The arithmetic mean is merely the avg value of the close values; avg is a built-in T-SQL function
- The geometric mean is merely the exponential function of the average nat log of close values
- The @tmpTable value is the return value from the compute_overall_median stored procedure
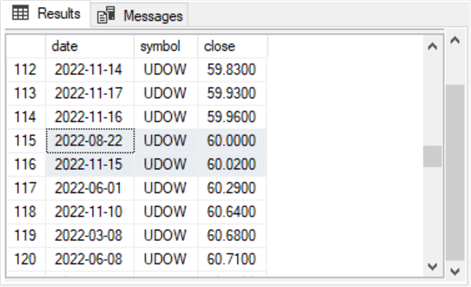
A script for a unit test appears in the following code window; this is the second script. The results set from the second script shows the unit test outcome. This second script is meant to run in the same code batch as the preceding script, so the @ticker local variable is set based on the set statement in the preceding script.
- The second script extracts all the rows with a symbol column value matching the @ticker local variable and a year function value of the date column from the emas_for_model table matching 2022
- It is essential to include the order by clause for the last statement in the script
- Because there are 230 rows in the source data specified by the from close
and where close, the median is the arithmetic average of the close values on
rows 115 and 116
- Every close value at or below the one on row 115 is for the top half of the dataset
- Every close value at or above the one on row 116 is for the bottom half of the dataset
-- list rows with date in 2022
-- used for validating median computation
-- it is essential to use the order by clause
select
 [date]
,[symbol]
,[close]
from [DataScience].[dbo].[emas_for_model]
where
 symbol = @ticker and year(date) = 2022
order by [close]
Here is the output from rows 115 and 116 in the results set from the preceding script. Notice that close values for rows 115 and 116 are 60.0000 and 60.0200. These two values have an arithmetic average of 60.01. This is the median value from the preceding screenshot.
Computing Arithmetic Average, Geometric Average, and Median Values from Multiple Dataset Subsets
The preceding section introduces T-SQL basics for computing three central tendency indicators. Each of the central tendency indicator values is for a single dataset based on a ticker symbol, a start date, and an end date. In some analytical applications, you are likely to want the central tendency indicator values for multiple datasets so that you readily compare the central tendency indicator values across datasets. This section refines and extends the code from the previous section to facilitate the achievement of this objective.
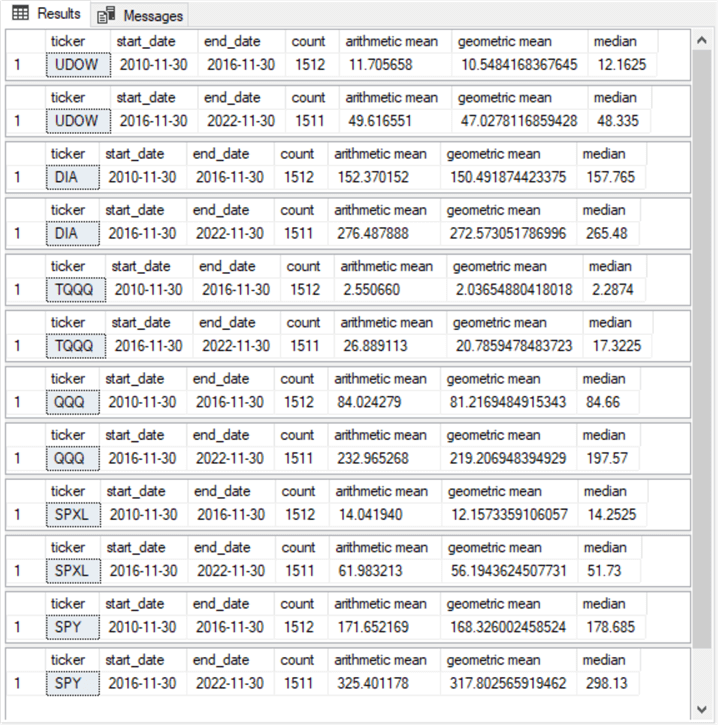
Here is a screenshot that illustrates the new approach for six pairs of datasets. The six pairs of datasets are for the UDOW, DIA, TQQQ, QQQ, SPXL, and SPY ticker symbols. Within each pair, there are distinct start and end date values for each pair member. In the example for this section, the first member of each pair extends from 2010-11-30 through 2016-11-30, and the second member of each pair extends from 2016-11-30 through 2022-11-30.
Aside from the identifier column values of ticker, start_date, and end_date in the first three columns, the last three columns reveal the arithmetic mean, the geometric mean, and the median value. In between the identifier column values and the three central tendency indicator column values, there is a column of count values. The count column displays the number of trading days for the first and second members of each pair of rows for a ticker.
Here is a script window with the T-SQL script for generating the preceding results set. There are three main type parts to the script.
- The first part type creates a fresh copy of the compute_overall_median stored procedure in the current database. This part also creates a fresh copy of the ##table_for_overall_median global temp table.
- The first part type occurs just once in the script, but the second and third part types recur for each ticker symbol in the underlying dataset for the script (the emas_for_model table). If you prefer, you can revise the code to shorten the script by using a while loop to iterate through a set of ticker symbols.
- The initial second part type commences immediately after the paired set of comment marker lines (--) trailing the first part type. This part type designates a ticker symbol value of UDOW, a start date of 2010-11-30, and an end date of 2016-11-30.
- The initial third part type appears after the single line of comment markers trailing the initial second part type. For the initial third part type, the ticker value is UDOW with a start date of 2016-11-30 and an end date of 2022-11-30.
- Here are the ticker symbol, start date, and end date for the remaining five
pairs of part types
- Ticker (DIA), start date (2010-11-30), and end date (2016-11-30)
- Ticker (DIA), start date (2016-11-30), and end date (2022-11-30)
- Ticker (TQQQ), start date (2010-11-30), and end date (2016-11-30)
- Ticker (TQQQ), start date (2016-11-30), and end date (2022-11-30)
- Ticker (QQQ), start date (2010-11-30), and end date (2016-11-30)
- Ticker (QQQ), start date (2016-11-30), and end date (2022-11-30)
- Ticker (SPXL), start date (2010-11-30), and end date (2016-11-30)
- Ticker (SPXL), start date (2016-11-30), and end date (2022-11-30)
- Ticker (SPY), start date (2010-11-30), and end date (2016-11-30)
- Ticker (SPY), start date (2016-11-30), and end date (2022-11-30)
use DataScience
go

-- create a fresh copy of the dbo.compute_overall_median stored procedure
-- and the ##table_for_overall_median global temp table
-- also drop any prior version of ##table_for_overall_median, which is referenced
-- in the dbo.compute_overall_median

drop procedure if exists dbo.compute_overall_median;
drop table if exists ##table_for_overall_median;

go
create procedure dbo.compute_overall_median
as
begin
   set nocount on;

   -- distinct in select statement shows just one overall median row value
   select
      distinct percentile_cont(.5)
         within group (order by column_for_median)
         over(partition by category_value) median_gc_dc_change
   from
   (
      select
          *
         ,'overall' category_value
      from ##table_for_overall_median
   ) for_median

   return

end
go

---------------------------------------------------------------------------
---------------------------------------------------------------------------

use DataScience
go  -- to start a fresh batch for local variable assignments

-- create and drop procedure any prior version of ##table_for_overall_median,
-- which is referenced in the dbo.compute_overall_median stored procedure

-- this script assumes a fresh version of the dbo.compute_overall_median
-- stored procedure was previously created in the DataScience database


drop table if exists ##table_for_overall_median

-- start of script to
-- compute an arithmetic mean, a geometric mean and a median
-- for a ticker from a start date through an end date

declare
 @ticker nvarchar(10)
,@start_date date
,@end_date date

set @ticker = 'UDOW'
set @start_date = '2010-11-30'
set @end_date = '2016-11-30'

-- populate ##table_for_overall_median
-- from [DataScience].[dbo].[emas_for_model]
-- for local @ticker, @start_date, @end_date local variable settings
select
 @ticker [ticker]
,[date]
,[close] [column_for_median]
into ##table_for_overall_median
from
(
-- select for ticker from start through end dates
select date, [close], log([close]) [nat log of close]
from [DataScience].[dbo].[emas_for_model]
where
 symbol = @ticker and
 date >= @start_date and
 date <=@end_date
) closes_and_nat_logs


-- invoke compute_overall_median stored procedure
-- display median as median_value from @tmpTable
declare @tmpTable table (median_value float)
insert into @tmpTable
exec dbo.compute_overall_median


-- display results set from
select
 @ticker [ticker]
,@start_date [start_date]
,@end_date [end_date]
,count(*) [count]
,avg([close]) [arithmetic mean]
,exp(sum([nat log of close])/count(*)) [geometric mean]
,(select * from @tmpTable) [median]
from
(
-- select for ticker from start through end dates
select date, [close], log([close]) [nat log of close]
from [DataScience].[dbo].[emas_for_model]
where
 symbol = @ticker and
 date >= @start_date and
 date <=@end_date
) closes_and_nat_logs


---------------------------------------------------------------------------
use DataScience
go  -- to start a fresh batch for local variable assignments

-- create and drop procedure any prior version of ##table_for_overall_median,
-- which is referenced in the dbo.compute_overall_median stored procedure

-- this script assumes a fresh version of the dbo.compute_overall_median
-- stored procedure was previously created in the DataScience database


drop table if exists ##table_for_overall_median


-- start of script to
-- compute an arithmetic mean, a geometric mean and a median
-- for a ticker from a start date through an end date

declare
 @ticker nvarchar(10)
,@start_date date
,@end_date date

set @ticker = 'UDOW'
set @start_date = '2016-11-30'
set @end_date = '2022-11-30'

-- populate ##table_for_overall_median
-- from [DataScience].[dbo].[emas_for_model]
-- for local @ticker, @start_date, @end_date local variable settings
select
 @ticker [ticker]
,[date]
,[close] [column_for_median]
into ##table_for_overall_median
from
(
-- select for ticker from start through end dates
select date, [close], log([close]) [nat log of close]
from [DataScience].[dbo].[emas_for_model]
where
 symbol = @ticker and
 date >= @start_date and
 date <=@end_date
) closes_and_nat_logs


-- invoke compute_overall_median stored procedure
-- display median as median_value from @tmpTable
declare @tmpTable table (median_value float)
insert into @tmpTable
exec dbo.compute_overall_median


-- display results set from
select
 @ticker [ticker]
,@start_date [start_date]
,@end_date [end_date]
,count(*) [count]
,avg([close]) [arithmetic mean]
,exp(sum([nat log of close])/count(*)) [geometric mean]
,(select * from @tmpTable) [median]
from
(
-- select for ticker from start through end dates
select date, [close], log([close]) [nat log of close]
from [DataScience].[dbo].[emas_for_model]
where
 symbol = @ticker and
 date >= @start_date and
 date <=@end_date
) closes_and_nat_logs

---------------------------------------------------------------------------
---------------------------------------------------------------------------

use DataScience
go  -- to start a fresh batch for local variable assignments

-- create and drop procedure any prior version of ##table_for_overall_median,
-- which is referenced in the dbo.compute_overall_median stored procedure

-- this script assumes a fresh version of the dbo.compute_overall_median
-- stored procedure was previously created in the DataScience database


drop table if exists ##table_for_overall_median

-- start of script to
-- compute an arithmetic mean, a geometric mean and a median
-- for a ticker from a start date through an end date

declare
 @ticker nvarchar(10)
,@start_date date
,@end_date date

set @ticker = 'DIA'
set @start_date = '2010-11-30'
set @end_date = '2016-11-30'

-- populate ##table_for_overall_median
-- from [DataScience].[dbo].[emas_for_model]
-- for local @ticker, @start_date, @end_date local variable settings
select
 @ticker [ticker]
,[date]
,[close] [column_for_median]
into ##table_for_overall_median
from
(
-- select for ticker from start through end dates
select date, [close], log([close]) [nat log of close]
from [DataScience].[dbo].[emas_for_model]
where
 symbol = @ticker and
 date >= @start_date and
 date <=@end_date
) closes_and_nat_logs


-- invoke compute_overall_median stored procedure
-- display median as median_value from @tmpTable
declare @tmpTable table (median_value float)
insert into @tmpTable
exec dbo.compute_overall_median


-- display results set from
select
 @ticker [ticker]
,@start_date [start_date]
,@end_date [end_date]
,count(*) [count]
,avg([close]) [arithmetic mean]
,exp(sum([nat log of close])/count(*)) [geometric mean]
,(select * from @tmpTable) [median]
from
(
-- select for ticker from start through end dates
select date, [close], log([close]) [nat log of close]
from [DataScience].[dbo].[emas_for_model]
where
 symbol = @ticker and
 date >= @start_date and
 date <=@end_date
) closes_and_nat_logs


---------------------------------------------------------------------------
use DataScience
go  -- to start a fresh batch for local variable assignments

-- create and drop procedure any prior version of ##table_for_overall_median,
-- which is referenced in the dbo.compute_overall_median stored procedure

-- this script assumes a fresh version of the dbo.compute_overall_median
-- stored procedure was previously created in the DataScience database


drop table if exists ##table_for_overall_median


-- start of script to
-- compute an arithmetic mean, a geometric mean and a median
-- for a ticker from a start date through an end date

declare
 @ticker nvarchar(10)
,@start_date date
,@end_date date

set @ticker = 'DIA'
set @start_date = '2016-11-30'
set @end_date = '2022-11-30'

-- populate ##table_for_overall_median
-- from [DataScience].[dbo].[emas_for_model]
-- for local @ticker, @start_date, @end_date local variable settings
select
 @ticker [ticker]
,[date]
,[close] [column_for_median]
into ##table_for_overall_median
from
(
-- select for ticker from start through end dates
select date, [close], log([close]) [nat log of close]
from [DataScience].[dbo].[emas_for_model]
where
 symbol = @ticker and
 date >= @start_date and
 date <=@end_date
) closes_and_nat_logs


-- invoke compute_overall_median stored procedure
-- display median as median_value from @tmpTable
declare @tmpTable table (median_value float)
insert into @tmpTable
exec dbo.compute_overall_median


-- display results set from
select
 @ticker [ticker]
,@start_date [start_date]
,@end_date [end_date]
,count(*) [count]
,avg([close]) [arithmetic mean]
,exp(sum([nat log of close])/count(*)) [geometric mean]
,(select * from @tmpTable) [median]
from
(
-- select for ticker from start through end dates
select date, [close], log([close]) [nat log of close]
from [DataScience].[dbo].[emas_for_model]
where
 symbol = @ticker and
 date >= @start_date and
 date <=@end_date
) closes_and_nat_logs

---------------------------------------------------------------------------
---------------------------------------------------------------------------

use DataScience
go  -- to start a fresh batch for local variable assignments

-- create and drop procedure any prior version of ##table_for_overall_median,
-- which is referenced in the dbo.compute_overall_median stored procedure

-- this script assumes a fresh version of the dbo.compute_overall_median
-- stored procedure was previously created in the DataScience database


drop table if exists ##table_for_overall_median

-- start of script to
-- compute an arithmetic mean, a geometric mean and a median
-- for a ticker from a start date through an end date

declare
 @ticker nvarchar(10)
,@start_date date
,@end_date date

set @ticker = 'TQQQ'
set @start_date = '2010-11-30'
set @end_date = '2016-11-30'

-- populate ##table_for_overall_median
-- from [DataScience].[dbo].[emas_for_model]
-- for local @ticker, @start_date, @end_date local variable settings
select
 @ticker [ticker]
,[date]
,[close] [column_for_median]
into ##table_for_overall_median
from
(
-- select for ticker from start through end dates
select date, [close], log([close]) [nat log of close]
from [DataScience].[dbo].[emas_for_model]
where
 symbol = @ticker and
 date >= @start_date and
 date <=@end_date
) closes_and_nat_logs


-- invoke compute_overall_median stored procedure
-- display median as median_value from @tmpTable
declare @tmpTable table (median_value float)
insert into @tmpTable
exec dbo.compute_overall_median


-- display results set from
select
 @ticker [ticker]
,@start_date [start_date]
,@end_date [end_date]
,count(*) [count]
,avg([close]) [arithmetic mean]
,exp(sum([nat log of close])/count(*)) [geometric mean]
,(select * from @tmpTable) [median]
from
(
-- select for ticker from start through end dates
select date, [close], log([close]) [nat log of close]
from [DataScience].[dbo].[emas_for_model]
where
 symbol = @ticker and
 date >= @start_date and
 date <=@end_date
) closes_and_nat_logs


---------------------------------------------------------------------------
use DataScience
go  -- to start a fresh batch for local variable assignments

-- create and drop procedure any prior version of ##table_for_overall_median,
-- which is referenced in the dbo.compute_overall_median stored procedure

-- this script assumes a fresh version of the dbo.compute_overall_median
-- stored procedure was previously created in the DataScience database


drop table if exists ##table_for_overall_median


-- start of script to
-- compute an arithmetic mean, a geometric mean and a median
-- for a ticker from a start date through an end date

declare
 @ticker nvarchar(10)
,@start_date date
,@end_date date

set @ticker = 'TQQQ'
set @start_date = '2016-11-30'
set @end_date = '2022-11-30'

-- populate ##table_for_overall_median
-- from [DataScience].[dbo].[emas_for_model]
-- for local @ticker, @start_date, @end_date local variable settings
select
 @ticker [ticker]
,[date]
,[close] [column_for_median]
into ##table_for_overall_median
from
(
-- select for ticker from start through end dates
select date, [close], log([close]) [nat log of close]
from [DataScience].[dbo].[emas_for_model]
where
 symbol = @ticker and
 date >= @start_date and
 date <=@end_date
) closes_and_nat_logs


-- invoke compute_overall_median stored procedure
-- display median as median_value from @tmpTable
declare @tmpTable table (median_value float)
insert into @tmpTable
exec dbo.compute_overall_median


-- display results set from
select
 @ticker [ticker]
,@start_date [start_date]
,@end_date [end_date]
,count(*) [count]
,avg([close]) [arithmetic mean]
,exp(sum([nat log of close])/count(*)) [geometric mean]
,(select * from @tmpTable) [median]
from
(
-- select for ticker from start through end dates
select date, [close], log([close]) [nat log of close]
from [DataScience].[dbo].[emas_for_model]
where
 symbol = @ticker and
 date >= @start_date and
 date <=@end_date
) closes_and_nat_logs

---------------------------------------------------------------------------
---------------------------------------------------------------------------

use DataScience
go  -- to start a fresh batch for local variable assignments

-- create and drop procedure any prior version of ##table_for_overall_median,
-- which is referenced in the dbo.compute_overall_median stored procedure

-- this script assumes a fresh version of the dbo.compute_overall_median
-- stored procedure was previously created in the DataScience database


drop table if exists ##table_for_overall_median

-- start of script to
-- compute an arithmetic mean, a geometric mean and a median
-- for a ticker from a start date through an end date

declare
 @ticker nvarchar(10)
,@start_date date
,@end_date date

set @ticker = 'QQQ'
set @start_date = '2010-11-30'
set @end_date = '2016-11-30'

-- populate ##table_for_overall_median
-- from [DataScience].[dbo].[emas_for_model]
-- for local @ticker, @start_date, @end_date local variable settings
select
 @ticker [ticker]
,[date]
,[close] [column_for_median]
into ##table_for_overall_median
from
(
-- select for ticker from start through end dates
select date, [close], log([close]) [nat log of close]
from [DataScience].[dbo].[emas_for_model]
where
 symbol = @ticker and
 date >= @start_date and
 date <=@end_date
) closes_and_nat_logs


-- invoke compute_overall_median stored procedure
-- display median as median_value from @tmpTable
declare @tmpTable table (median_value float)
insert into @tmpTable
exec dbo.compute_overall_median


-- display results set from
select
 @ticker [ticker]
,@start_date [start_date]
,@end_date [end_date]
,count(*) [count]
,avg([close]) [arithmetic mean]
,exp(sum([nat log of close])/count(*)) [geometric mean]
,(select * from @tmpTable) [median]
from
(
-- select for ticker from start through end dates
select date, [close], log([close]) [nat log of close]
from [DataScience].[dbo].[emas_for_model]
where
 symbol = @ticker and
 date >= @start_date and
 date <=@end_date
) closes_and_nat_logs


---------------------------------------------------------------------------
use DataScience
go  -- to start a fresh batch for local variable assignments

-- create and drop procedure any prior version of ##table_for_overall_median,
-- which is referenced in the dbo.compute_overall_median stored procedure

-- this script assumes a fresh version of the dbo.compute_overall_median
-- stored procedure was previously created in the DataScience database


drop table if exists ##table_for_overall_median


-- start of script to
-- compute an arithmetic mean, a geometric mean and a median
-- for a ticker from a start date through an end date

declare
 @ticker nvarchar(10)
,@start_date date
,@end_date date

set @ticker = 'QQQ'
set @start_date = '2016-11-30'
set @end_date = '2022-11-30'

-- populate ##table_for_overall_median
-- from [DataScience].[dbo].[emas_for_model]
-- for local @ticker, @start_date, @end_date local variable settings
select
 @ticker [ticker]
,[date]
,[close] [column_for_median]
into ##table_for_overall_median
from
(
-- select for ticker from start through end dates
select date, [close], log([close]) [nat log of close]
from [DataScience].[dbo].[emas_for_model]
where
 symbol = @ticker and
 date >= @start_date and
 date <=@end_date
) closes_and_nat_logs


-- invoke compute_overall_median stored procedure
-- display median as median_value from @tmpTable
declare @tmpTable table (median_value float)
insert into @tmpTable
exec dbo.compute_overall_median


-- display results set from
select
 @ticker [ticker]
,@start_date [start_date]
,@end_date [end_date]
,count(*) [count]
,avg([close]) [arithmetic mean]
,exp(sum([nat log of close])/count(*)) [geometric mean]
,(select * from @tmpTable) [median]
from
(
-- select for ticker from start through end dates
select date, [close], log([close]) [nat log of close]
from [DataScience].[dbo].[emas_for_model]
where
 symbol = @ticker and
 date >= @start_date and
 date <=@end_date
) closes_and_nat_logs

---------------------------------------------------------------------------
---------------------------------------------------------------------------

use DataScience
go  -- to start a fresh batch for local variable assignments

-- create and drop procedure any prior version of ##table_for_overall_median,
-- which is referenced in the dbo.compute_overall_median stored procedure

-- this script assumes a fresh version of the dbo.compute_overall_median
-- stored procedure was previously created in the DataScience database


drop table if exists ##table_for_overall_median

-- start of script to
-- compute an arithmetic mean, a geometric mean and a median
-- for a ticker from a start date through an end date

declare
 @ticker nvarchar(10)
,@start_date date
,@end_date date

set @ticker = 'SPXL'
set @start_date = '2010-11-30'
set @end_date = '2016-11-30'

-- populate ##table_for_overall_median
-- from [DataScience].[dbo].[emas_for_model]
-- for local @ticker, @start_date, @end_date local variable settings
select
 @ticker [ticker]
,[date]
,[close] [column_for_median]
into ##table_for_overall_median
from
(
-- select for ticker from start through end dates
select date, [close], log([close]) [nat log of close]
from [DataScience].[dbo].[emas_for_model]
where
 symbol = @ticker and
 date >= @start_date and
 date <=@end_date
) closes_and_nat_logs


-- invoke compute_overall_median stored procedure
-- display median as median_value from @tmpTable
declare @tmpTable table (median_value float)
insert into @tmpTable
exec dbo.compute_overall_median


-- display results set from
select
 @ticker [ticker]
,@start_date [start_date]
,@end_date [end_date]
,count(*) [count]
,avg([close]) [arithmetic mean]
,exp(sum([nat log of close])/count(*)) [geometric mean]
,(select * from @tmpTable) [median]
from
(
-- select for ticker from start through end dates
select date, [close], log([close]) [nat log of close]
from [DataScience].[dbo].[emas_for_model]
where
 symbol = @ticker and
 date >= @start_date and
 date <=@end_date
) closes_and_nat_logs


---------------------------------------------------------------------------
use DataScience
go  -- to start a fresh batch for local variable assignments

-- create and drop procedure any prior version of ##table_for_overall_median,
-- which is referenced in the dbo.compute_overall_median stored procedure

-- this script assumes a fresh version of the dbo.compute_overall_median
-- stored procedure was previously created in the DataScience database


drop table if exists ##table_for_overall_median


-- start of script to
-- compute an arithmetic mean, a geometric mean and a median
-- for a ticker from a start date through an end date

declare
 @ticker nvarchar(10)
,@start_date date
,@end_date date

set @ticker = 'SPXL'
set @start_date = '2016-11-30'
set @end_date = '2022-11-30'

-- populate ##table_for_overall_median
-- from [DataScience].[dbo].[emas_for_model]
-- for local @ticker, @start_date, @end_date local variable settings
select
 @ticker [ticker]
,[date]
,[close] [column_for_median]
into ##table_for_overall_median
from
(
-- select for ticker from start through end dates
select date, [close], log([close]) [nat log of close]
from [DataScience].[dbo].[emas_for_model]
where
 symbol = @ticker and
 date >= @start_date and
 date <=@end_date
) closes_and_nat_logs


-- invoke compute_overall_median stored procedure
-- display median as median_value from @tmpTable
declare @tmpTable table (median_value float)
insert into @tmpTable
exec dbo.compute_overall_median


-- display results set from
select
 @ticker [ticker]
,@start_date [start_date]
,@end_date [end_date]
,count(*) [count]
,avg([close]) [arithmetic mean]
,exp(sum([nat log of close])/count(*)) [geometric mean]
,(select * from @tmpTable) [median]
from
(
-- select for ticker from start through end dates
select date, [close], log([close]) [nat log of close]
from [DataScience].[dbo].[emas_for_model]
where
 symbol = @ticker and
 date >= @start_date and
 date <=@end_date
) closes_and_nat_logs

---------------------------------------------------------------------------
---------------------------------------------------------------------------

use DataScience
go  -- to start a fresh batch for local variable assignments

-- create and drop procedure any prior version of ##table_for_overall_median,
-- which is referenced in the dbo.compute_overall_median stored procedure

-- this script assumes a fresh version of the dbo.compute_overall_median
-- stored procedure was previously created in the DataScience database


drop table if exists ##table_for_overall_median

-- start of script to
-- compute an arithmetic mean, a geometric mean and a median
-- for a ticker from a start date through an end date

declare
 @ticker nvarchar(10)
,@start_date date
,@end_date date

set @ticker = 'SPY'
set @start_date = '2010-11-30'
set @end_date = '2016-11-30'

-- populate ##table_for_overall_median
-- from [DataScience].[dbo].[emas_for_model]
-- for local @ticker, @start_date, @end_date local variable settings
select
 @ticker [ticker]
,[date]
,[close] [column_for_median]
into ##table_for_overall_median
from
(
-- select for ticker from start through end dates
select date, [close], log([close]) [nat log of close]
from [DataScience].[dbo].[emas_for_model]
where
 symbol = @ticker and
 date >= @start_date and
 date <=@end_date
) closes_and_nat_logs


-- invoke compute_overall_median stored procedure
-- display median as median_value from @tmpTable
declare @tmpTable table (median_value float)
insert into @tmpTable
exec dbo.compute_overall_median


-- display results set from
select
 @ticker [ticker]
,@start_date [start_date]
,@end_date [end_date]
,count(*) [count]
,avg([close]) [arithmetic mean]
,exp(sum([nat log of close])/count(*)) [geometric mean]
,(select * from @tmpTable) [median]
from
(
-- select for ticker from start through end dates
select date, [close], log([close]) [nat log of close]
from [DataScience].[dbo].[emas_for_model]
where
 symbol = @ticker and
 date >= @start_date and
 date <=@end_date
) closes_and_nat_logs


---------------------------------------------------------------------------
use DataScience
go  -- to start a fresh batch for local variable assignments

-- create and drop procedure any prior version of ##table_for_overall_median,
-- which is referenced in the dbo.compute_overall_median stored procedure

-- this script assumes a fresh version of the dbo.compute_overall_median
-- stored procedure was previously created in the DataScience database


drop table if exists ##table_for_overall_median


-- start of script to
-- compute an arithmetic mean, a geometric mean and a median
-- for a ticker from a start date through an end date

declare
 @ticker nvarchar(10)
,@start_date date
,@end_date date

set @ticker = 'SPY'
set @start_date = '2016-11-30'
set @end_date = '2022-11-30'

-- populate ##table_for_overall_median
-- from [DataScience].[dbo].[emas_for_model]
-- for local @ticker, @start_date, @end_date local variable settings
select
 @ticker [ticker]
,[date]
,[close] [column_for_median]
into ##table_for_overall_median
from
(
-- select for ticker from start through end dates
select date, [close], log([close]) [nat log of close]
from [DataScience].[dbo].[emas_for_model]
where
 symbol = @ticker and
 date >= @start_date and
 date <=@end_date
) closes_and_nat_logs


-- invoke compute_overall_median stored procedure
-- display median as median_value from @tmpTable
declare @tmpTable table (median_value float)
insert into @tmpTable
exec dbo.compute_overall_median


-- display results set from
select
 @ticker [ticker]
,@start_date [start_date]
,@end_date [end_date]
,count(*) [count]
,avg([close]) [arithmetic mean]
,exp(sum([nat log of close])/count(*)) [geometric mean]
,(select * from @tmpTable) [median]
from
(
-- select for ticker from start through end dates
select date, [close], log([close]) [nat log of close]
from [DataScience].[dbo].[emas_for_model]
where
 symbol = @ticker and
 date >= @start_date and
 date <=@end_date
) closes_and_nat_logs

---------------------------------------------------------------------------
---------------------------------------------------------------------------
Next Steps
The next steps suggested by this tip can take you in any of at least three different directions:
- If you are charged with creating code for a geometric average, adapt the code for that statistic from this tip. An internet search did not discover any prior MSSQLTips.com articles with instructions for computing a geometric mean.
- In addition to including T-SQL code for computing each of the three central tendency statistics, this tip also gives some commentary that points to the advantages of each central tendency indicator. You can find commentary comparing the three central tendency indicators in the "An overview of three average statistics" section.
- Finally, you are encouraged to revisit each code sample in this tip to identify practical programming examples for when and how to apply subqueries in your T-SQL solutions. A subquery can serve many roles in T-SQL solutions because you can use a subquery in many different clauses, such as select list items, from clauses, and where clauses.


About the author
 Rick Dobson is an author and an individual trader. He is also a SQL Server professional with decades of T-SQL experience that includes authoring books, running a national seminar practice, working for businesses on finance and healthcare development projects, and serving as a regular contributor to MSSQLTips.com. He has been growing his Python skills for more than the past half decade -- especially for data visualization and ETL tasks with JSON and CSV files. His most recent professional passions include financial time series data and analyses, AI models, and statistics. He believes the proper application of these skills can help traders and investors to make more profitable decisions.
This author pledges the content of this article is based on professional experience and not AI generated.
View all my tips
Article Last Updated: 2023-05-24
