By: Rick Dobson | Comments (5) | Related: 1 | 2 | 3 | 4 | 5 | 6 | 7 | > TSQL
Problem
Our business runs a stock advisory service. Some of our clients trade our recommended stocks at a loss by buying at a high price and selling at a low price. We need some very simple trading models with comparative results to show clients how they can grow the value of their investment accounts with our stock picks.
Solution
Data mining - especially the pre-processing, preliminary data analysis, and reporting steps - can be very helpful for addressing your problem. This tip examines six stocks, such as those that might be recommended by your firm, to present the outcome of three different trading strategies. The stock trading strategies are purposely simple so that they can be readily programmed with T-SQL as well as understood by your stock trading clients. All strategies covered are consistent with showing clients how they can grow the value of their investment accounts.
The source data for the tip are stock prices from the Google Finance site. These data are available for free. The tip illustrates how to download stock prices to csv files. Then, the data are transferred to SQL Server tables.
After transferring the stock price data to a SQL Server database, they are pre-processed to make them suitable for examining how each of the three stock trading strategies perform. One stock trading strategy depends on moving averages for stock prices. This tip includes a simple explanation of moving averages as well as an easy way to compute them for stock price data.
The final tip element compares gains and losses from the three the trading strategies. The comparisons are for the six stocks individually and overall. Comparisons are computed on a per share basis as well share lot basis. A share lot is a set of shares for a stock that are bought and sold as a unit.
Downloading the data from the Google Finance site
You can download historical end-of-day price and volume for a stock from the Google Finance site. Simply enter a URL with parameters, including the stock's symbol as well as the start and end dates for the range of data that you seek. You also need to specify the output format. Your browser, such as Chrome or Internet Explorer, will retrieve the daily stock prices and volumes to a file on your computer.
The following URL specifies the retrieval of historical price and volume data for a stock with the symbol crus. The data starts as of the first trading day on or after January 1, 2008 through to the last trading day for which data are available up until August 31, 2016. The download was taken during the morning on August 24, 2016. The Google Finance site automatically names the downloaded file with the symbol specified in the URL (for example, crus.csv).
http://www.google.com/finance/historical?q=crus&startdate=Jan+1%2C+2008&enddate=Aug+31%2C+2016&output=csv
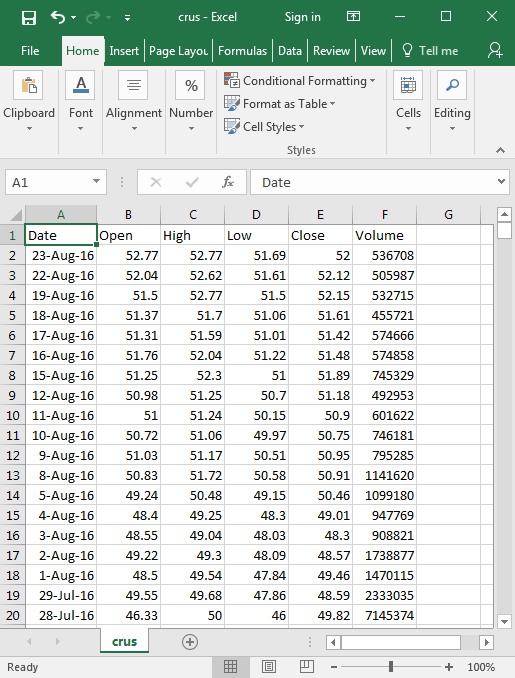
Here's a screen shot from Excel showing the first 20 rows of data in the csv file named crus.csv. Notice that there is a separate row for each trading day ending on August 23, 2016, the last trading day for which end-of-day data was available. Aside from the Date column, there are four columns specifying money values (Open, High, Low, Close) and a fifth column shows shares traded on a date for the stock designated by the symbol. While Excel automatically transforms the character data in the crus.csv file to date and numeric values, it is important to keep in mind that the data in the csv file are character data.
Data for six stock symbols were downloaded for this tip. The following bullets show and the symbols along with the corresponding company names and short descriptions. You can see from the descriptions that great diversity is readily available.
- crus is for Cirrus Logic, Inc. The company supplies circuits for consumer, automotive and professional audio and energy applications
- edu is for New Oriental Education & Tech Grp (ADR). This symbol represents an ADR for New Oriental Education & Technology Group -- a company operating in China that is a provider of private educational services. An ADR is a stock that trades in the United States but represents a specified number of shares in a foreign corporation
- meet is for MeetMe, Inc. The company makes available social networks for meeting new people in the US and in Latin America
- orly is for O'Reilly Automotive Inc, a retailer of automotive parts and accessories
- stmp is for Stamps.com, a provider of internet-based mailing and shipping services
- ulta is for Ulta Salon, Cosmetics & Fragrance, Inc. This firm sells cosmetics, fragrances, skin and hair care products, appliances, and accessories. The company also offers hair salon services and spa treatments
Migrating the csv files to SQL Server tables
This tip creates the tables to store the csv file contents in a database named stock_history_data. Then, it populates the SQL Server tables from the downloaded csv files - one table per file. The code provided for the tip will not work as is unless you have the stock_history_data database created on your SQL Server instance. If you do not have the database on your server, running the following script can create the database.
USE master
IF EXISTS(select * from sys.databases where name='stock_history_data')
DROP DATABASE stock_history_data

CREATE DATABASE stock_history_data
Because the data in the csv files are character-based, you must transform them before you can use them as dates, money, or integers in SQL Server. There are several ways to perform the transformations. A prior tip working with S&P 500 index historical prices (Creating an SSRS Matrix Sparkline Report with Data from Oracle 11g) describes an approach in which the data are imported to SQL Server as character data and then transformed via T-SQL functions to date, money, or integer values. This tip demonstrates how to use built-in SSIS transformation features to convert the data to an appropriate data type.
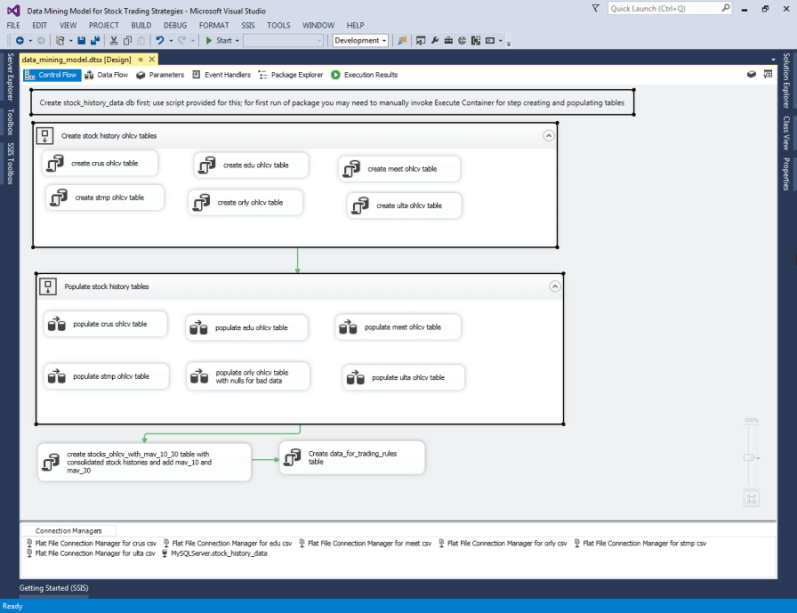
The following screen shot shows a Control Flow view of the SSIS project for data mining the stock price data downloaded from the Google Finance site. Some annotation text and two steps are highlighted. The highlighted content is for importing the downloaded data into SQL Server.
Additionally, there are 7 connection managers displayed below the control flow area.
- One is and OLEDB connection manager pointing at the stock_history_data database
- Six are for flat file connection managers that point at the downloaded csv files
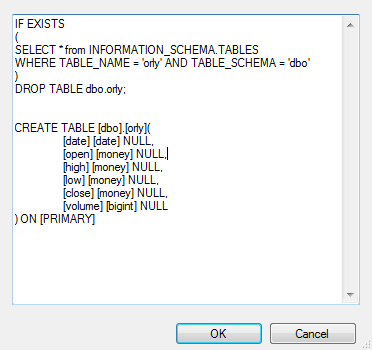
The following screen shot shows the T-SQL in the create orly ohlcv table Execute SQL Task within the Create stock history ohlcv tables Sequence Container. There are six Execute SQL Task steps in the container - one for each table to receive downloaded data from a csv file. All tables have the same specification except for the symbol name.
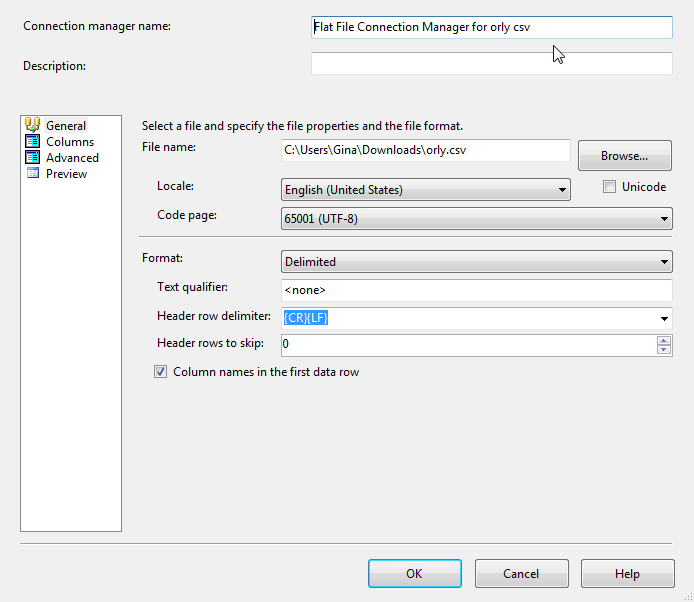
When you open a flat file connection manager for the orly.csv file, SSIS automatically sees the UTF-8 character codes sent from the Google Finance site and designates the Microsoft 65001 Code page for reading the character codes. It also expects column headers in the first row, which corresponds to the downloaded format. Therefore, no changes are required to the default General tab that appears below (other than assigning a connection manager name).
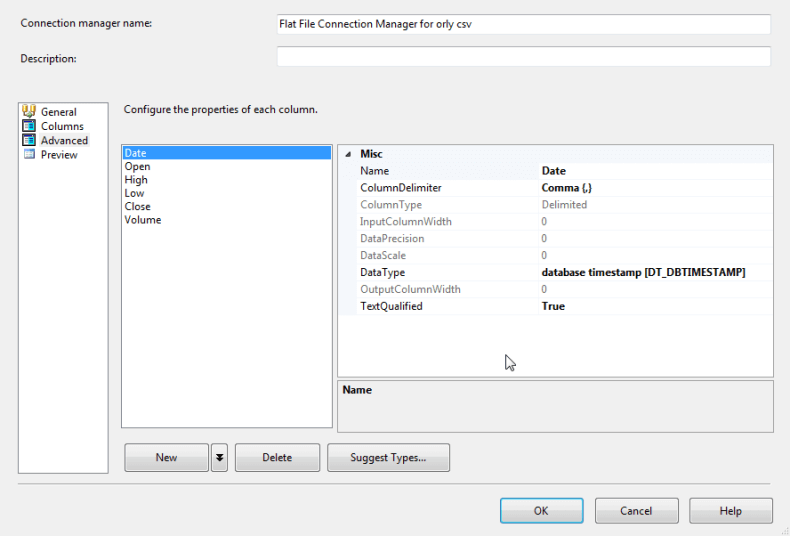
This tip uses settings on the Advanced tab to indicate SSIS data types for reading csv file data in a way that is suitable for transferring them to data types in SQL Server tables. Three distinct formats are designated as indicated in the screen shots below.
- The DT_DBTIMESTAMP data type can read UTF-8 date characters
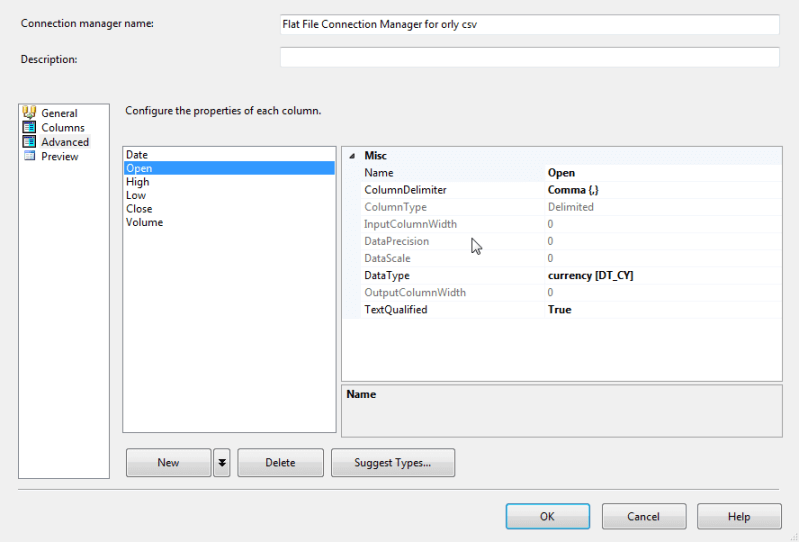
- The DT_CY data type can read UTF-8 character fields representing money; this data type designation is appropriate for the Open, High, Low, and Close columns in the csv files
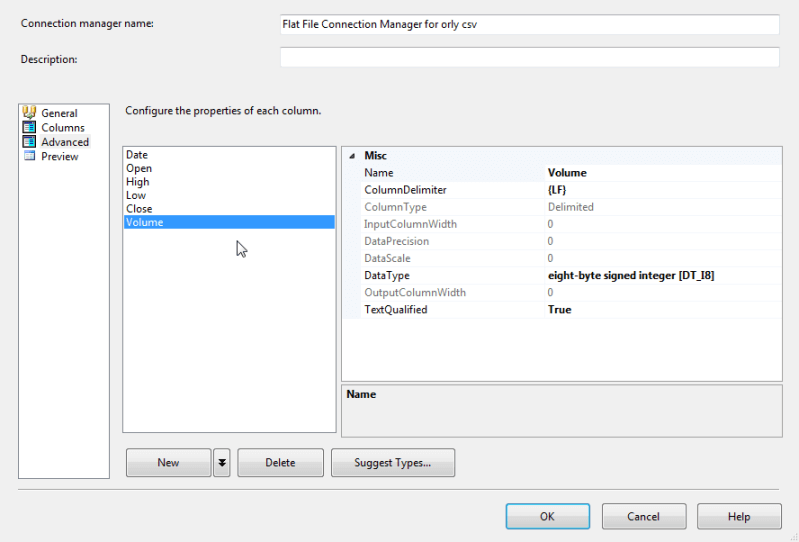
- The DT_I8 data type can read UTF-8 character fields representing integers that are going to a column with a bigint data type in a SQL Server table
With the exception of the data for the orly symbol, the csv file contents for the stocks imported successfully to SQL Server tables. However, the data for the orly symbol failed to load successfully on the first try. After examining SSIS logs and the downloaded data in Notepad++, it was discovered that selected columns in the orly data for three dates (November 24, 2010, December 23, 2010, and December 29, 2010) were incorrectly specified.
See the screen below to view from Notepad++ the faulty data in the orly.csv file. Notice that the bad data were for the Open, High, and Low columns. The data for the Date and Close column values appeared valid, but the data for the Volume column did not appear valid. However, this tip only requires valid, correct Date and Close column values.
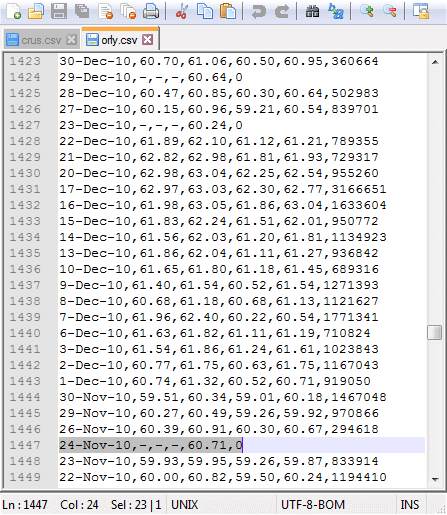
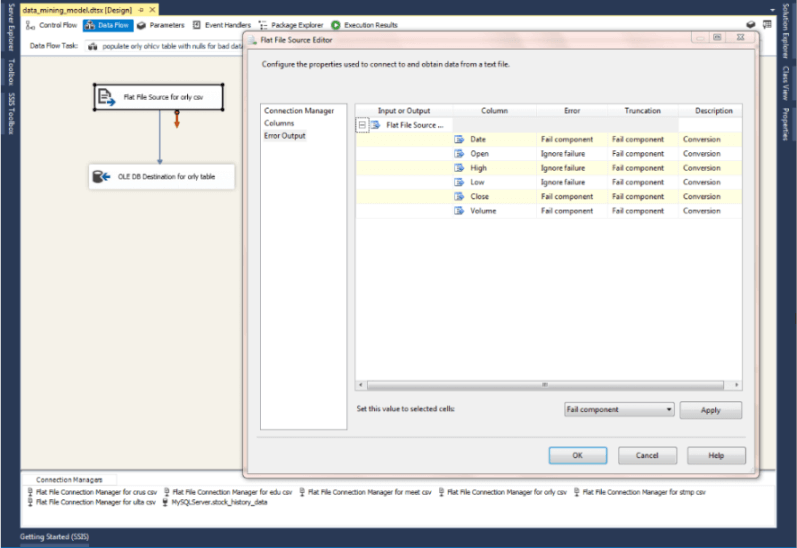
It was the bad data for the Open, High, and Low columns that caused the importing of the orly.csv file data to fail initially. You can bypass the failure by configuring settings within the Flat File Source for the orly csv step to assign NULL values to columns with invalid data during the import process. The following screen shot shows the Ignore failure settings for the Open, High, and Low columns in the orly.csv file. With these configuration changes in the Error Output tab of the Flat File Source for orly csv step, it was possible to load the orly.csv file along with downloaded data for the other five symbols.
Pre-processing the imported data for trading strategy evaluations
Up to this point, the imported data exists in six separate tables with dates going back to the first trading date in 2008 or whenever the Google Finance site first started reporting stock prices for a symbol. Aside from variations in the start date for different symbols, I sometimes noticed dates with rows of data for one symbol that were missing for other symbols. For the six stock symbols used in this tip, these missing dates were very rare and limited to data prior to 2011. The missing data are not relevant to this tip because stock trading rules were compared only for trading strategies in the 25-month window from July 2014 through July 2016.
In addition, to pre-processing filters for the date range, other pre-processing was implemented.
- Data were consolidated from six separate tables without a symbol indicator into one table with a distinct symbol indicator for each stock. This step makes it easier to evaluate trading strategies across all six stocks
- Also, 10-day and 30-day moving averages were computed from the base stock price data. Moving averages are a common technical analysis tool for analyzing stock trends. The 10-day moving average reflects short-term trends, and the 30-day moving average reflects longer-term trends
The following T-SQL script shows code for selecting data from the crus table, adding a symbol column, and computing 10-day and 30-day moving averages. This link compares 6 different methods for computing a sum over a rolling window, such as 10 days or 30 days. The method with the best performance used a customized version of the SUM function that depended on PRECEDING and CURRENT ROW key words. The following code illustrates an adaptation of the best method for computing moving averages instead of sums over a rolling window.
SELECT
'CRUS' SYMBOL
,*
,
mav_10 = CASE WHEN ROW_NUMBER() OVER (ORDER BY [Date]) > 9
        THEN SUM([Close]) OVER (ORDER BY [Date] ROWS BETWEEN 9 PRECEDING AND CURRENT ROW)
        END/10
,
mav_30 = CASE WHEN ROW_NUMBER() OVER (ORDER BY [Date]) > 29
        THEN SUM([Close]) OVER (ORDER BY [Date] ROWS BETWEEN 29 PRECEDING AND CURRENT ROW)
        END/30
FROM
(
SELECT *
FROM [dbo].[crus]
) crus_ohlcv
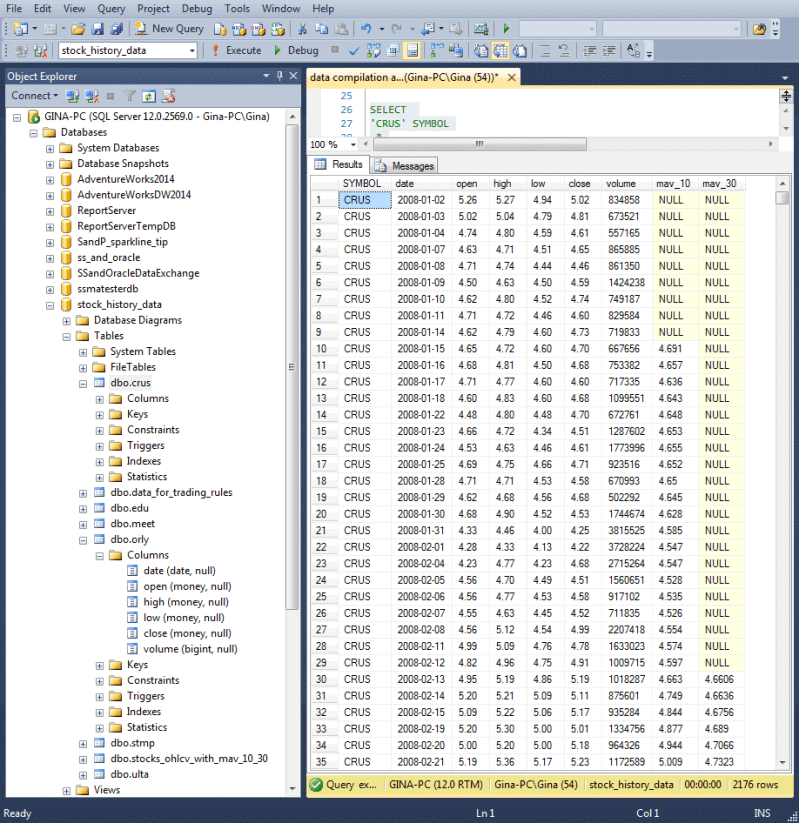
The following screen shot displays an excerpt from the result set for the preceding script. The mav_10 column shows 10-day moving average values and the mav_30 column reveals 30-day moving average values. Notice that values for these columns do not start until the tenth and thirtieth rows, respectively. This is because a 10-day moving average requires at least 10 preceding days of values, and a 30-day moving average requires at least 30 days of preceding values. Rolling windows determine which dates contribute to the moving average values on each row.
The step named create stocks_ohlcv_with_mav_10_30 table with consolidated stock histories and add mav_10 and mav_30 in the Control Flow diagram displayed in the second screen shot within this tip includes the complete script for date filtering, consolidation, adding symbols, and computing moving averages. The step stores its outcome in the stocks_ohlcv_with_mav_10_30 table.
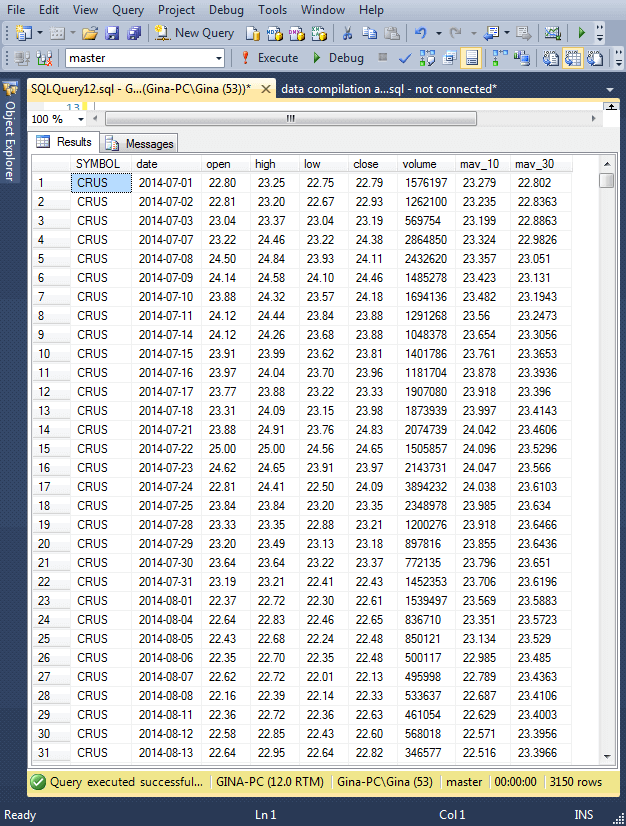
There are 525 stock trading days from July 2014 through July 2016. For the six stocks examined within this tip, this means there are 3150 rows in the stocks_ohlcv_with_mav_10_30 table. The following screen shot shows the first 31 rows in the table. Because the data are arranged by Date within Symbol, these rows are for the earliest 31 trading days for the crus symbol. Because the moving averages are computed on values going back as far as 2008, there are no NULL values for either the 10-day or 30-day moving averages.
Three trading rules
Before moving to the final pre-processing step for the stock price data, it will be helpful to review the three trading strategies evaluated in this tip. Recall that the objective is to evaluate simple trading rules because we want the rules to be easily understood by clients of the stock advisory service. Also, we seek rules which are safe to trade - so that stock price gains go up if stock prices rise throughout an evaluation period (we'll site a couple of examples where a trade can lose money even while a stock price is rising over an extended period). This tip evaluates trading strategies for the 25-month period from July 2014 through July 2016. Additionally, we need rules that can be readily compared to one another. The rules examined in this tip are more like benchmarks for contrasting trading styles than precise recommendations on how to trade stocks.
The three trading rules evaluated by this tip are as follow.
- The overall buy-and-hold rule buys shares for a stock at the Open price of the first trading day in July 2014 and sells those shares at the Close price on the last trading day in July 2016
- The monthly buy-and-hold rule buys shares for a stock at the Open price for each month from July 2014 through July 2016. On the last trading day of each month, the rule sells the stocks purchased at the beginning of the month
- The conditional buy-and-hold strategy buys shares for a stock only when the short-term price trend at the beginning of month as indicated by the 10-day moving average is greater than the long-term trend as indicated by the 30-day moving average. Otherwise, no purchase is made for a stock during the month. To keep the code simple for this trading rule comparison, we assume that you know the 10-day and 30-day moving average values for the month's first trading day at the start of a month's first day
Trading plans are compared on a share price change as well as a lot price change basis.
- Share price change is computed based on the difference between the Open price on first trade for a period versus the Close price on the last day of a period. If the Close price is greater than the Open price, then rule results in a gain. Otherwise, the rule breaks even or loses money
- The start and end days change from one rule to the next
- For the buy-and-hold rule, there is just one start date and one end date. The start date is the first trading day at the beginning of July 2014. The end date is the last trading day of July 2016
- For the monthly buy-and-hold rule, there is start date and end date for each of the 25 months from July 2014 through July 2016. Within each month, the start date is always the first trading day of the month, and the end date is always the last trading day of the month
- For the conditional buy-and-hold rule, there are a variable number of months in which stocks can be bought and sold. Stocks are only bought on months when the 10-day moving average is greater than the 30-day moving average at the beginning of the month. If there is a stock purchase at the start of a month with this rule, then the close price is for the last trading day in the month
- Recall that the term lot refers to the collection of stock shares bought during a trade. The term lot size indicates the number of stock shares bought at one time. For evaluation in the context of this tip, the lot size for the monthly buy-and hold rule is the number of shares purchased (rounded up to the nearest 10 shares) so the average monthly price is $4,000 or slightly more. The lot size varies from one stock to the next within a month. The lot sizes computed for the monthly buy-and-hold rule are also used for the conditional buy-and-hold rule
- The overall buy-and-hold rule uses the monthly buy-and-hold lot size of July 2014 for its first buy. Because at the end of 25 months you sell the shares acquired in the initial purchase with the overall buy-and-hold rule, the lot size sold in July 2016 is the same as the shares bought in July 2014
- The conditional buy-and-hold rule uses the monthly buy-and-hold lot sizes. The only difference is that for months in which the initial 10-day moving average is less than or equal to the initial 30-day moving average, there is no buying and selling of stock
The table for evaluating trading rules
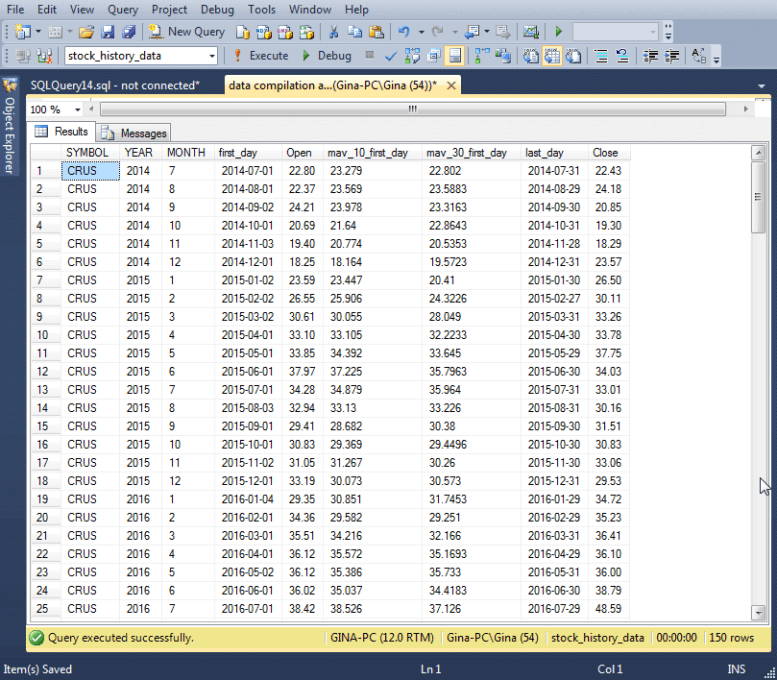
This tip uses the data_for_trading_rules table to store data in a format that simplifies the computation of gains and losses on a monthly basis. The next screen shot shows the first 25 rows of the data_for_trading_rules table. Notice that all 25 rows are for the crus symbol.
- The first three columns denote the symbol and time period for the rest of the data on a row
- The first_day and last_day columns are not strictly necessary, but they provide a way of visually confirming these dates are within the year and month for the row
- The Open column indicates the open price on the first trading day of the month for the row
- The mav_10_first_day and mav_30_day columns display the 10-day and 30-day moving average on the first trading day of the month
- The Close column reveals the closing price on the last trading day of the month
All the data that you need for evaluating the monthly and conditional buy-and-hold trading rules is on one row of the data_for_trading_rules table. For example, the Close column value less the Open column value indicates the gain or loss per share for the month with the monthly buy-and-hold rule. The conditional buy-and-hold rule only uses the difference between the Close and Open column values for months in which the 10-day moving average is greater than the 30-day moving average. By summing the gain or loss for each month in which there was a trade, you can derive the gain or loss across all 25 months for which stock prices are tracked.
For the overall buy-and-hold rule, you need two rows from the data_for_trading_rules table to evaluate the gain or loss for the trading rule. The difference between the Close price for July 2016 less the Open price for July 2014 returns the gain or loss for a stock. Just as with the monthly rules, you compute this value separately for each stock.
The following script shows the T-SQL script for computing the data_for_trading_rules table. The script contains two derived table queries.
- The first_day_data derived table query returns the Open price along with the 10-day and 30-day moving averages for the first trading day of each month
- The last_day_data derived table query returns the Close price for the last trading day of each month
- A sub-query within the first_day_data and last_day_data derived table queries allows the queries to return data for just the first or last day in a month from the stocks_ohlcv_with_mav_10_30 table
- The two derived table queries are inner joined based on SYMBOL, YEAR, and MONTH to put opening and closing prices on the same row of the data_for_trading_rules table
- The INTO clause just before the FROM clause in the main outer query populates the data_for_trading_rules table
-- data for trading rules
IF EXISTS
(
SELECT * from INFORMATION_SCHEMA.TABLES
WHERE TABLE_NAME = 'data_for_trading_rules' AND TABLE_SCHEMA = 'dbo'
)
DROP TABLE dbo.data_for_trading_rules;


SELECT
first_day_data.SYMBOL
,first_day_data.YEAR
,first_day_data.MONTH
,first_day_data.first_day
,[Open]
,first_day_data.mav_10_first_day
,first_day_data.mav_30_first_day
,last_day_data.last_day
,last_day_data.[Close]
INTO dbo.data_for_trading_rules
FROM
(
-- first_day data
SELECT
SYMBOL
,YEAR([Date]) [YEAR]
,MONTH([Date]) [MONTH]
,[Date] first_day
,[Open]
,mav_10 mav_10_first_day
,mav_30 mav_30_first_day
FROM dbo.stocks_ohlcv_with_mav_10_30
WHERE [Date] IN
(
SELECT
MIN([Date]) first_day
FROM dbo.stocks_ohlcv_with_mav_10_30
GROUP BY YEAR([Date]), MONTH([Date])
)
) first_day_data

INNER JOIN

(
-- last_day data
SELECT
SYMBOL
,YEAR([Date]) [YEAR]
,MONTH([Date]) [MONTH]
,[Date] last_day
,[Close]
,mav_10 mav_10_last_day
,mav_30 mav_30_last_day
FROM dbo.stocks_ohlcv_with_mav_10_30
WHERE [Date] IN
(
SELECT
MAX([Date]) last_day
FROM dbo.stocks_ohlcv_with_mav_10_30
GROUP BY YEAR([Date]), MONTH([Date])
)
) last_day_data

ON
first_day_data.SYMBOL = last_day_data.SYMBOL
AND
first_day_data.YEAR = last_day_data.YEAR
AND
first_day_data.MONTH = last_day_data.MONTH
Evaluating the Trading Rules
Three SSRS reports are provided as a model for evaluating the trading rules with the six stocks examined in this tip. The summary results do not include trading costs because commissions per trade can vary (or even be zero in some cases) depending on the broker and security in which you invest. However, if you plan on using a particular broker with a standard fee per trade, you may want to factor in a broker commission.
The first report is a top line report comparing the three trading strategies for gain versus loss on a per share basis and a lot size basis. As the screen shot below shows, all three trading strategies generated gains over the 25-month evaluation period for each of the stocks and overall. The buy-and-hold strategy edged out the buy-and-sell every month rule (overall gain of $22,964 for buy-and-hold versus $22,950 for buy-and-sell every month). The trading strategy based on the 10-day moving average versus the 30-day moving average generated the smallest gains by a substantial margin. We show why this outcome is obtained in the next couple of reports.
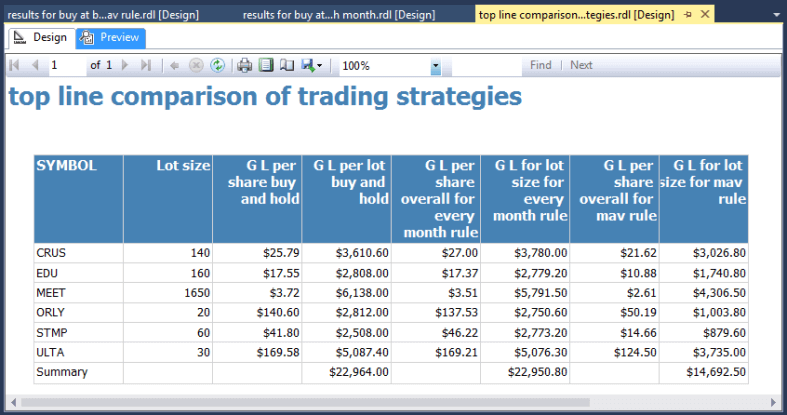
As you can see, there are 8 columns in the body of the top-line report. The query for the report starts with a SELECT statement that references two main derived table queries -- each of which has its own sub-queries. The listing below just shows the outer most query and references to the main derived table queries so you are not distracted by details from getting the big picture about how the report compiles data. If you wish, you can examine the complete query for the top line comparison of trading strategies report in the SSRS project available for download with this tip.
- One main derived query generates summary data for the buy and hold strategy; its name is buy_and_hold_summary
- The other main derived table query generates summary results for the monthly buy and hold rule versus the conditional buy-and-hold rule based on moving averages
SELECT
 buy_and_hold_summary.SYMBOL
,CAST(buy_and_hold_summary.[Lot size] as bigint) [Lot size]
,buy_and_hold_summary.[G/L per share] [G/L per share buy-and-hold]
,buy_and_hold_summary.[G/L per lot] [G/L per lot buy-and-hold]
,monthly_buy_and_sell_vs_mav_buy_and_sell_summary.[G/L per share overall for every month rule]
,monthly_buy_and_sell_vs_mav_buy_and_sell_summary.[G/L for lot size for every month rule]
,monthly_buy_and_sell_vs_mav_buy_and_sell_summary.[G/L per share overall for mav rule]
,monthly_buy_and_sell_vs_mav_buy_and_sell_summary.[G/L for lot size for mav rule]
FROM
(

Detailed SQL for buy_and_hold_summary sub-query goes here

) buy_and_hold_summary

INNER JOIN

(

Detailed SQL for monthly_buy_and_sell_vs_mav_buy_and_sell_summary sub-query goes here

) monthly_buy_and_sell_vs_mav_buy_and_sell_summary

ON buy_and_hold_summary.SYMBOL = monthly_buy_and_sell_vs_mav_buy_and_sell_summary.SYMBOL
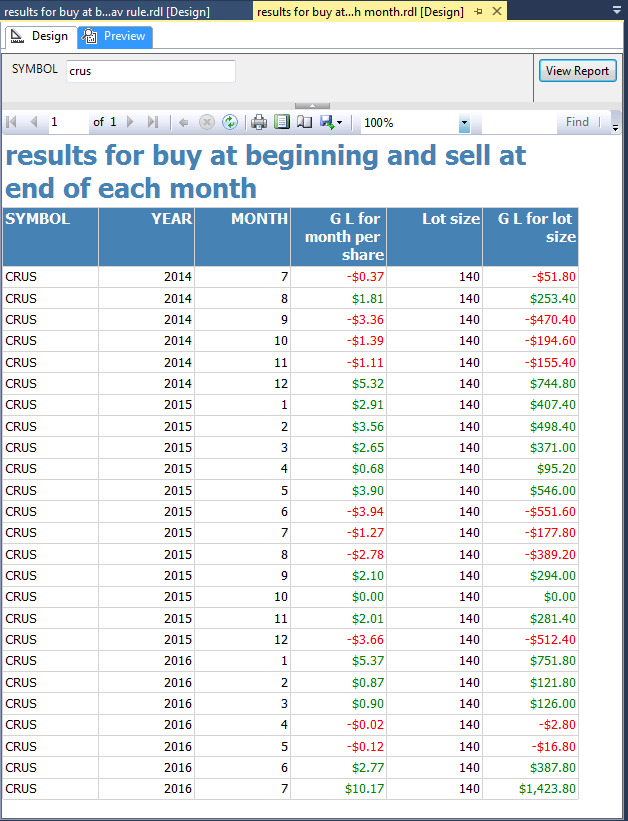
The next screen shot presents another report with detailed results for the monthly buy-and-hold trading rule. You can use this report to examine results for any of the six stocks in the data set for this tip. The screen shot below shows results for the stock with the crus symbol.
This second report displays monthly trading gain-loss outcomes on a per share basis and a lot size basis for the symbol entered into the SYMBOL selection box. Months with a loss show their outcome in red; otherwise, the per share and per lot size outcome shows in green.
Although the preceding report shows that the gain for the crus stock was about $3,780, the following report shows a loss in 10 of the 25 months for which price data was analyzed. Furthermore, the stock loses value in 4 of the first 5 months and an additional span of three consecutive months (June 2015 through August 2015) that were analyzed. If a client invested in the crus stock exclusively during either of these periods, they could easily conclude a recommendation for crus was a bad one in spite of the fact that the stock gained over 100% over the 25-month evaluation period!
The following query shows the code for reporting monthly buy-and-hold trade outcomes. The outermost SELECT statement references two derived table queries that are inner joined. The outermost SELECT computes one result (G/L for lot size) and renames other columns from their underlying source. Also, the @SYMBOL parameter in the code's last line allows the report user to specify a stock symbol for which to show results.
- The monthly_G/L_per_share derived table query returns for each month the difference between the final closing price and the initial opening price; this is the gain or loss per share for a month
- The shares_to_buy_sell derived table query computes the lot size for a stock, which is, in turn, used by the outermost query to help generate the gain or loss per lot for a month
SELECT
[monthly_G/L_per_share].SYMBOL
,YEAR
,MONTH
,ROUND([G/L for month per share],2) [G/L for month per share]
,CAST([Shares to buy_sell] as bigint) [Lot size]
,ROUND([Shares to buy_sell] *[G/L for month per share],2) [G/L for lot size]

FROM
(
-- monthly G/L per share
SELECT [SYMBOL]
      ,[YEAR]
      ,[MONTH]
      ,[first_day]
      ,[Open]
      ,[last_day]
      ,[Close]
      ,([Close] - [Open]) [G/L for month per share]
FROM [stock_history_data].[dbo].[data_for_trading_rules]
) [monthly_G/L_per_share]

INNER JOIN

(
-- shares (rounded to 10) to buy for
--  around an average $4000 open
SELECT [SYMBOL]
    ,(FLOOR(4000/AVG([Open])/10)+1)*10 [Shares to buy_sell]
FROM [stock_history_data].[dbo].[data_for_trading_rules]
GROUP BY [SYMBOL]
) shares_to_buy_sell

ON [monthly_G/L_per_share].SYMBOL = shares_to_buy_sell.SYMBOL

WHERE [monthly_G/L_per_share].SYMBOL = @SYMBOL
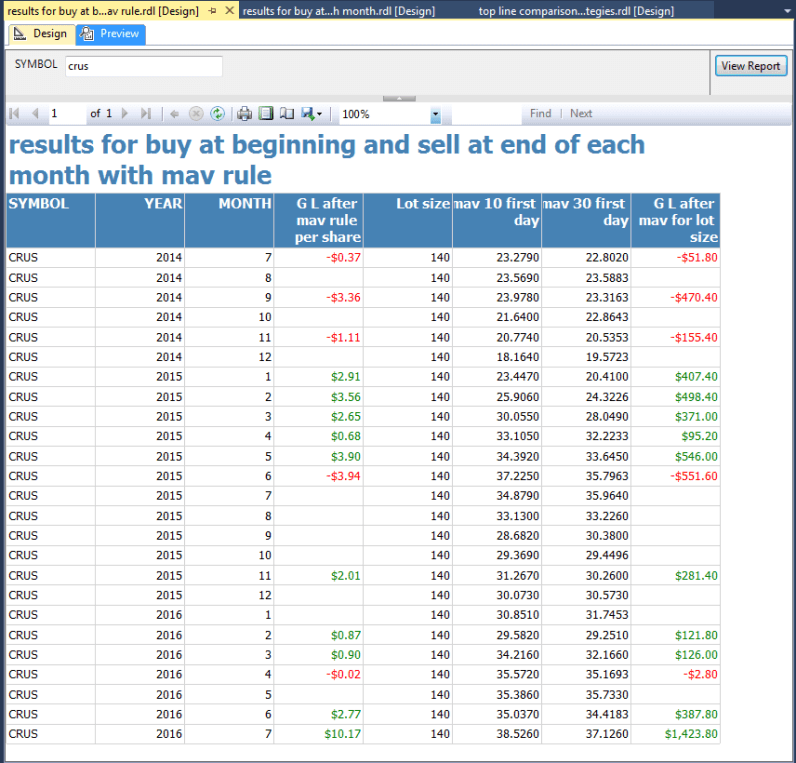
The next screen shot for this tip shows the trading outcomes when the 10-day moving average is greater than the 30-day moving average at the start of the month. The result of the rule is that trades are not made in 10 months for which the every-month rule makes a trade. Both this report and the preceding one are for the stock with a crus symbol.
There are 10 months in which the trading rule based on moving averages skips a trade for a month relative to the every-month trading rule. The trading rule based on moving averages skipped 5 losses and 1 no-change outcome. These good results from the moving average rule are counter-balanced, in part, by missed gains in 4 months. The top-line report above shows that the moving average returned over $700 less gains than the every-month rule for the crus stock. The shrinkage in gains was even greater for the remaining 5 stocks.
My take-away from these results is that the moving average rule is not sufficiently accurate about discovering when a month is likely to result in a loss versus a gain. For example, if the moving average rule was 100% accurate, trading would occur only for months in which there was a gain. More research to discover better trading rules for avoiding losses while not missing gains might result in selective trading strategies that are better than buy-and-hold or buy-and-sell every month.
The following script shows the query for the report on the moving average trading rule. This script differs from the script for the every-month rule in that it shows 10-day and 30-day moving averages and that it only presents trading outcomes for months where the initial 10-day moving average is greater than the initial 30-day moving average.
SELECT
[monthly_G/L_per_share].SYMBOL
,YEAR
,MONTH
,[G/L after mav rule per share]
,CAST([Shares to buy_sell] as bigint) [Lot size]
,[mav_10_first_day]
,[mav_30_first_day]
,ROUND([Shares to buy_sell]*[G/L after mav rule per share],2) [G/L after mav for lot size]
FROM
(
-- monthly G/L per share
SELECT [SYMBOL]
      ,[YEAR]
      ,[MONTH]
      ,[first_day]
      ,[Open]
      ,[last_day]
      ,[Close]
      ,([Close] - [Open]) [G/L for month per share]
      ,[mav_10_first_day]
      ,[mav_30_first_day]
   ,
    CASE
  WHEN [mav_10_first_day] > [mav_30_first_day] THEN ([Close] - [Open])
  ELSE NULL
    END [G/L after mav rule per share]
FROM [stock_history_data].[dbo].[data_for_trading_rules]
) [monthly_G/L_per_share]

INNER JOIN

(
-- shares (rounded to 10) to buy for
--  around an average $4000 open
SELECT [SYMBOL]
    ,(FLOOR(4000/AVG([Open])/10)+1)*10 [Shares to buy_sell]
FROM [stock_history_data].[dbo].[data_for_trading_rules]
GROUP BY [SYMBOL]
) shares_to_buy_sell

ON [monthly_G/L_per_share].SYMBOL = shares_to_buy_sell.SYMBOL

WHERE [monthly_G/L_per_share].SYMBOL = @SYMBOL
Next Steps
- This tip presents three simple trading models implemented via T-SQL code for a selection of 6 stocks over a 25-month evaluation period. Three SSRS reports are also presented for contrasting and analyzing the trading models. The reports show that it is possible to have stocks that gain significant value over the 25-month evaluation even when selectively investing in the stocks for just some months can actually generate a loss. By sharing these results with its clients, the stock advisory firm can help clients avoid losing money on poorly timed stock trades for recommended stocks.
- Because all steps from downloading historical stock prices through to preparing the reports are described, the stock advisory firm can use any other set of stocks besides those covered in this tip for a report to its clients. Also, any evaluation period for which the Google Finance site has stock prices can be used for reporting the results of trading rules. Finally, additional data mining of stock price data may lead to better rules for extracting more gains from stock trading.
- The resource files folder for this tip include the project files for the SSIS and SSRS projects mentioned in the tip along with other scripts that you may find useful. Please be sure and review the readme.txt file in the resource solution folder before trying to reproduce any results in the tip based on the files in the resource files folder.
- Finally, I close by indicating that this tip is not recommending any particular stocks, including the six analyzed ones. These stocks were chosen because I had been watching them as part of my normal investing due diligence. At the time that I submitted this tip to MSSQLTips.com, I held positions in three stocks among the six in the tip.
- Download resources for this tip.


About the author
 Rick Dobson is an author and an individual trader. He is also a SQL Server professional with decades of T-SQL experience that includes authoring books, running a national seminar practice, working for businesses on finance and healthcare development projects, and serving as a regular contributor to MSSQLTips.com. He has been growing his Python skills for more than the past half decade -- especially for data visualization and ETL tasks with JSON and CSV files. His most recent professional passions include financial time series data and analyses, AI models, and statistics. He believes the proper application of these skills can help traders and investors to make more profitable decisions.
This author pledges the content of this article is based on professional experience and not AI generated.
View all my tips
