By: Rick Dobson | Comments | Related: 1 | 2 | 3 | 4 | 5 | 6 | 7 | > TSQL
Problem
How can I use T-SQL to enhance the usefulness of typical stock price indicators? Our newsletter wants to provide value to subscribers by recommending when to buy and sell stocks based on the Relative Strength Indicator for stock prices in a SQL Server database. We seek a framework based on T-SQL code for how to evaluate custom trading rules for using the Relative Strength Indicator to arrive at something better than just the basic recommendations on when to buy and sell stocks.
Solution
A recent SQL Server tip presented T-SQL code for computing the Relative Strength Index (RSI) and storing RSI values in a SQL Server database. In fact, the prior tip demonstrated how to store daily RSI values over nearly four years for over 3200 stocks in a SQL Server database. The tip also offered a basic guide on how to interpret RSI values and a simple demonstration of transitions from oversold to overbought levels and back again reliably signaling stock price reversals. To simplify the interpretation of results, the examination of overbought and oversold RSI values was restricted to just six stocks. It can be valuable to know about stock price reversals because they denote times when it is good to buy and sell stocks profitably (for example, buying when the price is low and selling when the price is high).
This tip goes beyond the introduction to the RSI in a couple of ways. First, this tip describes RSI value transitions other than simple ones from oversold to overbought and back again. Next, the tip presents trading rules and T-SQL code for developing stock buy and sell recommendations based on non-basic RSI value transitions. This tip concludes with an evaluation of a tweaked RSI model for providing recommendations on when to buy and sell stocks. Both the model implementation and evaluation are demonstrations of how to program with T-SQL an artificial intelligence solution along with a data science evaluation model.
Despite the comparison of a tweaked model to the basic oversold and overbought model for recommending when to buy and sell dates for stocks, the main purpose of this tip is not to recommend a tweaked model. Instead, the tip's key objective is to provide a framework for evaluating refined model specifications. After grasping the framework, you will be able to evaluate any set of alternative model specifications. While reading the tip, please reflect on alternative assumptions that you want to test beyond those evaluated in this tip.
A quick review of the RSI
Individual RSI values offer a snapshot of the relative strength of a stock price in a window of recent trading days - typically, fourteen. RSI values can range from zero through one hundred. Low values indicate relative stock price weakness, and high values indicate relative stock price strength. Beyond that, values of seventy and above are commonly referred to as indicating overbought stock prices. Similarly, values of thirty and below are normally interpreted as indicating oversold prices. When an RSI value initially leaves the oversold value range, it can indicate a good time to buy a stock because the price is just beginning to rise. In contrast, when a RSI value initially transitions from an overbought range to a value below overbought, it can indicate a good time to sell a stock to collect gains achieved since the buy date.
In fact, RSI values do not always oscillate in a systematic and reliable fashion from oversold to overbought values. One common variation from oversold-to-overbought and back is sometimes referred to as trending. In this kind of deviation, the initial transition from out of overbought is followed by one or more other migrations into and out of the overbought range of RSI values. During these consecutive moves into and out of the overbought range, stock prices can trend up. Migrations into and out of the oversold region of RSI values can also consecutively follow one another. In this case, stock prices will generally trend down.
Even during a period when a stock price is generally trending up or down because of repeated consecutive moves into and out of either an overbought or oversold region, stock prices can deviate in the short range from the general trend. These short-term deviations can be sufficiently large to call into question whether a trend is about to end abruptly.
Unfortunately, the RSI indicator does not flash a signal letting the user know whether any given transition out of overbought is the last of one, the first one of many to follow, or something in between. Similarly, the RSI indicator does not issue a warning about whether a short-range deviation is the onset of the end of a trend or just a random deviation from within a general trend. The absence of precise signals for these kinds of events can complicate a proper interpretation of how to respond to RSI values.
- If you sell a stock on an initial transition out of the overbought region and the move is only the first of many into and out of the overbought region, then you are foregoing substantial gains by selling a stock earlier than necessary.
- Conversely, keeping a stock that had a trending up period but which is currently deviating from the prior trend can expose a position to substantial loss of previously accumulated gains.
This tip demonstrates some trading rules and how to implement them with T-SQL that you may find useful for dealing with the preceding two issues.
Before closing this section, it may be useful to raise some additional points. There are other kinds of deviations from the simple trading model of buy when RSI transitions out of oversold and sell when RSI leaves overbought. For example, a move out of an oversold region may have less significance if the long-term or intermediate-term trend for a stock is down rather than up. Also, you may find it beneficial to buy stocks when a stock's RSI value troughs and starts to move up although the bottom is above the oversold region. These and similar kind of matters are beyond the scope of this tip because they bear on how to trade stocks based on their RSI values. This tip is merely concerned with presenting a framework for evaluating the relationships between RSI value changes and stock price changes for different sets of trading rules.
Reviewing prior buy and sell recommendations
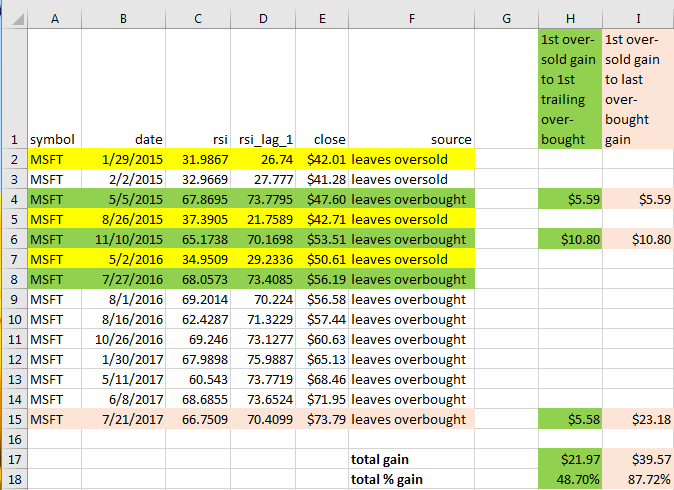
A simple way to start analyzing the relationship of RSI values to stock prices is to examine a table with records showing RSI values and stock prices when RSI values transition out of an oversold or an overbought range. The following screen shot shows edited results for such a table; the displayed table is from the prior RSI tip for Microsoft Corporation (MSFT) stock. The editing is restricted to color coding, formatting for numeric and currency values and the extraction of summary information in columns H and I.
Aside from the formatting changes, the results in the screen shot below are directly from a T-SQL query available from the prior tip that searches a table of RSI values and close prices for instances where RSI values either leave oversold or leave overbought value ranges for the MSFT stock symbol. The source data are from the AllNasdaqTickerPricesfrom2014into2017 database, which is available in a full version and an abbreviated version from MSSQLTips.com. To reproduce the results displayed in the screen shot, you will need to run a script for creating and populating the rsi table in the database and run another query for searching the rsi table; these scripts are available as a download from the prior RSI tip. An Excel workbook file (rsi_buys_and_sells_refine.xlsx) contains the worksheet displayed below as well as worksheets for five other stocks reported on in the prior tip.
The query results start in row 2. The date values (column B) denote when a transition occurred. The source values (column F) indicate the type of transition. The rsi and rsi_lag_1 values (columns C and D) reveal the RSI values on the date of the transition and the day before the transition. Finally, the close values are for the closing stock price on the date of the transition. The color coding is as follows:
- Yellow is for the first leaves oversold date of a reversal cycle. You can think of the date from this record as the beginning date of a reversal cycle.
- Green and beige are for the leaves overbought dates.
- Green is for the first overbought date in a reversal cycle.
- Beige is for the last overbought date in a reversal cycle.
- When a leaves overbought record is both the first date and the last date for a leaves overbought record within a reversal cycle, it has a green color.
Scrutiny of the results in the screen shot leads to the discovery of both consecutively repeating instances of leaves oversold and leaves overbought records.
- For example, rows two and three show a leaves oversold records. Notice that the close price declines from $42.01 in row two to $41.28 in row three.
- A series of consecutive leaves overbought records appear in rows eight through fifteen. In this case,
- the close price is $56.19 on row eight and
- the close price is $73.79 on row fifteen.
You can examine other worksheets within the rsi_buys_and_sells_refine.xlsx workbook file for additional examples of trending for five other stock symbols. The code reviewed in the next section will take advantage of trending for close prices to refine the selection of a sell date in contrast to just picking the first overbought record in a reversal cycle.
- It is relatively easy to designate the date for the first leaves overbought record.
- As mentioned previously, there is no clear signal that reveals when the last leaves overbought record in a trending series occurs.
- However, you can relatively easily track the closing prices for each RSI value within a reversal cycle. Therefore, it may be possible to pick good stock sell dates based on a closing price within a trending series of RSI values.
- Before proceeding, I want to remind you that the main thrust of this tip is to provide a framework for refining the buy on leaves oversold and sell on first leaves overbought basic RSI model. The tip's goal is not to propose the best alternative to the basic model. You will learn how to tweak a model from a base set of assumptions and then evaluate the performance of the tweaked model to the base model.
Customized rules for picking sell dates within reversal cycles
Here's a description of the four rules that will be programmed with T-SQL to designate buy and sell dates based on RSI values. The rules are implemented in the order that they are listed. All rules assume a buy at the first leaves oversold record for a stock's reversal cycle.
- The model sells a stock on the first leaves overbought record if the close price is down by more than twenty percent from the buy price. This kind of outcome is possible after a sequence of consecutive leave oversold records that gets followed by a leaves overbought record. If the initial leaves overbought record does not lead to a consecutive sequence of additional leaves overbought records that offsets and eventually overwhelms the preceding consecutive leaves oversold records, this rule can help to avoid even greater losses.
- If there is just one leaves overbought record trailing a leaves oversold record, then sell the stock on the trailing record. Implementing this rule only for leaves overbought records that are not trending allows for the accumulation of gains when leaves overbought records are not trending.
- Sell a stock when in a trending leaves overbought series when its percentage change from the maximum percentage change in the reversal cycle is more than twenty percent. This rule is meant to help preserve accumulated gains when a reversal is on a downward trajectory towards its end.
- Finally, sell a stock when it is the last leaves overbought record and the current price is within sixty percent of the maximum gain. This is the last rule, and it is only invoked after testing for the applicability of each of the preceding rules. So, the leaves overbought record is a part of a trending series that have never previously experienced a drawdown of more than twenty percent from the maximum prior gain.
The implementation of these rules within this tip depends on a script and two stored procedures. The script is designed to test any customized list of stock symbols. This is achieved by
- populating a ##symbol table with a list of stock symbols
- successively passing through a loop for each stock symbol in the ##symbol table
- implementing the trading rules for each symbol and saving the trading outcomes during each pass through the loop
The script (rsi_buys_and_sells_from_list.sql) manages populating of the ##symbol table and selected other key tables for implementing the rules and saving the trading results. Another main table populated by the script is the ##rsi_reversal_trades table; this table stores the result sets corresponding to columns A through F in the image in the preceding screen shot for each symbol in the ##symbol table. The stored procedures are called from within a loop in the script. Their purpose is to simplify the script by handling selected specialized processes for implementing the trading rules and saving the resulting trading outcomes.
- The first stored procedure is named generate_rsi_close_history_for_symbol. The main purpose of this stored procedure is to create and populate the ##rsi_close_history table. This table builds on the ##rsi_reversal_trades table by adding in RSI and close values for individual trading days within a symbol's reversal cycles.
- The second stored procedure is named generate_buy_sell_prices_for_reversals_by_symbol. The main purpose of this stored procedure is to apply the four customized trading rules described at the beginning of this section. Another important role of the stored procedure is to populate the ##sell_rows_from_#test2 table. This table accumulates trading outcomes for symbols in the ##symbol table.
The following script shows the T-SQL in the rsi_buys_and_sells_from_list.sql file. Recall that this is a master script in the sense that it creates and populates a ##symbol table and a ##rsi_reversal_trades table before invoking the generate_rsi_close_history_for_symbol and generate_buy_sell_prices_for_reversals_by_symbol stored procedures.
- The script begins by creating three tables: ##rsi_reversal_trades, ##symbol, and ##sell_rows_from_#test2.
- The ##symbol table has two columns.
- Its symbol column has a varchar data type whose values can accommodate up to five characters.
- Its pk column has an int data type value.
- Because of the ways that the pk values are used in the code below, the pk value for the initial symbol should be one. The value for each additional symbol should increase by one.
- The ##rsi_reversal_trades table stores the leaves oversold and leaves overbought records for each symbol in the ##symbol table. The table has columns for documenting these key records.
- The source column is a varchar data type that holds a maximum of 20 characters. The column is dedicated to holding one of two values: "leaves oversold" or "leaves overbought". At a top line level, each reversal cycle for a symbol is comprised of a set of leaves oversold and leaves overbought records. You can refer to the elements of this set as reversal records.
- The symbol column denotes the stock symbol to which each reversal record applies.
- The date column denotes the trading date on which the reversal record occurred.
- The rsi column has the RSI value on the date for the reversal record.
- The rsi_lag_1 column has the RSI value on the trading date before the reversal record.
- The close column stores the close price on the date for the reversal record.
- The ##sell_rows_from_#test2 table is merely created in the script, but it is populated in the generate_buy_sell_prices_for_reversals_by_symbol stored procedure. Additional commentary for the ##sell_rows_from_#test2 table will appear in the code review for the stored procedure as well as in the next section titled "How do the customized rules perform?".
- The code for populating the ##symbol table consists of three types of statements.
- The first statement is an insert statement. The insert statement is to pump a set of rows into the ##symbol table.
- Two additional types of statements are used to specify rows of column values for the set of rows inserted into to the ##symbol table.
- First, a select statement specifies a value for the symbol column and a value for the pk column; there should be a distinct select statement for each distinct row of values in the ##symbol table.
- Second, there is a union statement following each select statement except the last one, which specifies the values for the last row in the ##symbol table.
- There are two examples of how to populate the ##symbol table in the script below.
- The first example is for the following symbols: MSFT, NVDA, SIVB, BZUN, MMSI, MU. These are the six symbols used in the initial RSI tip. These symbols are used to collect trade outcomes with the new trading rules. A comparison of trading outcomes will be presented later for rules from the initial RSI tip and the new rules from this tip.
- The second example for populating the ##symbol table specifies sixteen additional non-overlapping symbols from those in the first example. This code for populating the ##symbol table is commented in the script below. To use the code for the set of sixteen symbols, you must remove (or inactivate) the comment markers for the second example, and expose (or activate) the comment markers for the first example. The new rules are based on adhoc analyses of trading outcomes from the prior RSI tip which used the symbols in the first example. This second set of symbols gives us a chance to see if the new rules have any validity for a fresh sample of stock symbols not examined for the preparation of new trading rules.
- Next, a declare statement declares and assigns values to support looping through a subsequent while statement.
- The @symbol_number local variable is initialized to one; this value is compared to pk column values within the condition clause for the while loop. It is also incremented by one at the end of each pass through the while loop.
- The @max_symbol_number is the maximum pk value in the ##symbol table.
- The @symbol local variable has a varchar data type that can hold up to five characters.
- Following the local variable declarations is the start of a while loop with a condition that continues the loop until the value of @symbol_number is greater than @max_symbol_number. Just prior to the end of each pass through the while loop is a statement that increments the value of @symbol_number by one.
- A begin…end block starts immediately after the while loop. Highlights of what happens in the block include the following.
- The @symbol local variable is set based on a select statement for the @symbol_number row number in the ##symbol table.
- A select statement with a preceding insert statement pumps a set of leaves oversold and leaves overbought reversal records for the @symbol local variable value into the ##rsi_reversal_trades table. See the initial RSI tip for an explanation of the code to generate the reversal cycle records.
- An exec statement invokes the generate_rsi_close_history_for_symbol stored procedure and passes the @symbol local variable as an input parameter.
- Another exec statement invokes the generate_buy_sell_prices_for_reversals_by_symbol stored procedure, which eventually adds rows to the ##sell_rows_from_#test2 table for trading outcomes based on the new trading rules.
- Just before the end statement in the begin…end block, a set statement increments the value of @symbol_number by one.
- After the value of #symbol_number is incremented beyond the maximum pk value in the ##symbol table, the while loop terminates, and the solution comes to a close with trading results saved in the ##sell_rows_from_#test2 table. Another script, which is presented in the next section, processes the values in the ##sell_rows_from_#test2 table.
use AllNasdaqTickerPricesfrom2014into2017
go

-- initialize the ##rsi_reversal_trades table

begin try
   drop table ##rsi_reversal_trades
end try
begin catch
   print '##rsi_reversal_trades not available to drop'
end catch

create table ##rsi_reversal_trades(
   symbol varchar(5)
  ,[date] [date]
  ,rsi real
  ,rsi_lag_1 real
  ,[close] money
  ,[source] varchar(20)
)

begin try
  drop table ##sell_rows_from_#test2
end try
begin catch
  print '##sell_rows_from_#test2 not available to drop'
end catch

create table ##sell_rows_from_#test2(
   row_number int
  ,symbol varchar(5)
  ,[date] [date]
  ,row_number_close money
  ,partition_close money
  ,percent_change real
  ,max_percent_change real
  ,change_from_max_percent_change real
  ,sell varchar(4)
)

-- create a fresh ##symbol table
begin try
  drop table ##symbol
end try
begin catch
  print '##symbol not available to drop'
end catch

create table ##symbol(
   symbol varchar(5)
  ,pk int
)

--/*
-- populate ##symbol from a list of symbols
-- with pk data type identifiers
-- use symbols from first rsi tip
insert into ##symbol
select 'MSFT', 1 pk
union
select 'NVDA', 2 pk
union
select 'SIVB', 3 pk
union
select 'BZUN', 4 pk
union
select 'MMSI', 5 pk
union
select 'MU', 6 pk
order by pk
--*/

/*
-- populate ##symbol from a list of symbols
-- with pk data type identifiers
-- use 16 symbols not from first rsi tip
insert into ##symbol
select 'INTC', 1 pk
union
select 'HTHT', 2 pk
union
select 'PCLN', 3 pk
union
select 'EBAY', 4 pk
union
select 'TIL', 5 pk
union
select 'HIIQ', 6 pk
union
select 'OCLR', 7 pk
union
select 'WB', 8 pk
union
select 'CARB', 9 pk
union
select 'NFLX', 10 pk
union
select 'BIDU', 11 pk
union
select 'TXN', 12 pk
union
select 'HAFC', 13 pk
union
select 'CRUS', 14 pk
union
select 'AAOI', 15 pk
union
select 'CORT', 16 pk
order by pk
*/

declare
   @symbol_number int = 1
  ,@max_symbol_number int = (select max(pk) from ##symbol)
  ,@symbol varchar(5)

-- loop through symbols in ##symbol to
-- populate ##rsi_reversal_trades with
-- leaves oversold and leaves overbought records
while @symbol_number <= @max_symbol_number
begin

  -- get all oversold through overbought trades for a stock symbol

  set @symbol = (select symbol from ##symbol where pk = @symbol_number)

  insert into ##rsi_reversal_trades
  -- to get all leaves oversold and leaves overbought
  select
    symbol
   ,date
   ,rsi
   ,rsi_lag_1
  ,[close]
  ,[source]
  from
  (
  select
    *
   ,lead(source,1) over (order by date) lead_source
   ,lag(source,1) over (order by date) lag_source
  from
  (
  -- rsi leaves oversold
  select *
  from
  (
  -- for lag analysis
  SELECT [symbol]
      ,[date]
      ,[rsi]
	  ,lag(rsi,1) over (order by date) rsi_lag_1
	  ,[close]
	  ,'leaves oversold' [source]
  FROM [AllNasdaqTickerPricesfrom2014into2017].[dbo].[rsi]
  where
  rsi is not null
  and symbol = @symbol
  ) for_rsi_lag_anal
  where rsi > 30 and rsi_lag_1 < 30

  union

  -- rsi leaves overbought
  select *
  from
  (
  -- for lag analysis
  SELECT [symbol]
        ,[date]
        ,[rsi]
        ,lag(rsi,1) over (order by date) rsi_lag_1
        ,[close]
        ,'leaves overbought' [source]
  FROM [AllNasdaqTickerPricesfrom2014into2017].[dbo].[rsi]
  where
  rsi is not null
  and
  symbol = @symbol
  ) for_rsi_lag_anal
  where rsi < 70 and rsi_lag_1 > 70
  ) for_oversolds_overboughts
  ) for_matched_pairs

  where
    date >=
    (
    -- get first date that qualifies for a trade
    -- by finding first oversold date
    select
      min (date)
    from
    (
    -- rsi leaves oversold
    select *
    from
    (
    -- for lag analysis
    SELECT [symbol]
      ,[date]
      ,[rsi]
      ,lag(rsi,1) over (order by date) rsi_lag_1
      ,[close]
      ,'leaves oversold' [source]
    FROM [AllNasdaqTickerPricesfrom2014into2017].[dbo].[rsi]
    where
    rsi is not null
    and
    symbol = @symbol
    ) for_rsi_lag_anal
  where rsi > 30 and rsi_lag_1 < 30
  ) for_first_qualifying_date
  )

  and date <=
  (
  -- get last date that qualifies for a trade
  -- by finding last overbought date
  select
    max(date)
  from
  (
  -- for lag analysis
  SELECT [symbol]
      ,[date]
      ,[rsi]
      ,lag(rsi,1) over (order by date) rsi_lag_1
      ,[close]
      ,'leaves overbought' [source]
  FROM [AllNasdaqTickerPricesfrom2014into2017].[dbo].[rsi]
  where
  rsi is not null
  and
  symbol = @symbol
  ) for_rsi_lag_anal
  where rsi < 70 and rsi_lag_1 > 70
  )
  order by  date asc

  -- call procedures to assign sell to sell column in #test2
  exec generate_rsi_close_history_for_symbol @symbol
  exec generate_buy_sell_prices_for_reversals_by_symbol

  -- update @symbol_number for next symbol in ##symbol
  set @symbol_number = @symbol_number + 1

end
The following script shows the create procedure statement for the generate_rsi_close_history_for_symbol stored procedure. Recall that the main purpose of this stored procedure is to create and populate the ##rsi_close_history table. The table adds key features to the ##rsi_reversal_trades table. The features are to move towards the generation of a data source that allows for the application of the custom rules described at the beginning of this section. Key features added include the following.
- Identifier values are added that denote the first record in a reversal cycle and a sequence number to denote each reversal cycle among the set of reversal cycles associated with a symbol; these identifier values allow you to track activity within the reversal cycles for a symbol.
- Row values from the rsi table in the AllNasdaqTickerPricesfrom2014into2017 database are inserted into the ##rsi_close_history table; the added row values contain RSI value and close price for trading days within reversal cycles; these are required to implement some of the customized trading rules.
The code within the generate_rsi_close_history_for_symbol stored procedure is very fully documented. Therefore, the commentary is at an overview level; please refer to comments within the scripts for additional details.
- The #starting_ending_leaves_overbought_dates table has one row per reversal cycle. This temporary table is for the symbol passed to the stored procedure with the symbol_in input parameter. See this tip for an introduction to the use of parameters with stored procedures.
- The row_number column within the #starting_ending_leaves_overbought_dates table contains an integer identifier number for the reversal cycles for a symbol.
- The ##rsi_close_history table has inputs from the following three sources
- the ##rsi_reversal_trades table
- the #starting_ending_leaves_overbought_dates table
- the rsi table within the AllNasdaqTickerPricesfrom2014into2017 database
- A while loop passes through reversal cycle identifier values for the symbol_in symbol value as it adds in selected records from rsi table for reversal cycles.
- When the while loop passes through the final reversal cycle identifier for a symbol, the stored procedure terminates and returns control to the master script in the rsi_buys_and_sells_from_list.sql file.
use AllNasdaqTickerPricesfrom2014into2017
go

create procedure [dbo].[generate_rsi_close_history_for_symbol]  @symbol_in varchar(5)

AS
BEGIN

  set nocount on;

  declare
     @symbol varchar(5) = @symbol_in
    ,@max_row_number smallint
    ,@current_row_number smallint

  -- #starting_ending_leaves_overbought_dates has one
  -- row for each reversal cycle for a symbol
  -- start_date and end_date are for date of
  -- first overbought record in each reversal
  -- row_number denotes reversal cycle number
  -- source data is from ##rsi_reversal_trades
  begin try
    drop table #starting_ending_leaves_overbought_dates
  end try
  begin catch
    print '#starting_ending_leaves_overbought_dates table not available to drop'
  end catch

  select
     starting_leaves_overbought.symbol
    ,starting_leaves_overbought.date [start_date]
    ,starting_leaves_overbought.rsi
    ,starting_leaves_overbought.[close] [close]
    ,ending_leaves_overbought.date end_date
    ,ending_leaves_overbought.row_number row_number
  into #starting_ending_leaves_overbought_dates
  from
  (
  -- get all starting leaves overbought
  -- get all leaves overbought
  -- immediately after leaves oversold
  select *, row_number() over (order by date) row_number
  from
  (
  -- get all records for @symbol
  -- along with lag and lead source values
  select
     symbol
    ,date
    ,rsi
    ,[close] [close]
    ,[source] [source]
    ,lag([source],1) over (order by date) source_lag_1
    ,lead([source],1) over (order by date) source_lead_1
  from ##rsi_reversal_trades
  where
  symbol = @symbol
  ) for_first_leaves_overbought
  where
  [source] = 'leaves overbought'
  and source_lag_1 = 'leaves oversold'
  ) starting_leaves_overbought

  inner join

  (
  -- get all ending leaves overbought
  -- get all leaves overbought
  -- immediately before leaves oversold
  -- or before is null source
  select *, row_number() over (order by date) row_number
  from
  (
  -- get all records for @symbol
  -- along with lag and lead source values
  select
     symbol
    ,date
    ,rsi
    ,[close] [close]
    ,[source] [source]
    ,lag([source],1) over (order by date) source_lag_1
    ,lead([source],1) over (order by date) source_lead_1
  from ##rsi_reversal_trades
  where
  symbol = @symbol
  ) for_last_leaves_overbought
  where
  [source] = 'leaves overbought'
  and
  (
  source_lead_1 = 'leaves oversold'
  or source_lead_1 is null
  )
  ) ending_leaves_overbought
  on
  starting_leaves_overbought.row_number = ending_leaves_overbought.row_number

  -- populate ##rsi_close_history records from
  -- ##rsi_reversal_trades table and
  -- #starting_ending_leaves_overbought_dates table
  -- and the rsi table

  -- ##rsi_close_history has at least two records
  -- for every reversal cycle for a symbol

  -- row_number 0 denotes the first leaves oversold
  -- record for a reversal cycle
  -- other row_number values indicate the reversal
  -- cycle number from the #starting_ending_leaves_overbought_dates table

  -- for reversal cycles with more than one leaves overbought record
  -- history of rsi table row values included from beginning
  -- leaves oversold record through last leaves overbought record

  begin try
    drop table ##rsi_close_history
  end try
  begin catch
    print '##rsi_close_history table not available to drop'
  end catch

  -- insert the beginning of all reversals
  -- all beginning reversals have source = leaves oversold
  -- and source_lag_1 is null or = leaves overbought
  select
    symbol
   ,date
   ,rsi
   ,[close] [close]
   ,0 row_number
  into ##rsi_close_history
  from
  (
  -- get all records for @symbol
  -- along with lag and lead source values
  select
     symbol
    ,date
    ,rsi
    ,[close] [close]
    ,[source] [source]
    ,lag([source],1) over (order by date) source_lag_1
    ,lead([source],1) over (order by date) source_lead_1
  from ##rsi_reversal_trades
  where
  symbol = @symbol
  ) for_last_leaves_overbought
  where
  [source] = 'leaves oversold'
  --/*
  and
  (
  source_lag_1 = 'leaves overbought'
  or source_lag_1 is null
  )

  -- add rows from rsi table
  -- set local variables for current value of @symbol
  set @max_row_number = (select max(row_number) from #starting_ending_leaves_overbought_dates)
  set @current_row_number = 1

  -- insert beginning overbought records
  -- and intermediate rsi records if
  -- there are overbought records following one another
  while @current_row_number <= @max_row_number
  begin

    if
    (select start_date from #starting_ending_leaves_overbought_dates where row_number = @current_row_number) =
    (select end_date from #starting_ending_leaves_overbought_dates where row_number = @current_row_number)
    begin
      insert into ##rsi_close_history
      select
         symbol
        ,start_date
        ,rsi
        ,[close]
        ,@current_row_number
      from #starting_ending_leaves_overbought_dates
      where row_number = @current_row_number
    end
    else
    begin
      -- insert multiple rows from rsi table
      -- based on start_date and end_date from
      -- for current row in
      -- #starting_ending_leaves_overbought_dates
      insert into ##rsi_close_history
      select
        symbol
       ,date
       ,rsi
       ,[close]
       ,@current_row_number
      from rsi
      where symbol = @symbol
      and date >= (select start_date from #starting_ending_leaves_overbought_dates where row_number = @current_row_number)
      and date <= (select end_date from #starting_ending_leaves_overbought_dates where row_number = @current_row_number)
      order by date
    end

    set @current_row_number = @current_row_number + 1

  end

end
go
The next script window contains the create procedure statement for the generate_buy_sell_prices_for_reversals_by_symbol stored procedure. As with the other stored procedure in this tip, it is copiously commented so that overview comments in the tip complement the detailed comments in the create procedure statement. Recall that this stored procedure has two main objectives (implementing customized trading rules and saving trade outcomes). In order to implement its objectives, the procedure starts by sequentially populating two temporary tables (#test and #test2).
- The code to populate #test computes the percent change in close price from the first leaves oversold record within a reversal cycle and the current date where the current date is each successive trading date after the date of the first leaves oversold record.
- The source for #test consists of two subqueries that are left joined together.
- Each subquery is based on the ##rsi_close_history table.
- The first query derives values for rows with non-zero row_number values; these are rows after the initial leaves oversold record within a reversal cycle.
- The second query derives values for rows with zero row_number values; these are the initial leaves oversold records within a reversal cycle.
- Notice the use of the partition by clause in the row_number function for partitioning the records within reversal cycles. You can learn more about how to use the partition by clause with the row_number function from these links (here and here).
- Row_number column values have two distinct uses in the code to populate the #test table (as well as the #test2 table).
- When used in reference to the ##rsi_close_history table, row_number column values designate reversal cycles.
- When used to denote column values within either the #test or #test2 tables row_number values represent the sequential order based on date of a row within a reversal cycle.
- The code to populate #test2 computes two additional values based on the #test table. Additionally, the code to populate #test2 populates the sell column based on the first two customized trading rules.
- The max_percent_change column is populated for each row in the table based on a max function for the percent_change column with a partition by clause based on row_number identifying reversal cycles and ordered by date. Each row in the max_percent_change column contains the maximum gain within the partition through the date for the current row in the table.
- The change_from_max_percent_change column value is computed as the percent_change column value less the expression for the max_percent_change column value. This metric tells you in percentage point terms how much you have lost from the maximum price within a reversal cycle as of the date for the current row.
- A case statement in the code to populate #test2 assigns values based on the first two customized trading rules and prepares the sell column for code implementing the remaining two customized trading rules.,
- The first when clause in the case statement assigns the string value "sell" to the sell column for the first row where the percent_change is less than 20 percent of the buy price. This customized trading rule is to help restrict losses from a trade to not be much more than twenty percent. This rule can activate when a consecutive series of leaves oversold records precede the first leaves overbought record so that the percent change for the first leaves overbought record is more than 20 percent below the close price for the first leaves oversold record.
- The second when clause uses the lead function and lag function to detect when a row is for the first and only leaves overbought record within a reversal cycle. When it discovers a first and only leaves overbought record, then the string "sell" is assigned to the sell column for the row. This clause implements the second customized trading rule.
- If the condition for neither of the two when clauses in the case statement are met, then the sell column value for the #test2 table is explicitly set to null.
- After the code to initially populate the #test2 table for the first two customized trading rules, another block of code searches for rows in the #test2 that match the criteria for third rule.
- The code for the third rule searches to find rows that match the criteria for the rule among the rows for reverse cycles that do not already have a "sell" assigned to a row.
- If it finds a row set, it computes the date and row_number values in the set that should have a "sell" assigned to its sell column.
- Then, it performs the assignment with an update statement.
- After each update, it checks to see if there are any more row sets that match the criteria for the third custom trading rule.
- If the search is successful, the code logs the outcome to the Messages tab and uses a T-SQL goto command to transfer control to a code block searching for the date and row_number values of the next row to update with a "sell" assignment. The "update_for_change_from_max_percent_change_lt_minus_20_criterion" label is assigned to the first line of code in the code block.
- If the search is not successful, then this alternative outcome is logged to the Messages tab and control transfers to the next block of code.
- The last block of code for "sell" assignments merely searches for reversal cycle row sets that do not yet have a "sell" assignment.
- Any reversal cycle row set without a "sell" assignment receives updates for four fields for the last leaves overbought record. The four fields that are updated include: row_number_close, sell, percent_change, and change_from_max_percent_change.
- Of course, the sell column value is set to "sell".
- The row_number_close column value, which is set to (max_close - partition_close)*.6 + partition_close where max_close is the maximum close price in the row set from the buy price and partition_close is the buy price.
- After implementing all four custom trading rules, one last block of code transfers all #test2 rows with a value of "sell" in the sell column to ##sell_rows_from_#test2 table. This is to persist the data for accounting purposes. Sample accounting demonstrations using ##sell_rows_from_#test2 rows are presented in the next section.
use AllNasdaqTickerPricesfrom2014into2017
go


create procedure [dbo].[generate_buy_sell_prices_for_reversals_by_symbol]
as
begin
  -- SET NOCOUNT ON added to prevent extra result sets from
  -- interfering with SELECT statements.
  SET NOCOUNT ON;

  -- create and populate table (#test) for percent_change
  -- from first leave oversold in reversals

  begin try
    drop table #test
  end try
  begin catch
    print '#test not available to drop'
  end catch

  -- percent_change within partition
  select
    non_zero_row_numbers.row_number
   ,non_zero_row_numbers.symbol symbol
   ,non_zero_row_numbers.date [date]
   ,non_zero_row_numbers.rsi
   ,non_zero_row_numbers.[close] row_number_close
   ,zero_row_numbers.[close] partition_close
   ,
  (
  (
  cast(non_zero_row_numbers.[close] as real)
  /
  cast(zero_row_numbers.[close] as real)
  )
  -1)*100 percent_change
  into #test
  from
  (
  -- non-zero row_number records by paritition_rn
  select
    --*
    symbol
   ,date
   ,rsi
   ,[close]
   ,[row_number] [row_number]
   ,row_number() over(partition by row_number order by date) partition_rn
  from ##rsi_close_history
  where row_number != 0
  ) non_zero_row_numbers

  left join

  (
  -- zero row_number records by paritition_rn
  select
    symbol
   ,date
   ,rsi
   ,[close]
   ,row_number
   ,row_number() over(partition by row_number order by date) partition_rn
  from ##rsi_close_history
  where row_number = 0
  ) zero_row_numbers
  on non_zero_row_numbers.row_number = zero_row_numbers.partition_rn
  --where non_zero_row_numbers.partition_rn = 1 and zero_row_numbers.partition_rn = 1
  order by non_zero_row_numbers.date

  -- populate #test2 based on #test
  -- and logic described below

  -- assign sells for 1a and 1b rules

  -- rule 1a assigns 'sell' to sell column
  -- when percent_change less than -20
  -- for the first leaves overbought date

  -- rule 1b assigns 'sell' to sell column
  -- when there is just a sole leaves overbought
  -- record to a reversal cycle as
  -- denoted by a row_number value
  -- if rules 1a and 1b do not apply
  -- assign null to sell column

  -- in addition to sell column add a
  -- max_percent_change column and
  -- change_from_max_percent_change
  -- max_percent_change is maximum percent_change
  -- value with the same row_number for a symbol
  -- change_from_max_percent change is
  -- percent_change less - max_percent_change

  -- to #test2 table add max_percent_change
  -- and change_from_max_percent_change
  -- also add and populate sell rows to sell column
  -- for change_from_max_percent_change decline of
  -- more than 20 percent or
  -- only one leaves overbought record in a reversal

  begin try
    drop table #test2
  end try
  begin catch
    print '#test2 not available to drop'
  end catch

  -- read temp table with percent_change
  select
     row_number
    ,symbol
    ,[date]
    ,row_number_close
    ,partition_close
    ,percent_change
    ,max(percent_change) over(partition by row_number order by date) max_percent_change
    ,percent_change
    -
    max(percent_change) over(partition by row_number order by date) change_from_max_percent_change
    ,
   case
     -- implements rule 1a
     when percent_change < -20 and date = min(date) over (partition by row_number order by date) then 'sell'
     -- implements rule 1b
     when
      lag(row_number,1) over (partition by row_number order by date) is null
      and lead(row_number,1) over (partition by row_number order by date) is null
      then 'sell'
      else null
    end sell

  into #test2

  from #test
  order by row_number, date

  ----------------------------------------------------------------------------------------

  -- process #test2 rows in sets of multiple
  -- leaves overbought records for a symbol
  -- so that 'sell' is assigned to sell column for
  -- first row with percent_change less max_percent_change
  -- having a value more negative than -20

  -- this is label for goto loop
  update_for_change_from_max_percent_change_lt_minus_20_criterion:
  -- date for target sell to update
  declare @date_for_sell_b4_update date =
  (select date from #test2
  where
  date =
  (
  -- row_number with min_date for change_from_max_percent_change < -20
  select top 1 min(date) over (partition by row_number order by date)
  from #test2
  where
  row_number in
  (
  select distinct row_number from #test2
  where row_number not in (select distinct row_number from #test2 where sell is not null)
  )
  and sell is null
  and change_from_max_percent_change < -20)
  )

  -- row_number for target sell to update
  declare @row_number_for_sell_b4_update bigint =
  (select row_number from #test2
  where
  date =
  (
  -- row_number with min_date for change_from_max_percent_change < -20
  select top 1 min(date) over (partition by row_number order by date)
  from #test2
  where
  row_number in
  (
  select distinct row_number from #test2
  where row_number not in (select distinct row_number from #test2 where sell is not null)
  )
  and sell is null
  and change_from_max_percent_change < -20)
  )

  -- perform update
  update #test2
  set sell = 'sell'
  where
  date = @date_for_sell_b4_update
  and row_number = @row_number_for_sell_b4_update

  -- loop back to instruction with
  -- update_for_change_from_max_percent_change_lt_minus_20_criterion label
  -- if there are additional records to process
  if
  (select count(*)
  from #test2
  where
  row_number in (select distinct row_number from #test2)
  and row_number != @row_number_for_sell_b4_update
  and sell is null
  and change_from_max_percent_change < -20
  ) = 0
  begin
   print 'no more to change for change_from_max_percent_change < -20 criterion'
  end
  else
  begin
    print 'there are targets remaining to be changed for change_from_max_percent_change < -20 criterion'
    goto update_for_change_from_max_percent_change_lt_minus_20_criterion;
  end

  --*/
  -----------------------------------------------------------------------------------------------------

  -- this last section is for all #test2 rows that are not processed
  -- by a prior rule to designate a 'sell' row in the sell column

  -- perform update for 60% of max close
  -- on normal exit from leave overbought with no more
  update #test2

  set row_number_close = (max_close - partition_close)*.6 + partition_close,
    sell = 'sell',
    percent_change = 0,
    change_from_max_percent_change = 0


  -- from clause for join to #test2
  from

  (
  -- get max_close rows
  select
    row_number
   ,symbol
   ,max(row_number_close) max_close
   ,max(date) last_date
  from #test2
  where row_number in
  (
  -- row_number values without a sell
  select distinct row_number from #test2
  where sell is null

  except

  select row_number from #test2
  where sell = 'sell'
  )
  group by
   row_number
  ,symbol
  ) for_nu_row_number_close
  inner join #test2
  on #test2.symbol = for_nu_row_number_close.symbol
  and #test2.date = for_nu_row_number_close.last_date
  and #test2.row_number = for_nu_row_number_close.row_number

  -- insert sell rows from #test2
  -- into ##sell_rows_from_#test2

  -- row_number_close = sell price
  -- partition_close = buy price

  insert into ##sell_rows_from_#test2
  select *
  from #test2 where sell = 'sell'

end
go
How do the customized rules perform?
There are two elements to follow to see how any set of customized trading rules perform.
- First, you need the change amount from the buy price to the sell price. If the price rises from when a stock was bought relative to when it was sold that is a positive outcome.
- Second, you can benefit from the average buy price and average percent change.
- If a stock symbol has more than one reversal, then the average buy price is the average price in initial leave oversold records for all reversal cycles for a stock.
- The average percent change is the sum of the change amounts for each reversal divided by the average buy price.
The following script shows how to compute the sum of the changes and average percent changes from the ##sell_rows_from_#test2 table. The script resides in the "rsi buy and sell overall summary results for stocks.sql" file. As you can see, there are two parts to the script.
- An inner query gathers reversal cycle data for symbols.
- There is a separate row within the ##sell_rows_from_#test2 table for each reversal cycle for each stock symbol.
- The partition_close column denotes the buy price and the row_number_close column denotes the sell price.
- The inner query computes a change amount for each reversal cycle.
- The inner query also extracts the partition_close column values (buy prices) for processing in the outer query.
- The outer query provides summary results for each symbol in the ##sell_rows_from_#test2 table.
- The group by clause for the query facilitates the aggregation of results by symbol.
- The sum aggregate function for the change_amount column from the inner query result set computes the total of gains and losses for a symbol across its reversal cycles.
- The avg aggregate function for partition_close column from the inner query result set computes the average buy price across reversal cycles for a stock.
- The expression dividing the sum of the change amounts by the average buy price computes the average percent change.
-- overall percent change for stock symbols in ##sell_rows_from_#test2
select
   symbol
  ,sum(change_amount) sum_of_changes
  ,avg(partition_close) average_buy_price
  ,round(sum(change_amount)/avg(partition_close)*100,2) percent_change
from
  (
  -- gather reversal cycle data for stock symbols
  select
    symbol
   ,date
   ,row_number_close
   ,partition_close
   ,(row_number_close - partition_close) change_amount
   ,round(cast((row_number_close - partition_close)as real)/cast(partition_close as real) * 100,2) change_percent
  from ##sell_rows_from_#test2
  ) for_summary
group by symbol
order by round(sum(change_amount)/avg(partition_close)*100,2)
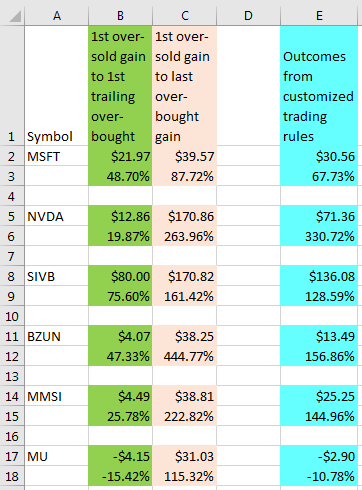
The results from the above query may best be interpreted by comparing them to the outcome of the same computations for the base trading rules. The following screen shot from the rsi_buys_and_sells_refine.xlsx workbook file shows a comparison of the customized trading rule outcomes relative to base RSI trading rules.
- The cells with a green background are for the base RSI trading rules and the cells with the aqua background are for the customized trading rules from this tip. The cells with a beige background are for a variation from the RSI base trading rules described in the prior RSI tip.
- The top value within a colored pair of cells is for the sum of the change amounts; the bottom value in a colored pair of cells is for the average percent change.
- The base RSI trading rules is to buy a stock at the first leaves oversold record within a reversal cycle and to sell a stock at the first leaves overbought record.
- The variation of the base trading rule from the prior RSI tip is to sell a stock at the last leaves overbought record in a reversal cycle. This record can be easily detected from an analysis perspective after all the results are available, but before all the buys and sells are finished there is no definitive signal for which leaves overbought record in a reversal cycle is the last one.
- There are four customized trading rules reviewed in this tip.
- The rules are briefly described at the top of the "Customized rules for picking sell dates within reversal cycles" section.
- Then, the code for implementing the rules are described in the body of the "Customized rules for picking sell dates within reversal cycles" section.
The change amounts with an aqua background are always more positive than change amounts with a green background. In other words, the customized trading rules always generated better trading outcomes than the base trading rules. The gains are per share of stock. Recall stock traders typically trade more than one share of stock. The degree of advantage for change amount irrespective of how many shares are purchased is indicated by the average change percent.
- The largest two change amount advantages were for the NVDA and SIVB stock symbols.
- The average percentage change was much greater for the NVDA stock symbol than any other stock symbol. This is for a combination of reasons.
- As already mentioned, NVDA had a large change amount gain per share.
- Also, the average buy price for NVDA was proportionately smaller than for the other stocks.
Instead of individual stock symbol comparisons, you can examine the change across all stock symbols in the ##sell_rows_from_#test2 table. The median average percent gain for the base rules is 36.55%. On the other hand, the median average percent gain for the customized rules is 136.78%!
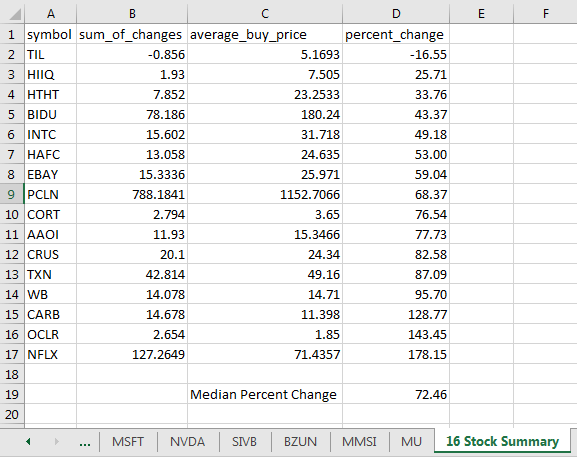
The next screen shot shows the 16 Stock Summary tab from the rsi_buys_and_sells_refine.xlsx workbook file. The columns in tab correspond to the result set from the preceding script file. The results are for the sixteen-stock-symbol set from the rsi_buys_and_sells_from_list.sql file. After running that script, I ran script in the "rsi buy and sell overall summary results for stocks.sql" file to generate the result set that appears in the following screen shot. After copying the result set to the tab, I manually computed the median average percent change across the sixteen stock symbols. This time the median gain was nearly 72.5 percent. This outcome falls in between the median average percent change for the original six stock symbols with the basic trading rules versus the customized trading rules. The customized trading rules clearly generate superior trading results whether for the original six stocks or the reserve set of sixteen other stock symbols.
Next Steps
There are three steps necessary for trying out the scripts from this tip.
- First, you need to download either the full version of the AllNasdaqTickerPricesfrom2014into2017 database from this tip or the abbreviated version of the database from this other tip.
- Next, you need to download the script file from the prior RSI tip on how to create and populate the rsi table for all stocks in the database. Then, run the script to update the database with whichever version you downloaded.
- The third step is to download the scripts for this tip. The link will let you download the four T-SQL scripts displayed in this tip as well as the Excel workbook file from which excerpts were shown in the tip.
After you get the code working as described in this tip, you are encouraged to modify the trading rules. The first customized trading rule waits until the first leaves overbought record before checking if the loss is greater than twenty percent from the initial leaves oversold record. However, you can check after each consecutive leaves oversold record following the initial leaves oversold record. This variation offers the potential of getting you out of a losing trade sooner than the first customized trading rule.
Finally, I close by indicating that this tip is not recommending any particular stocks, including those for which results are reported in this tip nor is it recommending any specific trading rules. The stocks reported on in this tip were selected because I had been watching them as part of my normal investing due diligence and because they are in the AllNasdaqTickerPricesfrom2014into2017 database. At the time that I submitted this tip to MSSQLTips.com, I and my family members held positions in a subset of these stocks. I do occasionally use selected technical indicators, including the RSI, in making decisions about which stocks to buy and when to sell stocks, but I do not routinely use the precise trading rules covered in this tip.


About the author
 Rick Dobson is an author and an individual trader. He is also a SQL Server professional with decades of T-SQL experience that includes authoring books, running a national seminar practice, working for businesses on finance and healthcare development projects, and serving as a regular contributor to MSSQLTips.com. He has been growing his Python skills for more than the past half decade -- especially for data visualization and ETL tasks with JSON and CSV files. His most recent professional passions include financial time series data and analyses, AI models, and statistics. He believes the proper application of these skills can help traders and investors to make more profitable decisions.
This author pledges the content of this article is based on professional experience and not AI generated.
View all my tips
