By: Rick Dobson | Comments (3) | Related: > Python
Problem
Please provide several demonstrations for collecting stock data with Python. In addition to learning how to collect open-high-low-close-volume (ohlcv) data from a start date through an end date, I want to learn about collecting other stock data, such as stock dividends and splits as well as how to discover the sector and the industry for a stock. Include in the examples, code to display collected data as a printed report as well as save collected data in a csv file.
Solution
I have written and presented webinars about collecting stock market data several times over the years. Because of the evolving state of best practices for the activity, it seems that there is always something new and useful to share with fellow developers. There is a growing interest in Python among SQL Server analysts for collecting and storing stock data as well as other kinds of use cases. This tip exposes you to Python programming techniques that can facilitate the collection of any kind of time series data, such as weather observations and labor statistics.
The approach used in this tip is one that shows you short blocks of Python code along with a brief summary of each line or set of lines followed by a display of the output from the Python code. By tying the code to the output and building successively more powerful code blocks, you are empowered to acquire a core set of Python skills that goes beyond the basics – particularly for collecting data about stocks.
This tip has three key sections.
- The first section shows how to print a report for data collected for a single stock with the pandas library.
- The second section illustrates how to use the yfinance library for the same objectives as the first section. Additionally, this section covers the retrieval of additional types of stock data than those available from the pandas library. The yfinance library is not as extensively documented as the pandas library. Here are a couple of links with some documentation for yfinance (here and here).
- The third section reviews a Python script for downloading ohlcv data from two or more stock symbols and saving the results in a comparable format within a single file across symbols. Because this script has the capability for collecting data for thousands of stock symbols, it illustrates how to handle incompatibilities between its source for stock symbols and its source for collecting stock data.
The source for all stock data in this tip is Yahoo Finance.
Working with the pandas data library
This section presents some sample historical stock price and volume data from the Yahoo Finance website along with four script files that show progressive improvements on how to retrieve the data with Python and the pandas library.
First try at getting historical data for a stock with pandas
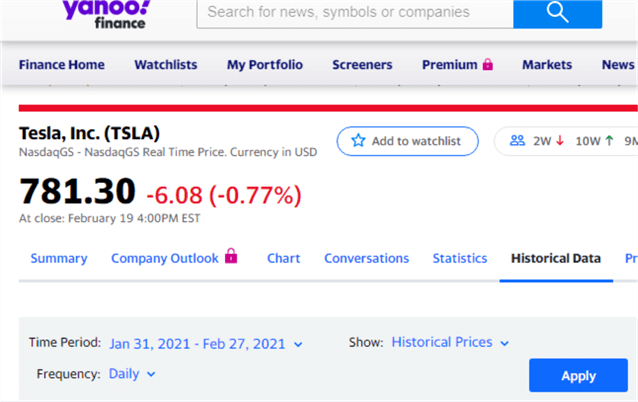
Here are a couple of screen shots from the Yahoo Finance website that illustrate the results from a manual search to retrieve historical price and volume data for a ticker symbol. The company is Tesla, a well-known electric vehicle manufacturing company, and its stock symbol is tsla.
- Put tsla in the search box at the top of the screen in the Yahoo Finance website.
- Next, click Historical Data to indicate you want historical data from Yahoo Finance.
- Then, specify start and end dates for the historical data that you want. I input start and end dates of February 1, 2021 and February 28,2021, respectively, but Yahoo Finance indicated a Time Period of Jan 31, 2021 through Feb 27,2021.
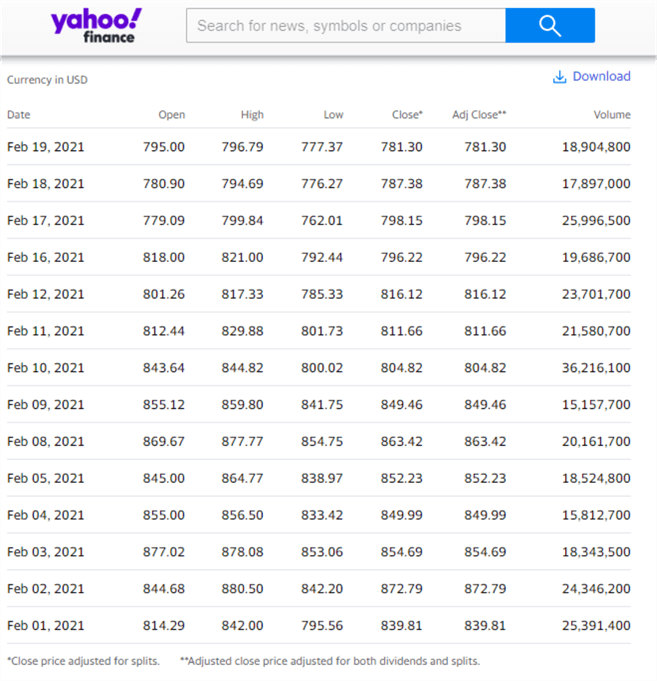
After you click the Apply button, Yahoo Finance returns the historical data. Here is an image of the requested historical data from Yahoo Finance. The Adj Close column is rarely used by those tracking historical stock prices. The definitions for Close and Adj Close appear at the bottom of the screen shot.
- Notice that the reported data are from February 1, 2021 through February 19, 2021.
- So, the returned data honored my request to start historical data from February 1, 2021. The data were requested after the close of trading on February 19, 2021.
- The only dates appearing are for days when the stock is trading. In other words, Saturdays and Sundays are excluded as well as holidays, such as President's Day on February 15, 2021.
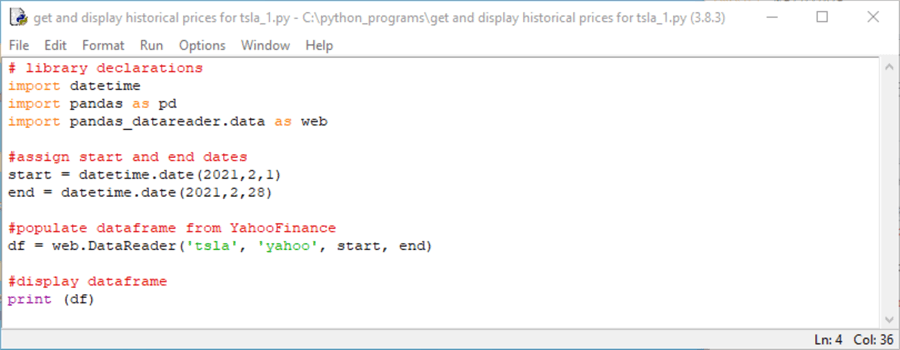
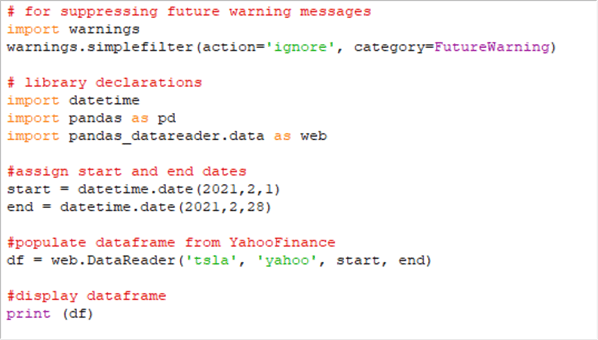
Here is a screen shot of a Python script for returning the same data range without going through the Yahoo Finance user interface. The code appears in an IDLE window. IDLE downloads automatically when you install Python from Python.org. IDLE is one of several developer environments for writing, saving, and running Python scripts. SQL Server professionals may find it useful to think of IDLE as a kind of an SSMS for Python code.
- The top border of the screen shot shows the Python script's file name (get and display historical prices for tsla_1.py) and path name (c:\ python_programs) along with the Python version number (3.8.3) that is running the script. The file type for a Python script file is py.
- There are four major parts to the script.
- First, several libraries are referenced. Python often enables powerful custom applications through code libraries, pandas and pandas_datareader. The name datetime is for a built-in Python library, which is sometimes referred to as a code module.
- Second, the datetime library is used to assign date values to Python objects named start and end.
- Third, the pandas datareader library is used to download historical price and volume data to a dataframe (df) object. A dataframe in Python is a data structure available from pandas that facilitates operations on numerical tables and time series.
- Fourth, the Python print statement displays the df object in IDLE.
- The datareader object named web in the third part makes a connection to
Yahoo Finance and passes parameters to
an application
programming interface (API) on Yahoo Finance.
- The parameters specify the ticker symbol (tsla) and date range for which to collect historical price and volume data.
- The yahoo parameter specifies that the historical data should be collected from Yahoo Finance. The list of data sources for the pandas datareader changes from time to time. For example, pandas datareader used to work with Google Finance, but Google discontinued its API to support this functionality. Other data sources for stock historical price and volume data that have or currently still do support pandas datareader include Alpha Vantage, Quandl, and IEX.
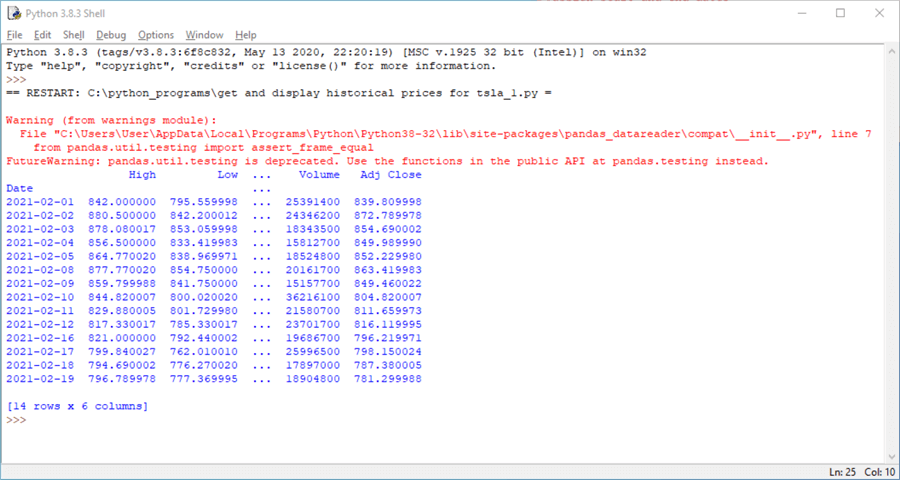
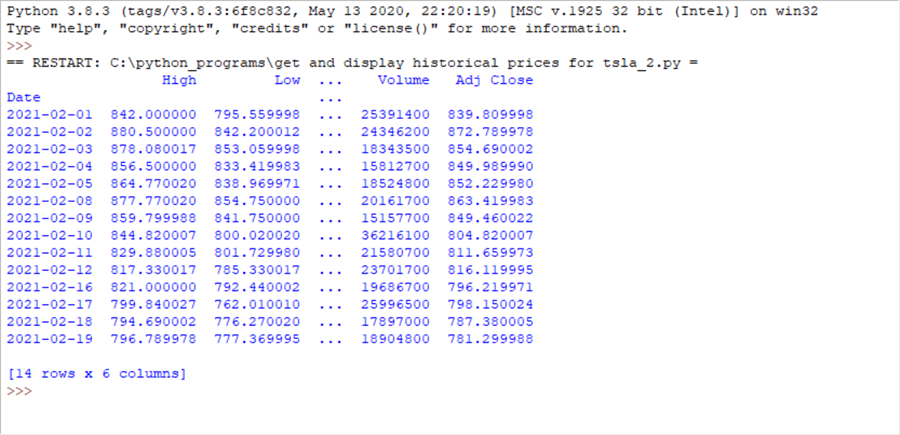
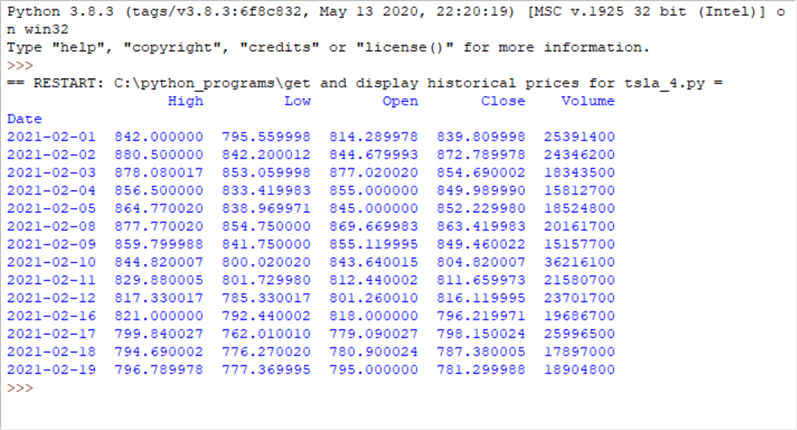
You can run the code in the preceding window by clicking Run, Run Module or by pressing the F5 key on your keyboard. The next screen shot shows the results from running the preceding script. This display is from another IDLE window that opens after the code completes running.
- There is a warning message in red towards the top of the screen. This message is a distraction because it does not indicate anything that it is currently wrong based on user-developed code with the 3.8.3 version of Python running the script.
- Below the warning message is the index column (date) and four data columns
for the dataframe.
- The date column is in the dataframe, but Python does not consider it a data column. Instead, date is an index column.
- Towards the bottom of the screen, text indicates that there are 14 rows in the dataframe and 6 data columns.
- The two missing columns are named Open and Close. Unless you specify special optional settings, Python will frequently not display data for all columns.
Second try at getting historical data for a stock with pandas
The screen shot below shows just the code window from IDLE for a modified version of the preceding script. The import warnings statement at the top of the script allows you to specify different types of actions for different categories of warnings. In this case, the instruction is to ignore FutureWarning messages so that they do not appear in the output for a script.
Here is the output window from the preceding code window. Notice the FutureWarning message does not appear in red towards the top of the output window. Otherwise, the output is the same as in the preceding sub-section.
Third try at getting historical data for a stock with pandas
The following code window shows an additional line of code added to the script from the preceding sub-section. The new line is the next to last one that specifies the options.display.width setting. By assigning 0 to the setting, all the data columns appear in the results window.
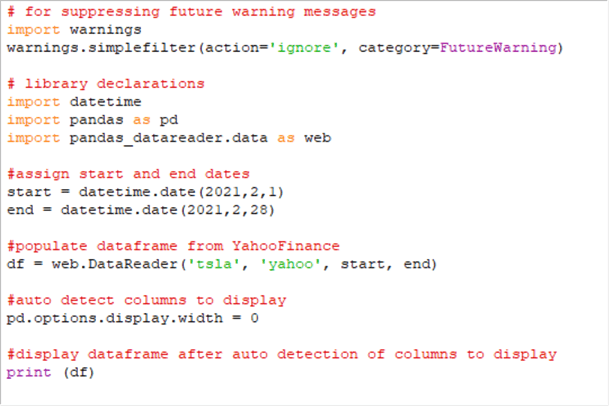
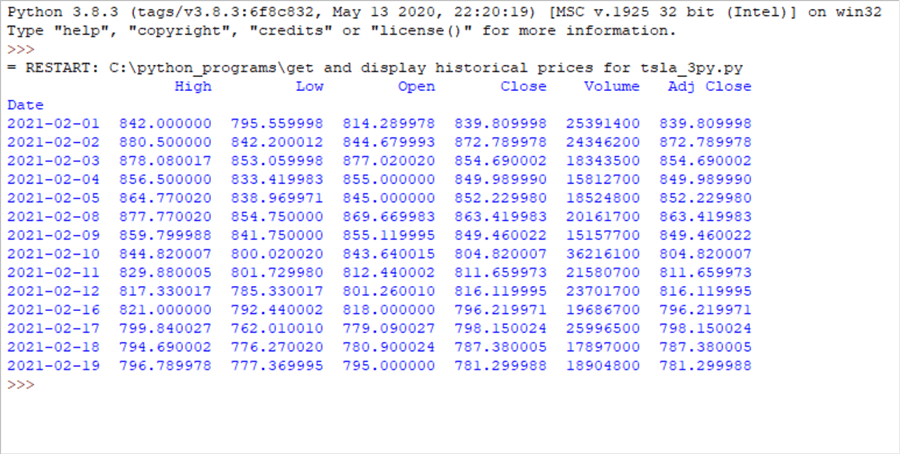
Here is the output window. Notice all six data columns plus the date index column appear in the output. Also, observe that there is no comment line reporting the number of data columns. This is because the assignment of 0 to the options.display.width setting causes all data columns to appear.
Fourth try at getting historical data for a stock with pandas
The next screen shot shows one final line of code added to the script just before the final line with the instruction to print the dataframe. The new line of code instructs pandas to drop a data column from the data frame. The new line of code names the column to drop (Adj Close). If the value of axis in the new line were 0, the index column could be dropped from the dataframe.
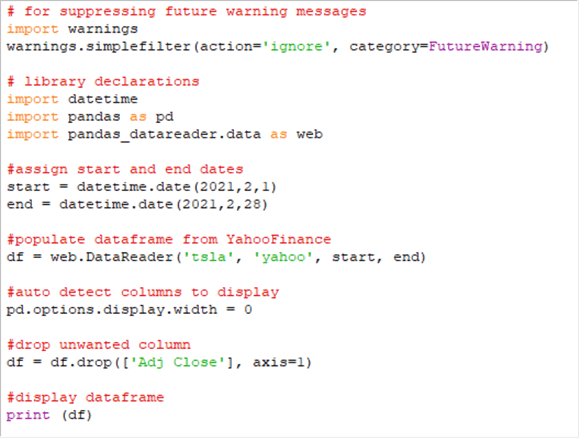
Here is the final output window from this code example. Notice that there are just 5 data columns because the Adj Close data column is dropped from the dataframe.
Working with the yfinance library
This section shows three Python script files on how to extract information about stocks with the yfinance library. You will see examples that show a couple of different techniques for collecting historical price and volume data as well as other techniques for collecting additional kinds of stock data.
First try at getting stock data with yfinance
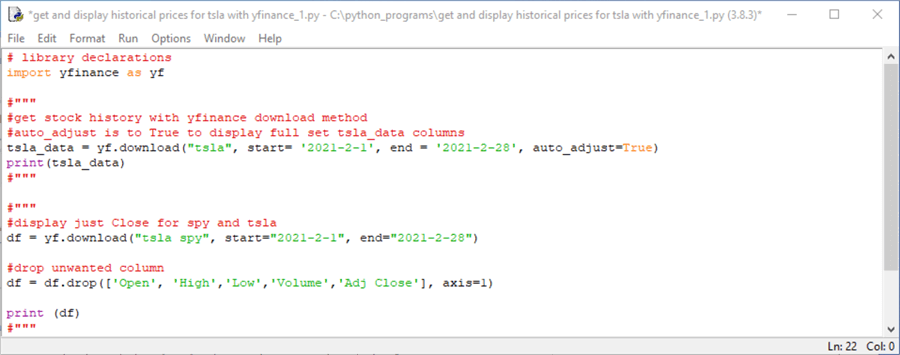
The following Python script file (get and display historical prices for tsla with yfinance_1.py) contains three code blocks.
- The first code block contains a single line of code that starts with import.
This line of code makes the yfinance library available to the remaining code
in the script.
- As you may have suspected from reviewing the code in the prior section, the # sign in Python scripts makes the following text on the same line a comment. You can also comment out code from a single line by preceding the code line with #.
- Three quote marks ('""") begin a multi-line comment section. The comment section ends with the next instance of three quote marks.
- If a multi-line comment marker is immediately preceded by a single line comment marker, then its ability to begin or end a multi-line comment section is commented out.
- The second section is the first code block after the first line of code.
This section is delimited by two commented out multi-line comment markers (#""").
- This block of code can download and print historical price and volume data for the tsla stock symbol (sometimes called a ticker). The date range for the historical data can extend from the start parameter through the end parameter. However, if historical data does exist through the end parameter, then it ends at the last date before the end parameter for which data is available.
- The code block demonstrates a basic use of the download method of the
yfinance library, which has an alias of yf. The download method
assigns its results to a dataframe named tsla_data. The arguments for the
download method are in order of appearance
- tsla, which is the symbol name
- start, which is a string value denoting the start date for the historical data
- end, which is a string value denoting the latest possible end date for the historical data
- auto_adjust, which has a setting of True to enable Python to display all columns in the tsla_data dataframe with a print command.
- The code block ends with a print command that displays the values in the tsla_data dataframe.
- The third section is the last code block bounded by commented out multi-line
comment markers.
- This code block can download and print for two stock symbols (tsla and spy) historical price and volume data.
- This code block also uses the yfinance download method, but the syntax
for the download method has two variations from the preceding section.
- First, it shows one approach to designating two symbols (tsla and spy) in a single invocation of the download method.
- Second, the download method does not assign True to auto_adjust argument.
- The drop method is invoked for the df dataframe. Notice that there is no import statement in the Python script for the pandas library. Therefore, the df dataframe from yfinance library conforms to pandas library conventions. The syntax in the third code block drops the designated data columns from the results for each stock symbol.
- This code block ends with a print command that displays the Close prices for the tsla and spy symbols across all trading dates for which there are historical Close price values in February 2021.
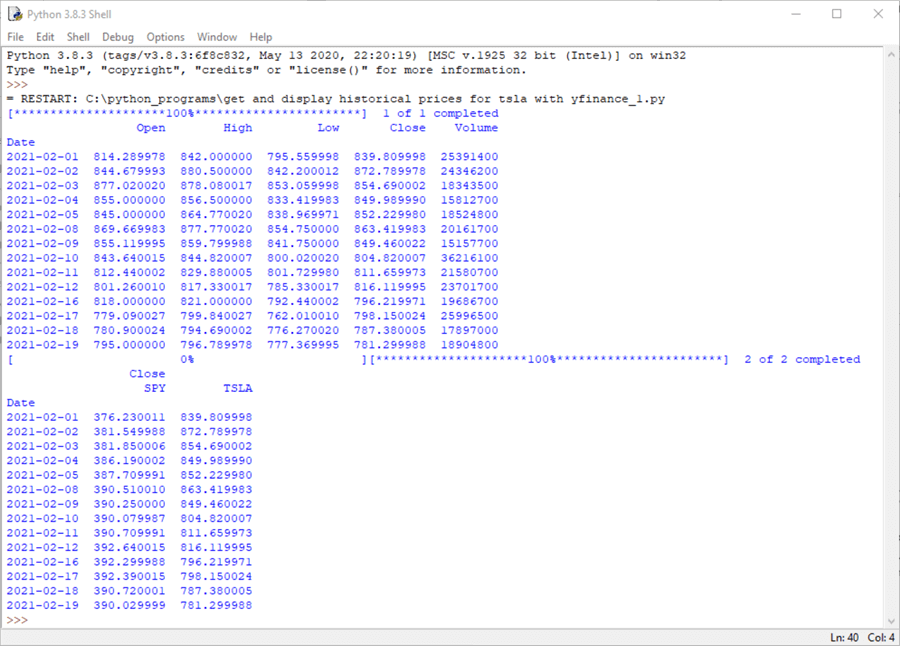
The next screen shot shows the results that will appear from running the preceding script file from the Python IDLE application; recall that you can do this as simply as pressing the F5 function key on your keyboard. There are two results sets in the Python output window.
- The first results set has historical data from the first download method in the preceding script. These data are for the tsla symbol, and the results run through February 19, 2021. The script to generate the results was run on weekend immediately after Friday, February 19.
- The second results set shows historical Close prices for the spy and tsla symbols from the beginning of February through February 19, 2021.
Second try at getting stock data with yfinance
The Python script below illustrates three approaches to collecting historical stock data with the history method for a ticker object defined via the Ticker method from the yfinance library.
- This script commences by referencing both the yfinance and pandas libraries.
- Next, the yfinance Ticker method creates a ticker object for the tsla symbol; the object has the name tsla.
- Six comment lines provide some background on the objectives and techniques illustrated in the script.
- Next, three different invocations of the history method are demonstrated
with preceding single line comment markers (#). These lines are meant
to be run in three successive runs of the script. Just remove the comment
sign at the start of each line in order to run that line; only attempt to run
one line at a time.
- The first of the three lines demonstrates the period parameter for the history method. The period parameter is set equal to max. This parameter value for the history method starts returning historical stock records from the first date for a symbol in Yahoo Finance through the most recent date, which is February 19, 2021 with this tip because the script was run on the weekend after February 19, 2021.
- The second of the three lines can be run by removing the comment marker
from the beginning of the second line and re-inserting the comment market
from the beginning of the first line.
- The start and end parameters specify the start and end dates for which historical data is to be collected.
- The interval parameter sets the interval to 30m, which is for reporting historical values at 30-minute intervals within each trading date from the start date through the end date. You can use other settings for interval to return values for other minute and hour intervals within trading dates or even across sets of trading dates, such as 5-day, calendar week, and monthly intervals.
- The last parameter in the second illustration of the history method assigns the value False to the actions parameters. The default value for the actions parameter is True. This parameter controls whether the returned historical stock data includes columns for Dividends and Stock Splits.
- The third of the three lines can also be run by removing the comment
marker preceding the third line and re-inserting the comment market from
the beginning of the previous line run.
- The parameter values in the third line are the same as those in the second line with one exception.
- The exception is for the prepost parameter, which appears only on
the third line.
- When the prepost parameter has a value of True, which is the case in the following script, then the history method returns historical data from pre-market and post-market intervals outside of the normal trading day.
- The default value for the prepost parameter has a default value of False.
- After the three history method examples, there are two pandas settings lines
followed by a Python print command for the tsla_history Python object.
- The two pandas settings are to format the printing of tsla ticker object
populated by history method.
- The first setting makes the console display wide enough to show all columns from the preceding history method.
- The second setting is to allow the display of all rows returned by the preceding history method. For example, the maximum number of rows can be up to 20000. You can adjust this to a larger number of rows if required.
- The print command displays the tsla_history object populated by the preceding, uncommented history method.
- The two pandas settings are to format the printing of tsla ticker object
populated by history method.
import yfinance as yf
import pandas as pd

#assign Ticker to Python object named tsla
tsla = yf.Ticker('tsla')

#populate yfinance output with maximum periods for tsla
#among the history options are: period, start, end, interval,
#prepost, and actions

#you can also configure the width and rows returned
#for example, these settings return all columns
#and up to 20000 rows

#three different history examples
#tsla_history = tsla.history(period="max")
#tsla_history = tsla.history(start="2021-2-1", end="2021-2-28",interval="30m", actions = False)
#tsla_history = tsla.history(start="2021-2-1", end="2021-2-28",interval="30m",prepost = True, actions = False)

pd.options.display.width = 0
pd.set_option("display.max_rows",20000)

print (tsla_history)
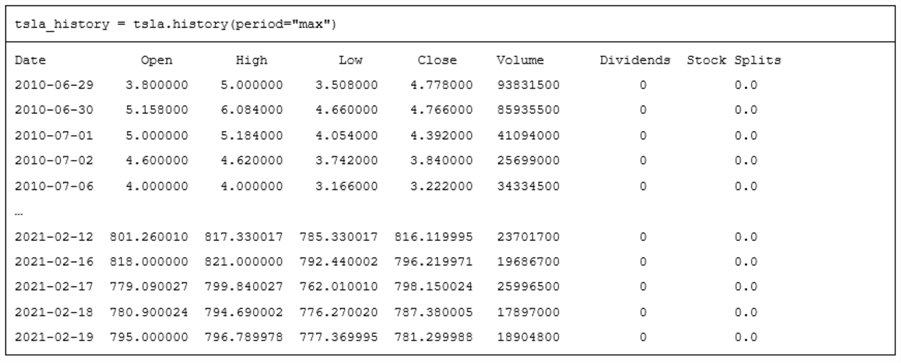
The following table shows the first application of the history method in the preceding script. For display purposes within this sub-section, the results sets are copied from an IDLE window to a Word window. Consequently, the column header names do not align properly in the Word table, but they do align properly in the IDLE window.
- The first row in the table contains the Python code for the first application.
- The second row contains an excerpt from the output for the first use of
history method.
- The first row shows the column header names for data columns starting with the Open price and running through Stock Splits.
- The second row shows the heading for the index column in the tsla_history object. The heading name is Date.
- The next five rows are the first five data rows in the populated tsla_history object. As you can see, the first day of historical data for the tsla ticker in Yahoo Finance is June 29, 2010.
- The ellipsis sign (…) are for omitted lines of output. These lines were omitted merely to save space.
- The last five rows are the last five data rows in the populated tsla_history object. The last day of data as of when the script was run for this tip is February 19, 2021, which is the most recent date available as of when the scripts were run.
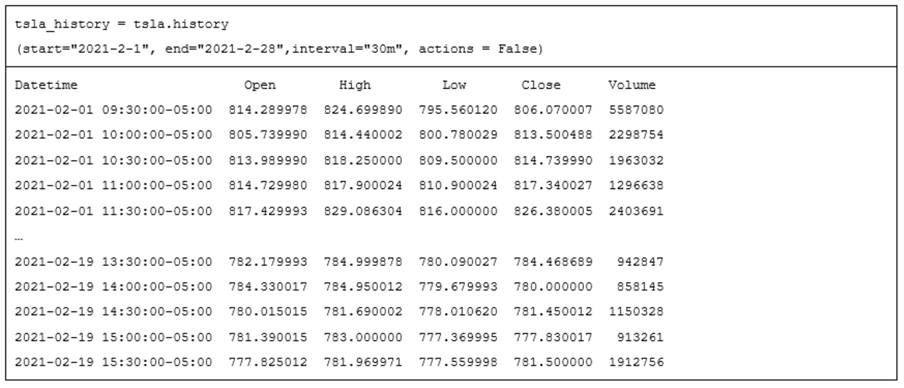
The next table shows the Python code for the second uncommented history method and excerpted results from the print command.
- There are five data columns in the tsla_history object from Open through Volume columns. The last two columns from the preceding tsla_history object display, namely Dividends and Stock Splits, are omitted from the following display because the actions parameter has a value of False.
- The index column has a different name in the following display than in the
preceding display.
- The index column in the preceding display has a name of Date because each row is for a successive trading date.
- The index column in the following display has a name of Datetime because
each row value is for a 30-minute interval within a trading date.
Times are for New York City time.
- The first five rows are for the intervals starting at 9:30 through 11:30 in the morning on February 1, 2021. For each trading date, the intervals progress through the last half hour of the regular trading day – namely, the one starting 3:30 in the afternoon of a trading date.
- The last five rows in the display below are for the final five half-hour intervals on the last day for the display (February 19, 2021).
- The Datetime column value for the last row has a starting time of 3:30 PM. This follows from the fact that end of normal trading during a trading date is at 4:00 PM.
- The ellipsis in the display below delimits the first five data rows from the last five data rows.
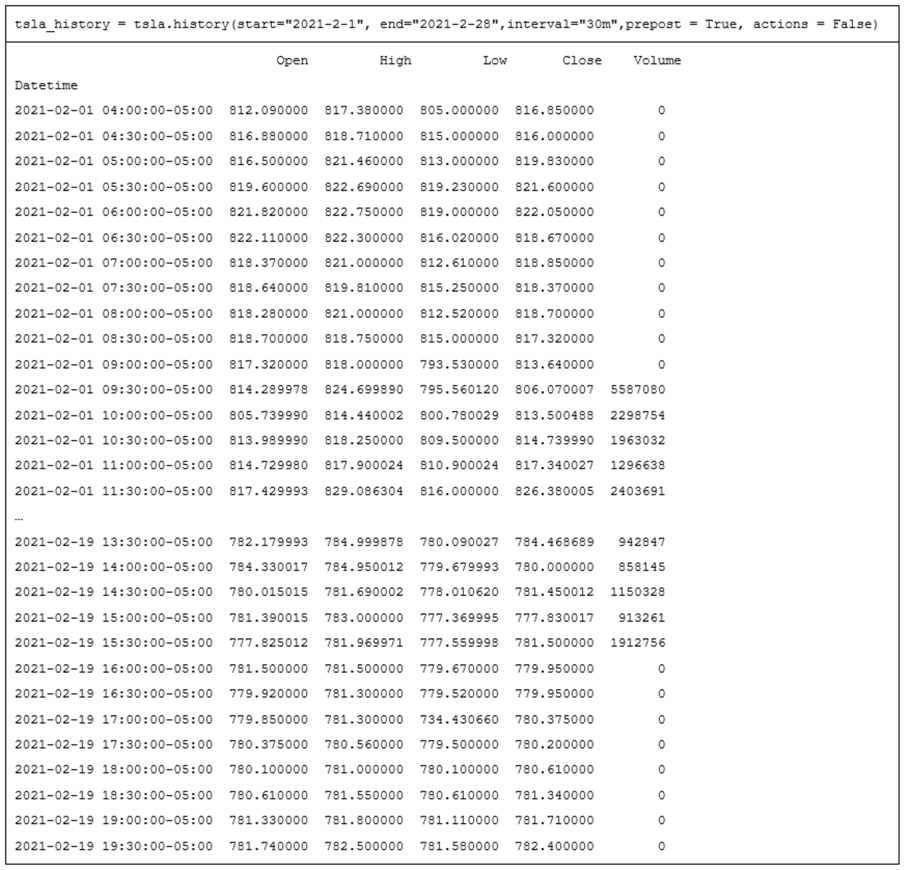
The next table shows the Python code for the third uncommented history method and the results from the print command.
- The Python code for the third invocation of the history method is the same
as for the second invocation of the history method, except for the assignment
of a value to the prepost parameter.
- The default value of the prepost parameter is False. This results in pre-market data and post-market data not showing.
- The assignment of a value of True to the prepost parameter causes pre-market and post-market data in Yahoo Finance to populate tsla_history. Pre-market data starts as soon as the half-hour interval starting at 4:00 am in the morning and runs through the half-hour interval starting at 7:30 pm in the evening of a trading day.
- After the pre-market data for a trading date shows, tsla_history displays regular trading day intervals from the half-hour interval at the start of a regular trading day (9:30 in the morning).
- Data for half-hour intervals progressively appear through the start of the last half-hour of a day starting at 3:30 in the afternoon of a trading day.
- After the last half-hour interval of a regular trading day, the first half-hour of a post-market period can display.
- Yahoo Finance does not make available the volume of shares traded during half-hour intervals in the pre-market and post-market periods.
Third try at getting stock data with yfinance
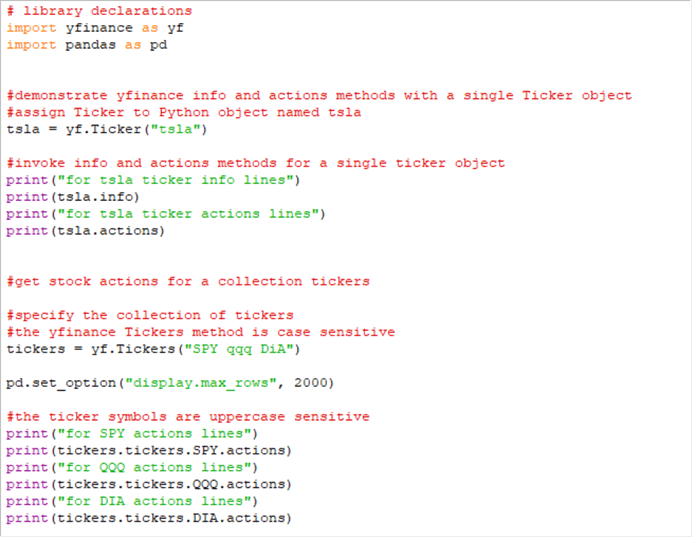
The Python code window below shows how to collect stock information that are not price and volume data. There are two parts to the demonstration. One part illustrates how to collect stock info and actions fields for a single stock ticker. The second illustration is about collecting the actions fields for a collection of stock tickers.
The script within the window below starts with a pair of import statements for the yfinance and pandas libraries. The yfinance library reference is for extracting fields from Yahoo Finance. The pandas library reference is for controlling how the fields are displayed by the print command. Because yfinance is a library for Python, the display of outputs from yfinance methods can be controlled by Python display option settings.
The first substantive portion of the script starts by a reference to the yfinance Ticker method. The method assigns a ticker value (tsla) to a Python object named tsla. Then, the info fields and the actions fields for the Python tsla object are successively printed to the console (the IDLE output window).
- The info field is returned in a JSON field format.
- The actions fields are returned in a data column format with a date index field. The column names for the actions field are Dividends and Stock Splits.
The second substantive portion of the script starts with the invocation of the Tickers method from the yfinance library; the spelling for the Tickers method is case sensitive (use capital T and lowercase ickers). The Tickers method returns a collection of two or more ticker values that can be individually referenced. You can designate the ticker symbol values for the Tickers method with lowercase (qqq), uppercase (SPY), or a combination of uppercase and lowercase (DiA).
This portion of the script also shows how to reference an individual ticker from a collection of tickers (spy, qqq, and dia) and then to extract actions field values for the individual ticker values.
- Individual elements in a Tickers collection can be referenced by tickers.tickers
followed by the name for the individual ticker in uppercase letters.
- Notice that no letter in tickers.tickers has to be in capital letters.
- After designating a specific ticker symbol value in uppercase letters, such as DIA for the DiA ticker, you can specify a property name, such as actions, to return the type of value that you seek for a ticker symbol.
- The print statements in the second substantive portion of the following script illustrates how to request the actions values for each of the three tickers in the Tickers collection. The code prints the actions field column values for each of the three symbols in the Tickers collection. Each ticker symbol has its own print command that prints the index column and the two actions data columns for a symbol.
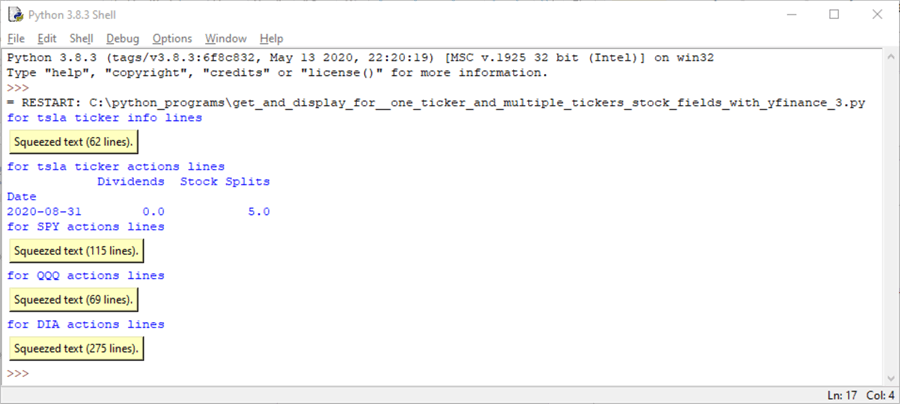
Here's output IDLE window from running the script in the preceding Python code window.
The first two fields with values for the tsla ticker are the info lines and the actions lines.
- The info lines are squeezed into 62 text lines that can be expanded by double-clicking the button for the info field. This tip presents and comments on an excerpt from the info fields shortly.
- There is just a single line for the actions fields for the tsla ticker. The ticker's Date field value is August 31, 2020. This is when the tsla ticker had a 5-for-1 stock split on August 31, 2020 in preparation for its entry into the S&P 500 index. Tesla never issued dividends. This may be because ticker returned such extraordinary capital gains in 2020. For example, its price rose by over 700 percentage points in 2020.
There is a set of actions field values for each of three tickers (SPY, QQQ, DIA) following the data for the tsla ticker. SPY, QQQ, DIA are three tickers that reflect values for widely monitored indexes, such as the S&P 500 (SPY), the top 100 NASDAQ stocks (QQQ), and the stocks in the Dow Jones Industrial Average (DIA). These three tickers each have their actions fields squeezed in the IDLE console. Recall that you can show the field values by double-clicking the button for a squeezed set of lines.
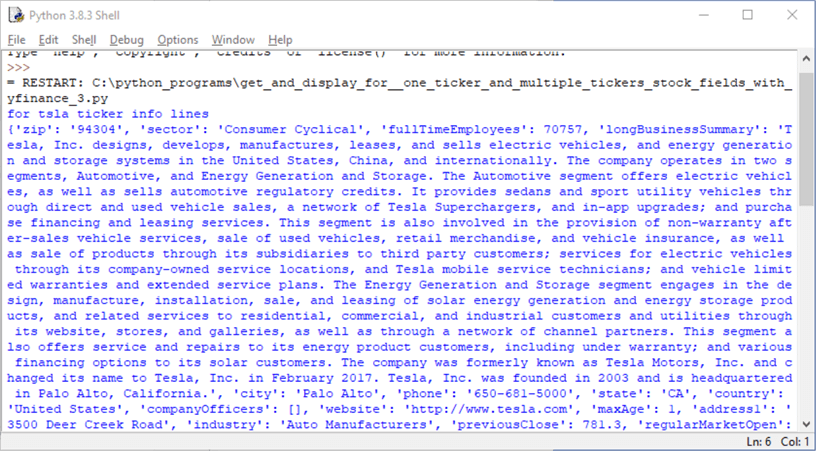
The following screen shot displays an excerpt from the IDLE output window of the tsla info field lines after they are un-squeezed by double-clicking the first button in the preceding screen shot.
The info field values appear as
- attribute name
- colon
- and attribute value
For example, the first tsla info field has an attribute name of zip and a value of 94304.
Stocks are often classified by their sector and industry. Following the zip field value, you can see the sector field name, which has a value of Consumer Cyclical. On the last line in the excerpted screen shot, the industry attribute name appears; its value is Auto Manufacturers.
Pulling historical data from a file of stock symbols
This tip's Python scripts up until this point are appropriate for downloading data from Yahoo Finance for one or a relatively small number of stock symbols. However, it is not uncommon to require the downloading of historical price and volume data for scores or even thousands of stock ticker symbols. For example, if you needed to collect historical price and volume data for a watchlist of ticker symbols, you might typically track between 5 to 100 ticker symbols. To compare data science models for discovering stocks with the best growth potential or when to buy and sell stocks to maximize profits, you might need to collect data for thousands of stocks, such as all those on the NASDAQ, NYSE, and AMEX exchanges.
The Python script in this section is also of interest because it shows how to save collected data to a csv file. By downloading historical price and volume data to a csv file, you make it relatively easy to import the data into SQL Server. This can be useful for initially populating or updating a stock data warehouse in SQL Server. A freshly updated stock data warehouse can provide a basis for describing data, modeling a time series, determining the scope entities for which a model is applicable.
The Python script starts with the following library declarations.
- The warnings library declaration suppresses unessential warning messages. More depth on the role of this library appears in the second sub-section within the "Working with the pandas data library" section.
- Next, the pandas_datareader.data library declaration, which has an alias name of web, is one way for a Python script to collect historical price and volume data from Yahoo Finance.
- The third declaration is for the Python datetime module, which is an internal Python library of code for dealing with date and datetime values.
# for suppressing future warning messages
import warnings
warnings.simplefilter(action='ignore', category=FutureWarning)

# settings for importing Python and pandas libraries
import pandas_datareader.data as web
import datetime
The next block of code creates an empty list object named symbol. Then, a with open statement opens a file with a list of stock ticker values. Successive stock ticker symbols are appended to the symbol list object from the mssqltips_list_w_bad_ticker.txt file in the C:\python_programs path. The strip function in the append method removes trailing characters, such as carriage return and line feed after the symbol for a stock symbol. The code block concludes with the close method for the source file of ticker symbols.
#read ticker symbols from a file to a python list object named symbol
symbol = []
with open('C:\python_programs\mssqltips_list_w_bad_ticker.txt') as f:
     for line in f:
     symbol.append(line.strip())
f.close
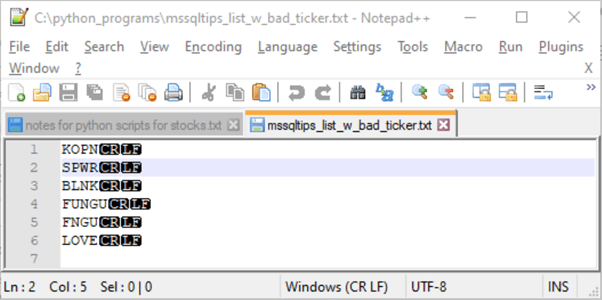
Here is a Notepad++ image of the file with its stock tickers. Line number 4 purposely misspells a ticker symbol as FUNGU instead of FNGU, which appears in line 5. While there are only six symbols in this file, I have run this type of application with thousands of symbols in a file.
The next block of code sets the start and end dates for collecting historical data. The Python datetime module has a date class for specifying dates without associated times or time zones. As you can see, the format for the date specification is year, month, day. The code below populates the start object with a date value for February 1, 2021. Next, the code populates the end object with a date value for February 28, 2021.
#the start expression is for February 1, 2021
start = datetime.date(2021,2,1)

#the end expression is for February 28, 2019
end = datetime.date(2021,2,28)
The script for this section specifies a filename and pathname for receiving data collected with the pandas_datareader.data library. The assignment statements in the following Python code designate the filename (with file_out) and its pathname (with path_out).
#set path for csv file
path_out = 'c:/python_programs_output/'
file_out = 'yahoo_prices_volumes_for_mssqltips_list_w_bad_ticker_to_csv_demo.csv'
The remaining code in the script appears below.
- The code starts by assigning 0 to two object values named i and j.
- Next, a while statement compares the value for i with a len function for
the symbol list. The len function returns the count of the number of symbols
in the symbol list object. The while statement continues looping through
the symbols for as long as the value of i is less than the number of symbols
in the symbol list. There are two code blocks nested within the while
loop and a trailing assignment statement at the same level as the while statement.
- The try block attempts to process the historical data for the ith ticker symbol in the symbol list. This tip describes the processing steps after summarizing the logic for the outer loop based on the value of i.
- The except block writes to the default IDLE window when there is an error associated with the attempt to process the symbol, such as the symbol not being in Yahoo Finance, or when the attempt to save the processed historical data to a file fails or any other kind of error.
- The trailing assignment statement increments the value of i by 1 to move on to the next symbol in the symbol list object.
Here is a summary of key methods and processes in the try code block. This tip previously described the datareader and drop methods. If you feel the need, review the descriptions for these methods in prior sections.
- Just like the drop method can remove a column from a dataframe, the insert method allows you to add a column to a dataframe. The insert method in the code below adds a set of column values to the df dataframe that is populated for the ith ticker symbol value.
- The if/else construct executes one set of statements when the if criterion
is true and another set of statements when the else criterion is true.
- If the value of i equals 0, then the if block creates a fresh version of the output file that is populated by the df dataframe in the output path for the ith symbol. Then, the code logs the action with a print statement to the default IDLE output window.
- If the value of i does not equal 0, then the else block appends the dataframe for the ith symbol to the cvs file initiated in the if block. Then, the code logs the action with a print statement to the default IDLE output window.
If the try block does not execute successfully because of an error, then control passes to the except block.
- If an error does occur, such as because of a ticker symbol that is not in Yahoo Finance or because the csv is already open and locked by Excel, then the code tries five more times to retrieve from Yahoo Finance and save the historical price and volume data for the ith symbol.
- At each successive pass through the except code block, a print statement
logs different aspects of the outcome to the default IDLE output window and
increments the value of j by 1. Three print statements
- Confirm the value of j for the pass and the value of i for the symbol
- Indicate two possible reasons for error on the jth pass for the ith symbol
- Display the symbol number and character values from the symbol list object
- Each pass through the except block of code is managed by an if/else construct
- The loop continues to the try block again when j is not equal to 6 in the else path.
- When the value of j reaches 6, the value of j is reset to 0, and the loop inside the except block is exited so that control passes to the following assignment statement (i=i+1). This allows the processing of the next symbol if there is at least one more left to process.
i=0 #for symbols in list file
j=0 #for number of symbol retries
while i<len(symbol):
    try:
        df = web.DataReader(symbol[i], 'yahoo', start, end)
        df.insert(0,'Symbol',symbol[i])
        df = df.drop(['Adj Close'], axis=1)
        if i == 0:
            df.to_csv(path_out+file_out)
            print (i, symbol[i],'has data stored to csv file')
        else:
            df.to_csv(path_out+file_out,mode = 'a',header=False)
            print (i, symbol[i],'has data stored to csv file')
    except:
        print ("Try:", j, "for symbol:", i)
        print("No information for symbol or file is open in Excel:")
        print (i,symbol[i])
        j=j+1
        if j == 6:
            j=0
            exit
        else:
            continue
    i=i+1
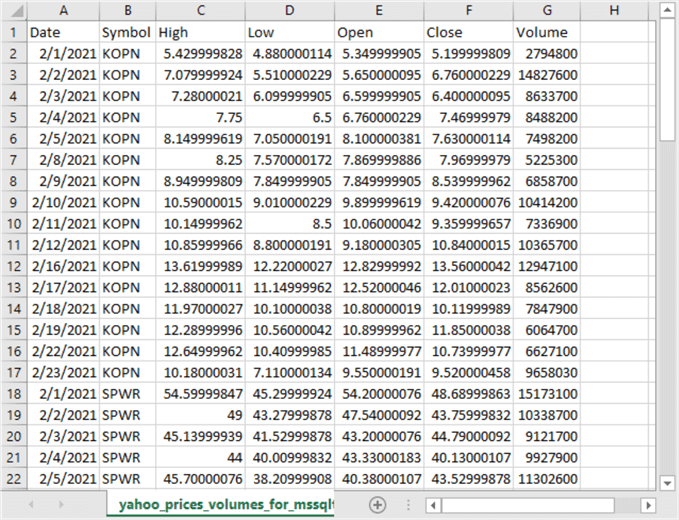
Here is an excerpt showing the first 22 rows from an Excel spreadsheet open to the yahoo_prices_volumes_for_mssqltips_list_w_bad_ticker_to_csv_demo.csv file.
- The first row shows the column header names from the csv file.
- Column A and columns C through G are for the columns downloaded from Yahoo Finance.
- Column B is for the inserted column with the ticker symbol value for a row of data.
- Rows 2 through 17 are for the first ticker symbol, namely KOPN. The last row of data for the KOPN symbol is for February 23, 2021. The Python script was run after the close of trading on that date.
- Rows 18 through 22 are downloaded data for the first five trading dates for SPWR in February 2021.
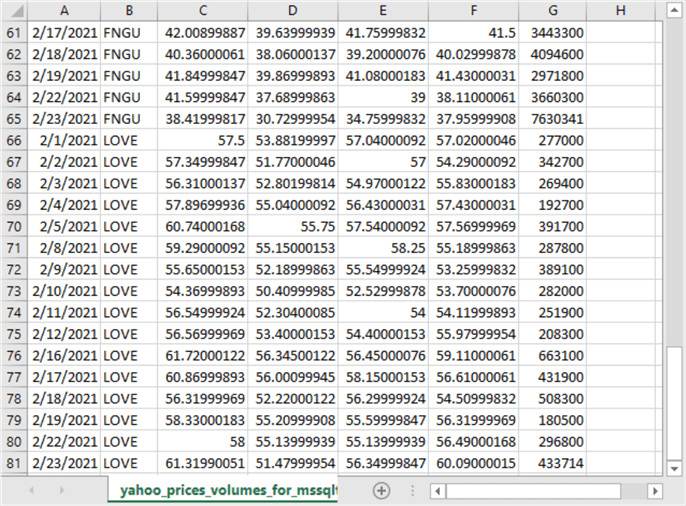
Here is another excerpt from Excel showing the final few rows from the csv file.
- Rows 61 through 65 are the last five rows for the FNGU symbol. The date value in cell A65 is for February 23, 2021.
- Rows 66 through 81 show all the downloaded rows for the LOVE symbol.
- Notice that the final trading date for the LOVE symbol is also for February 23, 2021.
- Since there are 16 trading dates for each of 5 symbols from February 1 through February 23, 2021, there are 81 rows in the spreadsheet – 16 rows for each symbol plus one additional row of column header names.
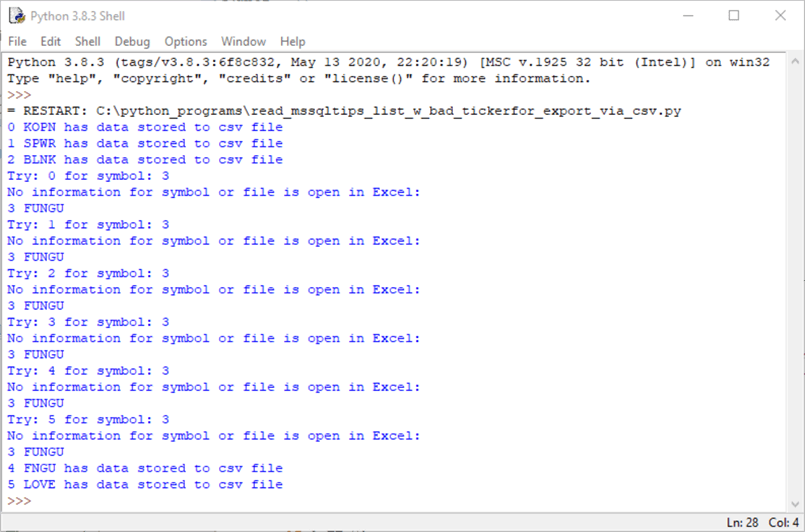
The following screen shot shows the log printed out by the script for this section.
- The symbols with i values of 0, 1, and 2 are for symbols: KOPN, SPWR, and BLNK.
- The symbol with an i value of 3 is for FUNGU. This symbol is not in Yahoo Finance. Six attempts were made for retrieving historical data for the FUNGU symbol, but none of the attempts were successful. The tries correspond to j values of 0, 1, 2, 3, 4, and 5.
- The symbols with i values of 4 and 5 are for symbols: FNGU and LOVE.
You might be wondering why there is a need to perform multiple tries when the code detects an error. This functionality accounts for the possibility of a temporary outage of an internet connection to Yahoo Finance or for a temporary lock on the destination file that blocks retrieving data from Yahoo Finance or makes it impossible to write to the csv file. By trying multiple times, the code gives a temporary problem a chance to get resolved before abandoning the attempt to transfer data from Yahoo Finance to the csv file.
Next Steps
You can verify this tip's code by running the script in the download file for this tip. If Python is not currently installed on your workstation, you can download Python for Windows from https://www.python.org/downloads/windows/. You will also require the pandas and yfinance libraries for Python. Pip is a handy utility for installing libraries for use with a Python installation.
You can run the Python script from the "Pulling historical data from a file of stock symbols" section in this tip with sample symbol file (also available from the tip's download file).


About the author
 Rick Dobson is an author and an individual trader. He is also a SQL Server professional with decades of T-SQL experience that includes authoring books, running a national seminar practice, working for businesses on finance and healthcare development projects, and serving as a regular contributor to MSSQLTips.com. He has been growing his Python skills for more than the past half decade -- especially for data visualization and ETL tasks with JSON and CSV files. His most recent professional passions include financial time series data and analyses, AI models, and statistics. He believes the proper application of these skills can help traders and investors to make more profitable decisions.
This author pledges the content of this article is based on professional experience and not AI generated.
View all my tips
