By: Rick Dobson | Updated: 2021-11-29 | Comments | Related: > TSQL
Problem
In this article, we show how to model decisions about time series values based on performance scores using SQL code to manage and process the time series data in a SQL Server database along with Excel to model and analyze results sets. We also cover how to present top-line results comparing decisions from performance scores versus decisions from crossovers for exponential moving averages.
Solution
Performance scores and exponential moving averages are two popular approaches for analyzing time series data. MSSQLTips.com previously presented a three-part tip series on collecting time series data and modeling decisions about them (here, here and here). The second and third parts drilled down on how to model with exponential moving averages decisions about time series. Another prior tip, Create Performance Charts in Python for Time Series Data within SQL Server, introduces SQL analysts to displaying trends for time series data with performance scores. The focus of this tip is to illustrate how to model with performance scores decisions about time series.
What is a performance score?
Performance scores report the percentage change for a set of underlying values from a start period through an end period where a period corresponds to a day or some other unit of time.
- The performance score for the beginning underlying value is always 0. This is because there is no percentage change difference from the first underlying value and itself.
- Performance scores for underlying values can go up or down relative to the
beginning value from one period to the next.
- If an underlying value is below the initial value in a time series, then its performance score is negative.
- If an underlying value is above the initial value in a time series, then its performance score is positive.
- You can compute a performance score for each underlying value, such as an amount of rain at a collection of weather stations or the close price for a set of security tickers. Each weather station or security ticker has its own time series.
- You can have multiple performance scores for the same set of underlying
time series values scaled from different starting values. For example,
performance scores can be from the beginning of a month, a quarter, a year,
or the beginning of a time series.
- In this tip, the performance score for the initial value of each month has a value of zero, but the first and last trading date during a month can vary from one year to the next. This is because weekend days and holidays (when stock exchanges are closed) can fall on different days within a month from one year to the next.
- If you are computing the performance score for each day within each month within a span of years, then the performance score within each month starts with a value of zero.
- The performance score for the last day in a month can be above or below zero depending on whether the underlying value for the last day in a month is above or below the initial value in a month.
- If the end performance score for a consecutive sequence of months rises for each month, then the underlying values increase across the sequence of months.
While performance scores can indicate trends over time, performance scores are not the only kind of metric for tracking changes in time series values over time. For example, exponential moving average values are a weighted function of all the values in a time series through the current period. The weight for a period depends on something called a period length. The weights are larger for short period lengths. In contrast, the weights are smaller for long period lengths. Several prior MSSQLTips.com articles describe how to compute exponential moving averages with SQL (for example, here and here).
Building a calendar for security prices within months
The following script shows how to create and populate a table named performance_for_chart_calendar. For this tip, the calendar table has a separate row for each row in the performance_for_chart table with a ticker value of AAPL with a trading date from the first trading date in 2011 through the last trading date in June 2021. The performance_for_chart table contains open-high-low-close-volume (ohlcv) data for security tickers. There is a distinct trading date for each row from the first through the last date in the date range for each ticker symbol. While the calendar for a set of time series has a beginning date and an ending date not all time series must start or end on the same date. For example, some securities may start trading before others, and other securities may discontinue trading before the final date in a trading date calendar.
The script excerpt below from the monthly_percentage_change_comps.sql file contains an inner query and an outer query. Before the inner and outer queries, a use statement specifies the default database, and a drop table if exists statement removes any prior version of the performance_for_chart_calendar table.
- The inner query is named for_min_and_max_day_of_month. It selects
a subset of rows from the performance_for_chart table. The AAPL ticker
is known to have underlying time series values for all dates tracked by this
tip. Therefore, the subset is based on the AAPL symbol.
- The results set from the for_min_and_max_day_of_month subquery relies on the date column from the performance_for_chart table.
- The subquery also returns a set of columns named month name, month_number, day_number_in_month, and year_number. The values for these columns are derived by functions for the date column.
- The outer query has two main roles.
- It accepts columns from its subquery and computes new columns named the min_day_number_in_month_year and max_day_number_in_month_year. The values for these two columns are computed with Window functions (min() and max()).
- The computed columns values from the outer query along with those from the for_min_and_max_day_of_month subquery are used to populate the performance_for_chart_calendar table.
use DataScience
go

-- create a fresh version of dbo.performance_for_chart_calendar table with
-- min_day_number_in_month_year and max_day_number_in_month_year

drop table if exists dbo.performance_for_chart_calendar;

select
 date
,datename(m,date) month_name
,datepart(m,date) month_number
,day(date) day_number_in_month
,min(day_number_in_month) over(partition by year_number, month_number) min_day_number_in_month_year
,max(day_number_in_month) over(partition by year_number, month_number) max_day_number_in_month_year
,year(date) year_number
into dbo.performance_for_chart_calendar
from
(
select
 date
,datename(m,date) month_name
,datepart(m,date) month_number
,day(date) day_number_in_month
,year(date) year_number
from [dbo].[performance_for_chart]
where ticker = 'AAPL'
) for_min_and_max_day_of_month
order by year_number, month_number

-- display values in the dbo.performance_for_chart_calendar table
-- select * from dbo.performance_for_chart_calendar
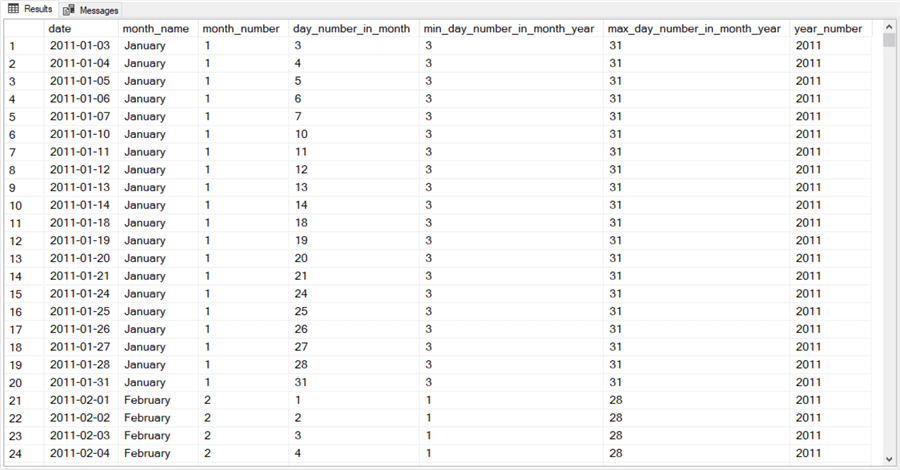
Here are a couple of screen excerpts from the beginning and ending rows of the commented select statement at the end of the preceding script excerpt. Each excerpt contains twenty-four rows.
- The first screen excerpt is for the first twenty-four rows in the performance_for_chart_calendar table. Notice that security trading dates exclude holidays and weekends.
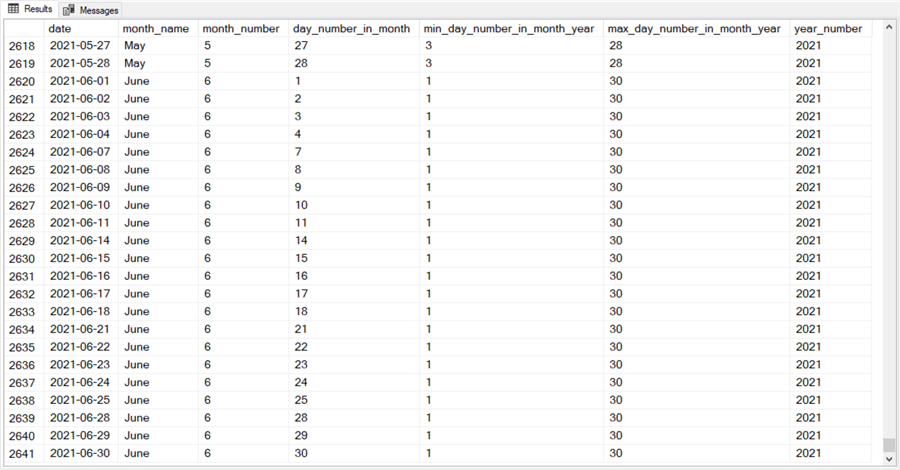
- The second screen excerpt is for the last twenty-four rows in the performance_for_chart_calendar table. The last date in this table is 2021-06-30, which is the last trading date in June 2021.
Building and using a monthly performance computer
This section describes code to compute monthly performance scores for a security’s ticker. There are three key inputs to the code. These are the performance_for_chart_calendar table, the performance_for_chart table, the monthly_performance_based_on_close_computer stored procedure.
- The main input is the performance_for_chart table. This table stores
the underlying values for computing monthly performance scores over a range
of months, such as the first trading date in 2011 through the last trading date
in June of 2021. There are three columns in this table
- Ticker symbol for a security
- Date for each trading date in a month
- Close for a ticker’s close price on a trading date
- The performance_for_chart_calendar table, which is described in the preceding section, simplifies the process of computing the performance throughout a month for each of the months in a date range. By joining the performance_for_chart and performance_for_chart_calendar tables, SQL code can extract the first and last trading date from each month along with the corresponding close prices for each of these dates.
- The monthly_performance_based_on_close_computer stored procedure computes
and returns the performance scores for a ticker.
- The stored procedure accepts an input parameter named @ticker that specifies the ticker symbol for which to compute performance scores.
- There are three key steps in the stored procedure.
- First, it performs the join of the performance_for_chart and performance_for_chart_calendar tables.
- Next, it extracts the rows for the first and last trading date for each month of data in the performance_for_chart table. These dates can vary from month to month in a range of months over a span of years.
- The last step involves computing a results set with separate columns
for
- Ticker
- Month_number
- Year_number
- Close_price_for_first_date_in_month
- Close_price_for_last_date_in_month
- Monthly_performance_based_on_close
Another code block uses the monthly_performance_based_on_close_computer stored procedure to populate a table named monthly_performance_based_on_close. An example of how to use this code block appears next for the AAPL ticker symbol. You can repeatedly run the code block for as many different distinct symbols as there are in the performance_for_chart table.
For the purposes of the analysis and projections in this tip, the code block is executed for seven symbols: AAPL, GOOGL, MSFT, SPXL, TQQQ, UDOW, and SPY. The SPY symbol monthly performance serves as a benchmark for the monthly performance of each of the other six symbols. SQL code described in the next section facilitates the comparison of SPY performance to the performance of each of the other six symbols.
insert into dbo.monthly_performance_based_on_close
exec dbo.monthly_performance_based_on_close_computer 'AAPL'
The tip’s download includes all the SQL code described in this section as well as other sections throughout the tip. The download also contains additional data to populate the monthly_performance_based_on_close table for eight additional symbols. These symbols are DIA, FAS, IYR, MARA, QQQ, SOXL, TNA, XOP. You can use these additional symbols to practice the processing steps comparing a symbol’s monthly performance to the monthly performance for the SPY symbol.
Comparing monthly performances for the SPY symbol versus a comparative symbol
In evaluating the significance of performance scores for a time series, it is often useful to have another set of performance scores for a benchmark time series. For example, this tip compares the performance of each of six comparison tickers to a benchmark ticker (SPY). The SPY ticker is an exchange traded fund whose close price trends match S&P 500 index value trends. As you may already know, the S&P index approximates overall market performance (or at least the 500 securities in the index).
In comparing performances for SPY to AAPL, it is convenient to extract selected columns from the monthly_performance_based_on_close table for each ticker and then join the results sets by year_number and month_number. The joined results sets position performance scores for each ticker on the same row for matching months from the starting month through the final month.
The following script excerpt shows how to extract the columns and implement the join between the SPY and AAPL results sets. An outer query includes the column from each ticker’s results set and computes a new column based on the comparison of the monthly_performance_based_on_close column values from each results set.
- The subquery named SPY_columns extracts month_number, year_number, and monthly_performance_based_on_close column values from the monthly_performance_based_on_close table
- The subquery named comparison_ticker_columns extracts close_for_first_date_in_month and close_for_last_date_in_month columns as well as month_number, year_number, and monthly_performance_based_on_close
- The outer query
- joins the two subquery results sets on month_number and year_number
- computes a new column named AAPL_GT_SPY
- The new column in the outer query has a value of
- 1 when the performance score for the AAPL ticker exceeds the performance for the SPY ticker or
- 0 when the performance score for the AAPL ticker does not exceed the performance for the SPY ticker
-- SPY vs AAPL
select
 SPY_columns.month_number
,SPY_columns.year_number
,SPY_columns.monthly_performance_based_on_close SPY_monthly_performance
,comparison_ticker_columns.monthly_performance_based_on_close AAPL_monthly_performance
,comparison_ticker_columns.close_for_first_date_in_month
,comparison_ticker_columns.close_for_last_date_in_month
,
case
   when comparison_ticker_columns.monthly_performance_based_on_close
      > SPY_columns.monthly_performance_based_on_close
   then 1
   when comparison_ticker_columns.monthly_performance_based_on_close
      <= SPY_columns.monthly_performance_based_on_close
   then 0
   else null
end AAPL_GT_SPY
from
(
select
 month_number
,year_number
,monthly_performance_based_on_close
from dbo.monthly_performance_based_on_close
where ticker = 'SPY'
) SPY_columns

inner join

(
select
 month_number
,year_number
,monthly_performance_based_on_close
,close_for_first_date_in_month
,close_for_last_date_in_month
from dbo.monthly_performance_based_on_close
where ticker = 'AAPL'
) comparison_ticker_columns

on SPY_columns.month_number = comparison_ticker_columns.month_number
   and
   SPY_columns.year_number = comparison_ticker_columns.year_number
You can find a similar SQL script excerpt for each of the five remaining comparison tickers in the download for this tip. The results set from each script is copied to a separate tab in an Excel workbook, which facilitates the final step for projecting buy and sell dates and close prices for SPY and comparison tickers.
Modeling buy and sell dates and prices for tickers based on performance score comparisons
The basic idea behind the model about when to buy and sell securities is that once a comparison ticker confirms superior performance to the SPY benchmark ticker for the past 12 months, then it can continue to achieve superior performance until it stops confirming this capability. Recall that for the purposes of this tip, we are using SPY as an overall indicator of stock market performance.
- The model defines superior performance over the past year as when the comparison ticker has better performance than the SPY ticker in at least 8 of the past 12 months. In other words, a comparison ticker has superior performance to the overall market when its performance is twice as likely to beat the performance of the overall market.
- Conversely, the model defines the absence of superior performance over the past year as when a comparison ticker does not have a higher performance score than SPY in at least 8 of the past 12 months.
- The first buy signal occurs on the first trading date after the comparison ticker’s performance initially exceeds the SPY ticker performance for at least 8 of the past 12 months.
- The first sell signal occurs on first trading date after the first buy signal when the comparison ticker’s performance fails to exceed the performance of the SPY ticker for at least 8 of the past 12 months.
- After the first sell signal, the model code searches for the next buy signal as defined by superior performance for the comparison ticker relative to the SPY ticker in 8 of the past 12 months. The first trading date of the month after the comparison ticker’s performance exceeds the SPY ticker performance is the date of the next buy signal.
- A sequence of buy and sell signals must end in a sell signal. The model does not process a buy signal in a sequence of buy and sell signals without a trailing sell signal.
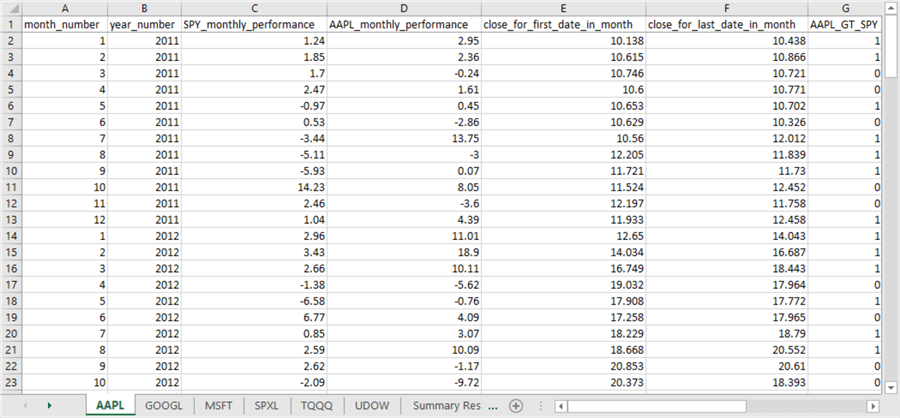
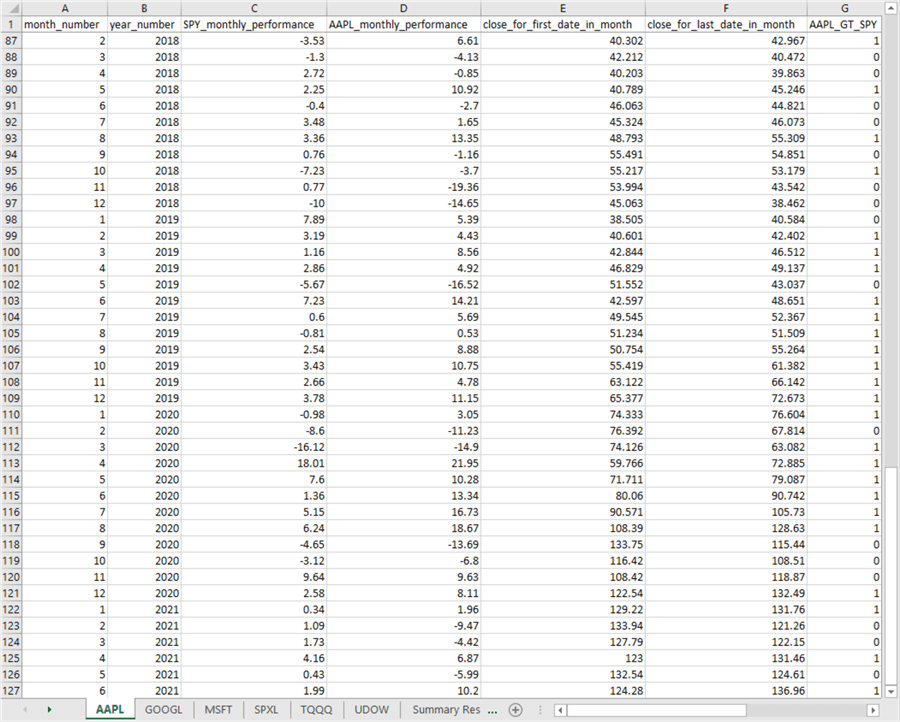
This section illustrates how to start using Excel in combination with the results set from the preceding script to implement a model for choosing buy and sell dates and close prices based on performance scores. The model setup begins by populating a tab in an Excel workbook with the results set from a script like the one in the preceding section. The following screen image shows the first 23 rows of the AAPL tab in the Excel workbook based on the AAPL vs SPY script segment in the preceding section.
- Row 1 contains the column names.
- Rows 2 through 23 contain underlying data for determining the first buy and sell dates and prices.
- The first row with data (row 2) has a month number of 1 and a year number of 2011. Therefore, this row denotes values for the first month of data in the source data for this tip.
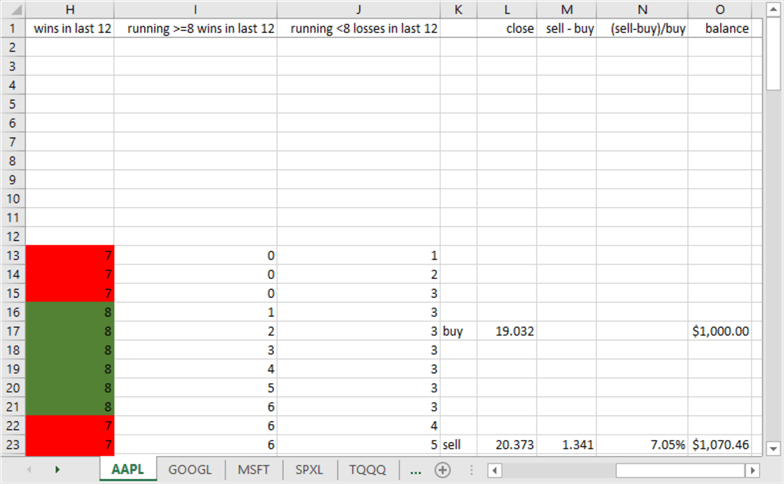
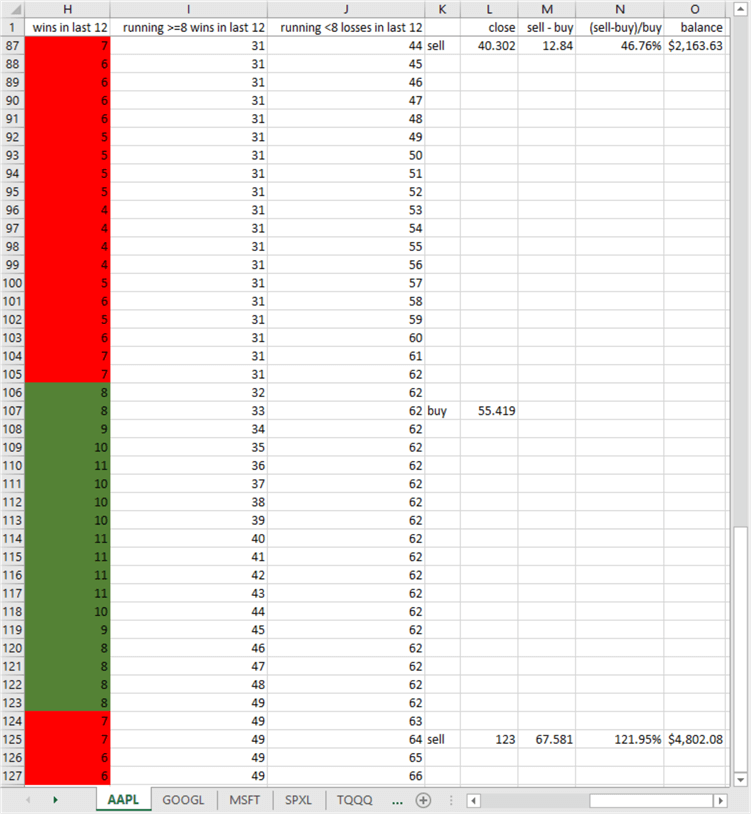
The next screen image shows columns H through O for the first 23 rows of the AAPL tab.
- Column H sums the values of the preceding 12 values through the current
row in column G. An Excel sum function computes the sum of column H values
over the preceding 12 rows.
- The first column H value appears in row 13 because the first column G value (either 0 or 1) appears in row 2. Recall that column G values are copied from a SQL Server results set.
- Conditional formatting is used for column H cells so that background
color is
- Red when the sum in a cell is 7 or less
- Green when the sum in a cell is 8 or more
- Column I indicates a running sum value of the number of column H cells with a value of 8 or more in column H.
- Column J indicates a running sum value of the number of column H cells with a value of 7 or less in column H.
- Column K denotes when to execute a buy and when to execute a sell with
the buy or sell keyword on a row.
- The keyword is buy when a row initially follows a preceding green cell in column H.
- The keyword is sell when a row initially follows a preceding red cell in column H.
- The more consecutive green cells in column H, the more time there is a for a sequence to accumulate more gains for buying and holding a security.
- For a row with buy in column K, column L has the initial close value for a sequence of 1 or more green cells in column H.
- For a row with sell in column K, column L has the last close value for a preceding sequence of 1 or more red cells in column H.
- Column M computes the change from the initial close through the last close for a sequence of 1 or more green cells in column H. A positive value indicates a gain, and a negative value indicates a loss.
- Column N shows the percentage change for a buy_sell cycle.
- Column O shows the cumulative balance for a sequence of trades from the first buy through the most recent sell.
The next screen shot shows the last 41 rows in the AAPL tab. The last row of data (row 127) contains a month_number of 6 and a year_number of 2021. Therefore, this row denotes values from the last row of source data in this tip.
The next screen shot shows columns H through O for the last 41 rows on the AAPL tab.
- The last buy_sell cycle starts on row 107 and runs through row 125. These rows are marked with buy and sell keywords, respectively, in column K.
- The balance value in column O for the last AAPL buy_sell cycle is $4,802.08. Because this tip sets the initial investment for a comparison ticker at $1,000.00, the model accumulates gains of $3,802.08 from the first month in 2011 through the sixth month in 2021.
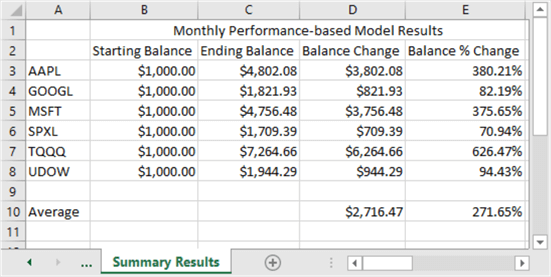
The Excel workbook in this tip’s download includes a separate tab for each of the six comparison tickers. The tab names for comparison tickers are AAPL, GOOGL, MSFT, SPXL, TQQQ, and UDOW. In addition, there is a Summary Results tab that appears below with several sets of comparisons. For example, the following screen shot shows monthly performance-based model results for the six tickers analyzed in this tip.
- Column A shows the comparison ticker symbols.
- Columns B through E show, respectively, the
- Starting balance
- Ending balance
- Balance change
- Balance percentage change
- The tickers analyzed in this tip generated a positive return from a low of $709.39 for SPXL through a high of $6,264.66 for TQQQ.
- As you can see, there can be a lot of variation in the amount of return for different ticker symbols. This points to the need for validating a model like the one presented here with tickers before using them for trades.
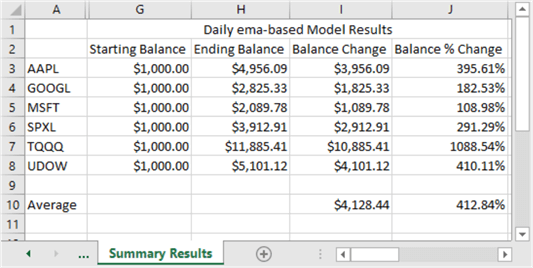
The next screen shot shows another excerpt from the Summary Results tab.
- These results are from a different model whose results were initially reported in a prior tip Creating and Comparing SQL Time Series Models.
- The prior tip generated buy_sell dates and prices for the same six tickers. However, the estimates for buy_sell dates and prices were based on exponential moving average (ema) crossovers for time series for prices associated with the tickers.
- By comparing the results in the following screen excerpt to the results in the preceding screen excerpt, you can see a generally consistent trend for the ema-based model to generate larger returns than the performance-based model. The one exception is for the MSFT ticker.
For the limited summary results examined here, the ema-based model seems to be a better one than the performance-based model for generating buy_sell dates. On the other hand, performance scores are excellent at showing trends – especially over longer time periods.
Next Steps
This tip presents a demonstration of how to model decisions about time series data. The decisions within this tip are about when it is a good time to buy and sell financial securities, but the model design can readily be extended to other use cases, such as whether to forecast a rainy day or a hot day tomorrow. All you must do is compute performance scores for one or more time series and then use the workbook model to project decisions based on performance scores.
The download for this tip has just three files.
- A sql file for computing performance scores for the ticker symbols mentioned in this tip. All the SQL script excerpts as well as referenced code are from this file.
- A csv file with ticker, date, and close price columns for 15 tickers over ten and a half years. After importing this file to SQL Server, you can use this file to populate the performance_for_chart table mentioned in the tip.
- A Model_for_buying_and_selling_based_on_performance_scores.xlsx file, which includes completed model examples for the AAPL, GOOGL, MSFT, SPXL, TQQQ, and UDOW ticker symbols. This model tells you where to put indicators for each type of decision in column K. Then, you can populate columns L through O based on the values in column K.
You can verify the operation of the sql code and Excel workbook expressions with the help of the download file. You can also adapt the Excel workbook model framework to other tickers and their historical data, which are available in the csv file. Finally, you can apply this framework for making decisions about any custom time series your company tracks.


About the author
 Rick Dobson is an author and an individual trader. He is also a SQL Server professional with decades of T-SQL experience that includes authoring books, running a national seminar practice, working for businesses on finance and healthcare development projects, and serving as a regular contributor to MSSQLTips.com. He has been growing his Python skills for more than the past half decade -- especially for data visualization and ETL tasks with JSON and CSV files. His most recent professional passions include financial time series data and analyses, AI models, and statistics. He believes the proper application of these skills can help traders and investors to make more profitable decisions.
This author pledges the content of this article is based on professional experience and not AI generated.
View all my tips
Article Last Updated: 2021-11-29
