By: Rick Dobson | Updated: 2022-01-19 | Comments (2) | Related: > TSQL
Problem
I seek an example of how to implement a securities trading model based on MACD indicators. I want the example to readily work with any securities symbol without doing anything other than specifying a new symbol. I also want the demonstration to provide feedback on the amount of return and rate of return from the model for different securities symbols.
Solution
MSSQLTips.com published a couple of prior tips (here and here) for SQL Server professionals that introduced and applied MACD indicators. Both prior tips illustrate how to compute the MACD indicators and correlate indicator values with close price changes. However, neither of the prior tips presents a model for when to buy and sell securities. While it is important for security indicators to be correlated with current and future securities close prices, correlations do not directly indicate when to buy and sell securities – nor do they confirm the amount gained or lost as a result of buying and selling a security. Yet whether you are trading securities for yourself, or you are working for or consulting to a trading organization, it is possible that securities will be bought and sold on a regular basis.
This tip demonstrates how to build a model for buying and selling securities based on two of the three MACD indicators. This tip also presents summary results from the model for six different symbols. Unlike an earlier time series modeling tip, this tip completes all model and evaluation steps in a single T-SQL script instead of restricting SQL Server to just storing the data and implementing the model, but performing an evaluation of the model results in Excel. With the script from this tip, all a user has to do is specify a security, designate a starting date for trades, run the script, and then save the summary report for the model with the security symbol.
A refresher for the MACD indicators
The MACD acronym is an abbreviation for the Moving Average Convergence/Divergence oscillator. The oscillator was originally developed and promoted by a technical analyst named Gerald Appel in the late 1970s. The core idea is to define the MACD indicator as the difference of two exponential moving averages – one with a shorter period length and the other with a longer period length. When working with securities, the exponential moving averages are typically computed over daily close prices. Exponential moving averages with shorter period lengths are nearer to the current close price than exponential moving averages with longer period lengths. Therefore, as daily close prices increase, the exponential moving average with the shorter period length will rise relative to the exponential moving average with the longer period length.
MSSQLTips.com published numerous tips on how to compute and use exponential moving averages (for example, here and here). Exponential moving averages (EMA) are most often computed in a loop. The loop goes back to the second value in a time series where the second value is initialized to the first value in the underlying time series – namely, the close price for sequential trading days. This tip illustrates how to use a while loop for computing an exponentially weighted moving average (ewma). Within this tip, the period lengths for the MACD indicator are 12 and 26. The expression for what is commonly called the MACD indicator is
MACD = 12-period ewma – 26-period ewma
The second MACD indicator is called the signal. This value is commonly computed as the ewma of the MACD indicator values. The period length for the signal values is usually 9. As with the exponentially weighted moving averages for the close prices, the period length can change depending on the preferences of a technical analyst or a trader.
The third indicator is usually called the MACD histogram. The indicator's value is computed as the MACD indicator less the signal indicator. This tip does not use the MACD histogram indicator, but it is included in the demonstration code so that others who require it can have some code for computing it.
The MACD indicators are for assessing the momentum of the underlying series, such as daily close prices.
- When the MACD indicator crosses from below its centerline value of zero to above its centerline value, then it indicates positive momentum in the underlying series -- close prices are rising.
- The signal is an exponentially weighted moving average of MACD indicator values. The period length for computing the signal from MACD indicator values is typically 9.
- When the MACD is above its centerline value of zero, and the MACD value is also above its signal value, then increasing positive momentum is even greater than when the MACD is above the centerline value, but the MACD indicator is less than its signal indicator. This is because the signal indicator, which is itself an exponential moving average of the MACD indicator, lags the MACD indicator on average.
Computing the MACD indicators with T-SQL
There are two parts to the T-SQL code for computing the MACD indicators.
The first part computes ewma_12 and ewma_26 based on the daily close prices of a security. Results are saved in the #temp_for_ewma temp table. Each security is represented by a ticker symbol. This tip section shows the code for the TQQQ ticker symbol. However, the tip reports results for six ticker symbols – namely, TQQQ and five other securities with ticker symbols of AAPL, GOOGL, MSFT, SPXL, and UDOW. The string value of TQQQ is assigned to the @symbol local variable in the script below. By changing assignment value, such as to AAPL, you can exponentially smooth the ticker whose data is processed.
In the second part, the exponential moving averages are used either directly or indirectly to compute the three MACD indicators. Three columns are added to and populated in the #temp_for_ewma table – one column for each of the MACD indicators.
- The first column has the name macd. This column is populated with ewma_12 less ewma_26.
- The second column has the name signal. A while loop computes an ewma with a period length of 9 based on the macd values computed for the first added column.
- The third column has the name macd_histogram. This MACD indicator is not used in this tip, but it is computed so that it is available for other use cases that may require it. Recall the histogram indicator is computed as the difference of the MACD indicator value less the signal indicator value.
The T-SQL for the first part
The first part initializes several columns for the #temp_for_ewma temp table. The columns include date, open, and close prices for successive trading dates from the stooq_prices table in the DataScience database. Another key column has the name row_number, which is populated by the SQL Server row number () function. A while loop in the first part computes ewma_12 and ewma_26 column values.
The values in the row_number column are sequential identifier values for rows numbers in the #temp_for_ewma table. The row_number values help to reference concurrently two rows during a single pass through the while loop for computing exponential moving averages. Two sequential row_number values are guaranteed to be different by 1. Two sequential trading dates can be different by more than one date because markets are closed on weekends and selected holidays. The row_number values are also used in the second part to help populate the macd and macd_histogram columns in the #temp_for_ewma table.
use DataScience
go
-- use this segment of the script to set up for calculating
-- ewma_12 and ewma_26 for ticker symbol
-- initially populate #temp_for_ewma for ewma calculations
-- @ewma_first is the seed
-- time series data are from dbo.stooq_prices for @symbol symbol
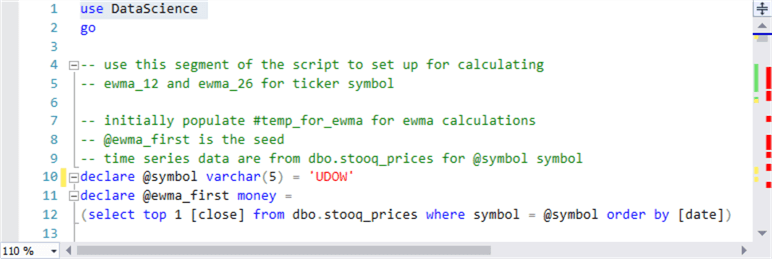
declare @symbol varchar(5) = 'TQQQ'
declare @ewma_first money =
(select top 1 [close] from dbo.stooq_prices where symbol = @symbol order by [date])
-- create and populate base table for ewma calculations (#temp_for_ewma)
drop table if exists #temp_for_ewma
-- ewma seed run
select
[date]
,[symbol]
,[open]
,[close]
,row_number() OVER (ORDER BY [Date]) [row_number]
,@ewma_first ewma_12
,@ewma_first ewma_26
into #temp_for_ewma
from dbo.stooq_prices
where symbol = @symbol
and [date] >= 'January 1, 2011'
order by row_number
--select * from #temp_for_ewma order by row_number
-- NULL ewma values for first period
update #temp_for_ewma
set
ewma_12 = NULL
,ewma_26 = NULL
where row_number = 1
-- optionally echo #temp_for_ewma before updates in while loop
--select * from #temp_for_ewma order by row_number
-- calculate ewma_12 and ewma_26
-- @ew_12 is the exponential weight for 12-period
-- @ew_26 is the exponential weight for 26-period
-- start calculations with the 3rd period value
-- seed in the second row is the close price
-- from the 1st period; it is used as ewma for 2nd period
declare @max_row_number int = (select max(row_number) from #temp_for_ewma)
declare @current_row_number int = 3
declare @ew_12 real = 2.0/(12.0 + 1), @today_ewma_12 real
declare @ew_26 real = 2.0/(26.0 + 1), @today_ewma_26 real
while @current_row_number <= @max_row_number
begin
set @today_ewma_12 =
(
-- compute ewma_12 for period @current_row_number
select
top 1
([close] * @ew_12) + (lag(ewma_12,1) over (order by [date]) * (1 - @ew_12)) ewma_12_today
from #temp_for_ewma
where row_number >= @current_row_number -1 and row_number <= @current_row_number
order by row_number desc
)
set @today_ewma_26 =
(
-- compute ewma_26 for period 3
select
top 1
([close] * @ew_26) + (lag(ewma_26,1) over (order by [date]) * (1 - @ew_26)) ewma_26_today
from #temp_for_ewma
where row_number >= @current_row_number - 1 and row_number <= @current_row_number
order by row_number desc
)
update #temp_for_ewma
set
ewma_12 = @today_ewma_12
,ewma_26 = @today_ewma_26
where row_number = @current_row_number
set @current_row_number = @current_row_number + 1
end
-- optionally echo of results set for
-- select * from #temp_for_ewma order by row_number
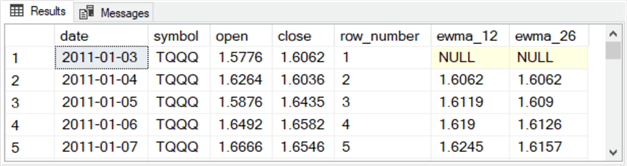
Here is a results set excerpt showing the first five rows from the commented select statement at the end of the preceding script excerpt.
- The ewma_12 and ewma_26 column values in the first row are both null. This is because exponential moving average values are null for the first row.
- The ewma_12 and ewma_26 column values in the second row are both 1.6062, which is the close price for the first trading date. This is because exponential moving averages use the first row of the underlying values as the seed for an exponential moving average series.
- Both the ewma_12 and ewma_26 column values for the third and subsequent
rows contain exponentially weighted moving averages for the close price time
series for the ticker symbol value (TQQQ) in the symbol column.
- The expressions for @today_ewma_12 and @today_ewma_26 in the preceding script apply the exponential weights
- An update statement towards the end of the while loop transfers the computed values to the ewma_12 and ewma_26 column values.
The T-SQL for the second part
The second part of the T-SQL code for computing the three MACD indicators appears in the following script excerpt. There is a separate sub-part for each of the three indicators. The first line of code for each sub-part starts with an alter table statement for the #temp_for_ewma table. This first line of code within each sub-part adds a new column to the #temp_for_ewma table. The column names in the first, second, and third sub-parts have these names, respectively
- macd
- signal
- macd_histogram
After adding the macd column in the first sub-part, the code uses an update statement to populate the macd column based on a subquery in its from clause. An expression in the subquery subtracts a longer period length moving average from a shorter period length moving average. These differences are assigned to the successive rows of the macd column.
After adding the signal column in the first line of the second sub-part, the code prepares the column for the computation of an exponential moving average in a while loop. The preparation involves assigning null values to the first two rows of the signal column and the second row from the macd column to the third row of the signal column. Then, a while loop is invoked to iteratively compute column values across the remaining rows in the signal column.
Two prior MSSQLTips.com tips (here and here) use a slightly different approach to computing signal values. This tip shows the loop syntax for computing signal values. For this use case, both approaches yield identical results.
The third sub-part begins by adding a third column named macd_histogram to the #temp_for_ewma table. The code for populating the macd_histogram column computes successive rows as the macd column value less the signal column value.
-- add and populate column of macd values to #temp_for_ewma
alter table #temp_for_ewma add macd float
go

-- update the macd column from a subquery with the macd expression
update #temp_for_ewma
   set #temp_for_ewma.macd = macd_values.macd
from
(select date, (ewma_12 - ewma_26) macd  from #temp_for_ewma) macd_values
where #temp_for_ewma.date = macd_values.date

-- add and populate column of signal values to #temp_for_ewma
alter table #temp_for_ewma add signal float
go

--initialize first two rows of signal column
update #temp_for_ewma
   set #temp_for_ewma.signal = null
where #temp_for_ewma.row_number <= 2

-- initialize third row of signal column
update #temp_for_ewma
   set #temp_for_ewma.signal = (select macd from #temp_for_ewma where row_number = 2)
where row_number = 3

-- populate rows 4 through @max_row_number for signal column
-- based on 9-period exponential moving average of macd
declare @current_row_number int
set @current_row_number = 4
declare @max_row_number int = (select max(row_number) from #temp_for_ewma)
declare @alpha_9 float = 2.0/10.0

while @current_row_number <= @max_row_number
begin

   --select @current_row_number
   update #temp_for_ewma
      set signal = @alpha_9 * (select macd from #temp_for_ewma where row_number = @current_row_number)
         + (1 - @alpha_9) * (select macd from #temp_for_ewma where row_number = @current_row_number - 1)
   where row_number = @current_row_number

   set @current_row_number = @current_row_number + 1
end

-- add and populate column of macd_histogram values
alter table #temp_for_ewma add [macd_histogram] float
go

-- update the macd_histogram column from a subquery with the macd_histogram expression
update #temp_for_ewma
   set #temp_for_ewma.[macd_histogram] = macd_histogram_values.macd_histogram
from
(select date, (macd - signal) macd_histogram  from #temp_for_ewma) macd_histogram_values
where #temp_for_ewma.date = macd_histogram_values.date

-- optionally display results set for #temp_for_ewma
-- after adding and populating columns for macd, signal, and macd_histogram
-- select * from #temp_for_ewma order by row_number
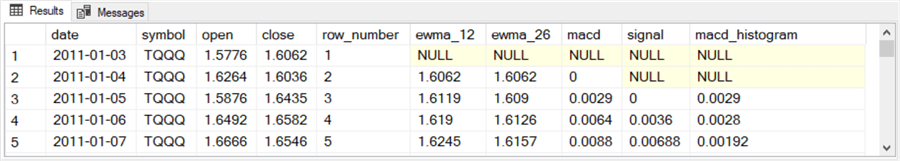
Here is a results set excerpt that shows the first five rows from the commented select statement at the end of the preceding script excerpt.
- The macd_histogram column values equal the macd column value less the signal column value for a row.
- The first two rows in the macd_histogram column are null because the signal column values for those two rows are null.
- The macd and signal columns are computed according to the code in the preceding script.
Creating and populating tables with source data for the MACD trade model
The MACD trade model focuses on two ways that a security can show increasing positive momentum.
- First, the model assumes increasing positive momentum when the MACD indicator crosses from at or below its centerline value to a value above 0. The MACD indicator is represented by macd column values in the #temp_for_ewma table. This transition marks the beginning of a set of periods in which the MACD indicator is greater than 0. The rise of the MACD indicator above its centerline indicates the beginning of a major cycle of rows with positive momentum. This major cycle persists until the MACD indicator falls to or below its centerline value.
- Within a major cycle of positive momentum rows, there can be a series of
minor cycles having even more positive momentum than results from MACD indicator
being above its centerline value.
- Each minor cycle within a major cycle starts when the MACD indicator rises above the signal indicator.
- Whenever the MACD indicator falls to or below the signal indicator, the current minor cycle ends.
- Over an evaluation set of periods, there can be multiple major cycles each with their own set of embedded minor cycles. Major cycles are separated from each other by sets of periods in which the MACD indicator is at or below its centerline value.
Here is the code for creating and populating a table (#for_macd_trade_model) with MACD indicators, their underlying values for the indicators, one additional column for specifying buy and sell prices, and two additional columns of values that denote the beginning of major cycles, the beginning of minor cycles as well as the ends of periods of increasing positive momentum.
- The main underlying value is the close column value for a ticker symbol on a date. This is because the MACD indicator depends on close prices for a trading date. Additionally, the signal indicator depends indirectly on close column values because it is an exponential moving average of the MACD indicator. The MACD indicator and signal indicator columns are derived from the #temp_for_ewma table.
- The other underlying values, such as date, symbol, row_number, ewma_12, and ewma_26, are also derived from the #temp_for_ewma table.
- It is important to understand that the MACD indicator and the signal indicator cannot be known for a trading date until after the close of trading on a trading date. Therefore, traders without access to after-hours and pre-market trading (the majority of retail traders), cannot trade based on MACD indicators until the market opens on the next trading date. The open column value for the next trading date is the first price that can be used to trade a security based on MACD indicators from the current trading date.
Two new columns in the #for_macd_trade_model table are computed with case statements.
- The values of the [1 for macd>0] column denote the beginning and end of major increasing positive momentum cycles.
- The values of the [1 for macd>signal] column can denote the beginning and end of a minor positive momentum cycles as well as the end of the initial set of rows showing increasing positive momentum in a major cycle.
-- add two new columns ([1 for macd>0] and [1 for macd>signal]) for the macd trade model
-- and drop the macd_histogram column from the #temp_for_ewma table
-- save the results in the #for_macd_trade_model table
-- trade model data are set to start optionally in 'January 1, 2019'

drop table if exists #for_macd_trade_model

select
 date
,symbol
,[open]
,[close]
,row_number
,ewma_12
,ewma_26
,macd
,signal
,
 case
   when macd > 0 then 1
   else 0
 end [1 for macd>0]
,
 case
   when macd > signal then 1
   else 0
 end [1 for macd>signal]

into #for_macd_trade_model
from #temp_for_ewma
where [date] >= 'January 1, 2019'
order by date

-- optionally echo #for_macd_trade_model
-- select * from #for_macd_trade_model order by date
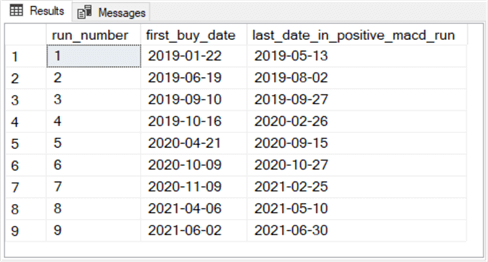
There is one additional data source for the MACD trade model. This source data is from the #first_buy_date_and_last_date_for_positive_macd_runs table. The T-SQL code for creating and populating this table is in this tip's download. The results set from the table for the TQQQ symbol contains just three columns of data for 9 rows for the sample data reported on in this tip.
The source data for the model in this tip depends on trading data from the first trading date in 2019 through the last trading date on or before June 30, 2021. Over this range of trading dates, there are 9 major cycles for the TQQQ ticker symbol. The following screen shows the results set displaying the 9 rows for the three columns of data.
- The run_number column contains sequential numeric identifiers for each of the nine sets of major cycles with increasing positive momentum that occurred in the date range from the beginning of 2019 through June 30, 2021.
- The first_buy_date column reveals the beginning date of the first buy date within a major cycle.
- The last_date_in_positive_macd_run displays the end date within a major cycle. A major cycle extends from first buy date within a major cycle through the last date in the cycle for which [1 for macd>0] is 1.
The first_buy_date column value defines the date for the first security buy within each major cycle. This column of values is used in a subsequent T-SQL script to specify the first buy date for each major cycle.
Specifying buy_price and sell_price values for each buy_sell cycle in the MACD trade model
The contents of the #for_macd_trade_model table and the #first_buy_date_and_last_date_for_positive_macd_runs table can be processed to create and populate a new table with just buy and sell rows that follow the rules of the MACD trade model. The T-SQL code that implements the processing concatenates three results sets
- One with rows from the #first_buy_date_and_last_date_for_positive_macd_runs table
- A second results set with buy_price rows extracted from the #for_macd_trade_model table
- A third results set with sell_price rows extracted from the #for_macd_trade_model table
The outcome of the concatenated results sets are saved in the #buy_price_sell_price table. Here are some guidelines for compiling and using the #buy_price_sell_price table.
- Each row in the #first_buy_date_and_last_date_for_positive_macd_runs table has a date for the first trade of each major cycle of increasing positive momentum trades, but it does not contain information, such as the buy price for a security and the MACD indicators associated with the decision to buy. Therefore, the first results set joins the #first_buy_date_and_last_date_for_positive_macd_runs table with the #for_macd_trade_model table. The results set from this join contributes just nine rows for the TQQQ symbol to the concatenated results set.
- Each row in the second results set reveals a date and an associated open price for when a security is bought because of the onset of a period of increasing positive momentum.
- Each row in the third results set reveals a date and an associated open price for when a security is sold because of the end of a period of increasing positive momentum.
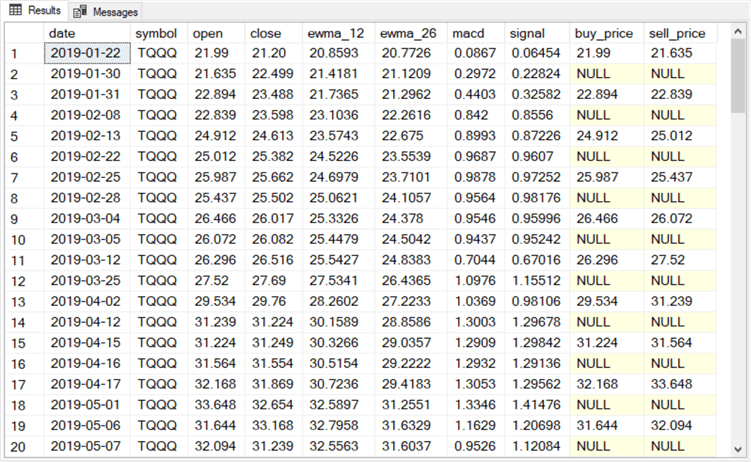
Here is an excerpt from the top twenty rows of the #buy_price_sell_price table. Each buy_sell cycle is represented by two rows.
- The first row has the buy price for the first major cycle of rows.
- Notice that the buy_price column value matches the open column value for the first row.
- This row corresponds to the row from the #for_macd_trade_model table with a date that matches the date in the first row from the #first_buy_date_and_last_date_for_positive_macd_runs table.
- The date for the first row is 2019-01-22. This is the trading date after the row for which the [1 for macd>0] column initially changes from 0 to 1.
- The first row also has a sell_price column.
- The sell_price column value in the first row matches the open column value in the second row.
- The date for the second row corresponds to the row after the [1 for macd>signal] column value switches from 1 to 0. The date column value for this row is 2019-01-30.
- Subsequent odd numbered rows in the results set excerpt contain both the
buy_price and sell_price for successive trades based on the MACD trade model
guidelines. As a result, only odd numbered rows are required for evaluating
the change in price for successive trades. Additionally, odd numbered
rows can indicate whether a trade resulted in a winning trade or a losing trade.
- The trade is a winning trade when the sell_price column value is greater than the buy_price column value.
- The trade is a losing trade when the sell_price column value is less than or equal to the buy_price column value.
Here is the T-SQL script for creating and populating a fresh copy of the #buy_price_sell_price table. The overall design of the script includes two outer queries and an inner query that performs the union of the three results sets that comprise the #buy_price_sell_price table. The inner query is contained within the for_buy_and_sell_prices subquery.
- The first part of the inner query performs the join of the #for_macd_trade_model and #first_buy_date_and_last_date_for_positive_macd_runs tables. The join is based on matching date column values between both tables. The rows from this join are for the first row of major cycles in the source data.
- The second part of the inner query is to extract rows from the #for_macd_trade_model table that have open column values that can serve as buy prices after the first buy price for a major cycle. This part has a subquery named for_buy_date_and_price within it. The subquery pulls all columns from the #for_macd_trade_model table and adds three more columns to help verify that a row is for buying a security. A where clause in the outer query for the second part selects just rows that are suitable for contributing values to the buy_price column from the open column.
- The third part of the inner query performs the same functions as the second part, except that the functions are performed to return valid sell_price rows instead of buy_price rows.
After the two union operators concatenate three results sets, the inner-most outer query copies the sell_price column value following buy_price rows to the sell_price_from_next_row column of the buy_price rows. The inner-most outer query returns its results set through the for_a_buy_price_row_without_trailing_sell_price_row subquery.
The outer-most outer query accepts the results set from the for_a_buy_price_row_without_trailing_sell_price_row subquery. The outer-most query renames the sell_price_from_next_row column to the sell_price column via an alias name. Additionally, the outer-most outer query filters its result set to exclude any buy_price row without a trailing sell price row. This filter operates when a buy occurs within the range of dates being analyzed, but its matching sell occurs in a period outside the range of dates being analyzed. Finally, the outer-most outer query creates and populates via an into clause the #buy_price_sell_price table.
drop table if exists #buy_price_sell_price

-- select of all buy_price and sell_price rows
-- excluding last buy_price row without a trailing sell_price row
-- this query saves buy_price and sell_price for all trades in #buy_price_sell_price
select
 [date]
,symbol
,[open]
,[close]
,ewma_12
,ewma_26
,macd
,signal
,buy_price
,sell_price_from_next_row [sell_price]
into #buy_price_sell_price
from
(
-- create set of buy_price and sell_price rows based on
-- concatenation of echo results set from #first_buy_date_and_last_date_for_positive_macd_runs,
-- set of all buy_price rows after first buy price in each macd > 0 set, and
-- set of all sell_price rows after first buy price in each macd > 0 set
-- and add column named sell_price_from_next_row
select *,lead([sell_price],1) over (order by date) sell_price_from_next_row
from
(
-- echo results set from #first_buy_date_and_last_date_for_positive_macd_runs
select
 #for_macd_trade_model.[date]
,#for_macd_trade_model.symbol
,#for_macd_trade_model.[open]
,#for_macd_trade_model.[close]
,#for_macd_trade_model.ewma_12
,#for_macd_trade_model.ewma_26
,#for_macd_trade_model.macd
,#for_macd_trade_model.signal
,#for_macd_trade_model.[open] [buy_price]
,null [sell_price]
from  #first_buy_date_and_last_date_for_positive_macd_runs
join #for_macd_trade_model
on #first_buy_date_and_last_date_for_positive_macd_runs.first_buy_date
   = #for_macd_trade_model.date

union

-- extract buy_price based on
-- date after @first_buy_date and
-- date is in [1 for macd>0] = 1
-- two before: macd > 0
-- two before: macd is not > signal
-- one before: macd is > signal
select
 [date]
,symbol
,[open]
,[close]
,ewma_12
,ewma_26
,macd
,signal
,[open] buy_price
,null [sell_price]
from
 (
-- for buy date and price
select
 *
,lag([1 for macd>0],2) over (order by row_number) [1_for_macd>0_lag_2]
,lag([1 for macd>signal],2) over (order by row_number) [1_for_macd>signal_lag_2]
,lag([1 for macd>signal],1) over (order by row_number) [1_for_macd>signal_lag_1]
from #for_macd_trade_model
) for_buy_date_and_price
where
   [date] > @first_buy_date  and
   [1 for macd>0] = 1 and
   [1_for_macd>signal_lag_2] = 0 and
   [1_for_macd>signal_lag_1] = 1 and
   [1_for_macd>0_lag_2] = 1

union

-- extract sell_price based on
-- date after @first_buy_date
-- date is in [1 for macd>0] = 1
-- two before: macd > 0
-- two before: macd is > signal
-- one before: macd is not > signal
select
 [date]
,symbol
,[open]
,[close]
,ewma_12
,ewma_26
,macd
,signal
,null buy_price
,[open] sell_price
 from
 (
-- for sell date and price
select
 *
,lag([1 for macd>0],2) over (order by row_number) [1_for_macd>0_lag_2]
,lag([1 for macd>signal],2) over (order by row_number) [1_for_macd>signal_lag_2]
,lag([1 for macd>signal],1) over (order by row_number) [1_for_macd>signal_lag_1]
from #for_macd_trade_model
) for_sell_date_and_price
where
   [date] > @first_buy_date  and
   [1 for macd>0] = 1 and
   [1_for_macd>signal_lag_2] = 1 and
   [1_for_macd>signal_lag_1] = 0 and
   [1_for_macd>0_lag_2] = 1
) for_buy_and_sell_prices
) for_a_buy_price_row_without_trailing_sell_price_row
where ((buy_price is not null and sell_price_from_next_row is not null)
   or sell_price is not null)

-- optionally echo results set for #buy_price_sell_price
-- with sell_price moved to buy_price row for each trade
-- select * from #buy_price_sell_price
Reports for ticker symbols from the MACD trade model
The goal of this section is to reveal the performance of the MACD trade model for the six ticker symbols evaluated in this tip. Naturally, there is a bit of data manipulation to generate even the simple reports shown in this section. In the interest of keeping the focus on the model, this code is not discussed in the tip, but it is available for your review from the tip's download.
The following table includes a single column with six rows – one for each of the six ticker symbols evaluated with MACD trade model. The script for this tip extends over 500 lines. The last hundred lines or so are devoted to reporting results for a ticker symbol. At the top of the script for the model (see the screen shot below), there is a declare statement for assigning a ticker symbol to the @symbol local variable. By changing this assignment statement between successive runs of the script, you can generate a report for each of the six ticker symbols that reveals model performance. The following screen shot shows a script excerpt with UDOW assigned to the @symbol local variable. By examining the table below, you can tell that UDOW is the last ticker symbol used when running the script.
Within each table row are three types of information
- The ticker symbol for the reported results
- Information about the total number of trades specified by model as well as the share of winning trades
- Information about various account balances starting with an initial account
balance of $1000. The initial account balance, or the balance from the
preceding trade, is multiplied by the rate of change from each successive trade
and added to the prior account balance to compute a new account balance for
the next trade or a final cumulative account balance if no further trades are
specified by the model. The report for each ticker symbol includes
- The minimum cumulative balance across all the trades for ticker symbol
- The maximum cumulative balance across all the trades for ticker symbol
- The final cumulative balance for a ticker symbol's last trade
- The percent change from the initial balance of $1000 through the final cumulative balance
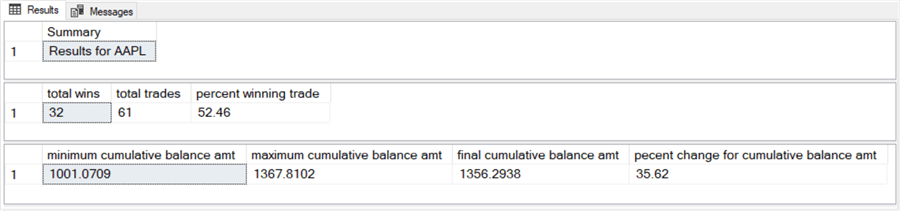
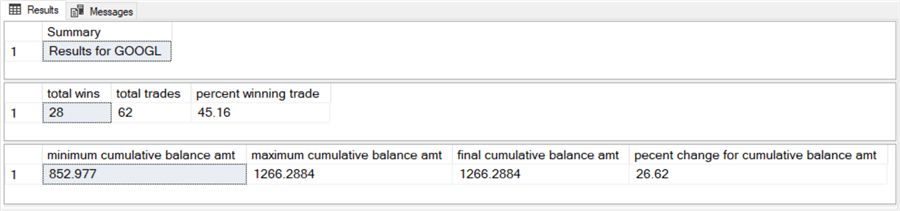
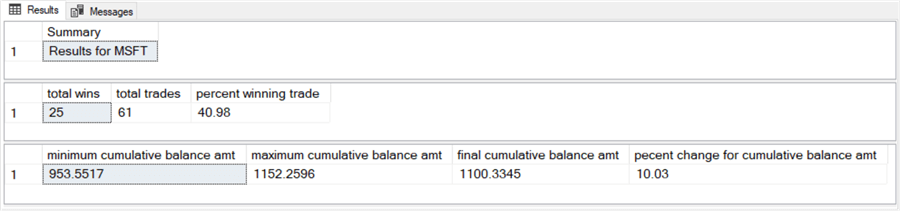
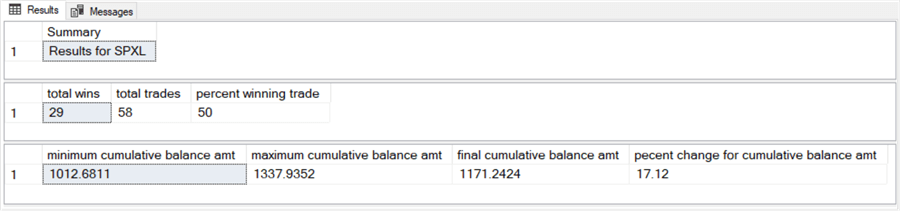

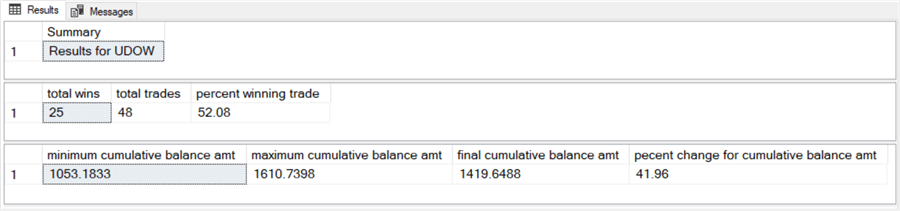
The preceding table shows that all six ticker symbols had a final cumulative trade balance that was greater than the initial balance of $1000. If these results were typical for any ticker symbol, then the results confirm the model can accumulate wealth over a series of trades for any ticker. While these six ticker symbols are not necessarily representative for any ticker, they include three tickers for widely traded companies (AAPL, GOOGL, and MSFT) as well as three broad index exchange traded funds (SPXL, TQQQ, and UDOW). The overall rate of change of the final cumulative account balance relative to the initial account balance ranged from 48 percent gain for TQQQ down to 10 percent gain for MSFT.
In spite of finding winning trades more than 50% of the time on average, the model did not always select a winning trade. Again, the results differed by ticker symbol. The model discovered the lowest percentage of winning trades for the MSFT; its percentage of winning trades was nearly 41%. In contrast, the highest percentage of winning trades was for the TQQQ symbol; its percentage of winning trades is nearly 54%. The model returned winning trade percentages of less than 50% for two ticker symbols (MSFT and GOOGL). However, even these symbols had a final cumulative balance percentage change that was greater than 0. Therefore, the winning trades can have sufficiently large gains to offset the losing trades.
Next Steps
The MACD indicator and signal indicators can be combined in a model to find winning trades that cause account balances to grow over a period of two and a half years. The T-SQL code illustrates how to design such a model. To get a hands-on feel for how the model works try the script for this tip with the sample open-high-low-close-volume data in the download for this article.
Note: this article is meant to illustrate analytical modeling techniques for securities over time. The tip does not endorse any technique nor ticker symbol.


About the author
 Rick Dobson is an author and an individual trader. He is also a SQL Server professional with decades of T-SQL experience that includes authoring books, running a national seminar practice, working for businesses on finance and healthcare development projects, and serving as a regular contributor to MSSQLTips.com. He has been growing his Python skills for more than the past half decade -- especially for data visualization and ETL tasks with JSON and CSV files. His most recent professional passions include financial time series data and analyses, AI models, and statistics. He believes the proper application of these skills can help traders and investors to make more profitable decisions.
This author pledges the content of this article is based on professional experience and not AI generated.
View all my tips
Article Last Updated: 2022-01-19
