By: Rick Dobson | Updated: 2022-05-27 | Comments | Related: > TSQL
Problem
Present a use case for making decisions about when to buy and sell a financial security so that the sell price is greater than the buy price. Compute and use Heikin Ashi values along with open prices from the underlying time series data to assist with fulfilling the use case’s objective. Present and invoke the T-SQL code for implementing the use case based on values stored in SQL Server.
Solution
In a couple of recent tips Candlestick and Heikin Ashi Charts from Yahoo Finance and Stooq.com and Compute and Display Heikin Ashi Charts in SQL Server and Python, MSSQLTips.com introduced Heikin Ashi values to SQL Server developers as a way of smoothing time series based on the current period and the prior period. However, the question remains: what’s the use of smoothing time series data by the Heikin Ashi method? One answer to this question may be that Heikin Ashi values enable making profitable decisions about underlying time series data. For the purposes of this tip, the decisions are when to buy and sell a financial security so that the difference between the buy and sell price captures the price change from the buy price through to the sell price.
The T-SQL code and process steps in this tip demonstrate how to
- Compute and save Heikin Ashi values and their underlying time series values in SQL Server
- Process the underlying time series values and their computed Heikin Ashi
values by ticker symbol and date
- The full set of dates are from the first trading date in 2000 through February 18, 2022
- This tip starts out with eleven ticker symbols, but it drills down on how to make decisions for just one of the ten tickers. Also, it generates buy and sell decisions for a subset from the full set of dates
- If you choose,
- you can extend the use case analysis to the remaining ten tickers with the data in the download from this tip
- You can also try running the code for calculating buy and sell dates across different subsets of date ranges beyond those reported on in this tip
- The tip presents and describes the code for calculating buy and sell decisions via a simple model
Getting to know the underlying time series and Heikin Ashi values in this tip
The underlying time series for this tip are contained in a table named yahoo_finance_ohlcv_values_with_symbol. The data in the table have observed open, high, low, and close prices for each trading date. Within this use case, there are two data types: retrieved underlying time series data and computed Heikin Ashi values for the retrieved data.
A stored procedure named for_retrieved_and_HA_candlesticks_by_type both retrieves observed prices from the yahoo_finance_ohlcv_values_with_symbol table and computes Heikin Ashi values based on the observed prices. The stored procedure code for retrieving the time series data and computing the Heikin Ashi values are described in these two prior tips Compute and Display Heikin Ashi Charts in SQL Server and Excel and Compute and Display Heikin Ashi Charts in SQL Server and Python. The current tip arranges the results set from the stored procedure in a slightly different format than either of the prior two tips.
The stored procedure accepts three input parameters to determine the scope of rows extracted from the yahoo_finance_ohlcv_values_with_symbol table. One parameter designates the ticker symbol processed during a run of the stored procedure. The other two parameters designate the start and end dates for which rows are extracted from yahoo_finance_ohlcv_values_with_symbol table.
The results set for the current tip configures the source data for the decision-making model in the following stored procedure excerpt. The code segment is invoked once for each processed ticker symbol. The stored procedure’s results set is composed of two separate results sets that are concatenated into one results set; the union operator performs the concatenation.
- The first one is for observed prices
- The second one is for Heikin Ashi (HA) computed values
The stored procedure code prior to the following code excerpt creates and populates a temp table named #for_temp_HA_candlesticks. This temp table has separate columns for symbol and date row values. There are also four columns for retrieved prices with names of open, high, low, and close. Another set of four columns in the temp table are named HA_open, HA_high, HA_low, and HA_close; these four columns are for computed Heikin Ashi values computed by the stored procedure.
The following code excerpt illustrates the format A new column is added to the first and second results sets in; this column has the name [results for]. The value of the [results for] column for all rows in the first results set is "observed prices". The value of the [results for] column for all rows in the second results set is "HA values". Because of this convention, subsequent code outside the stored procedure can independently manipulate either of these two rowsets.
-- display observed prices results set
select
 date
,[open]
,high
,low
,[close]
,symbol
,'observed prices' [results for]
from #for_temp_HA_candlesticks

union

-- display HA values results set
select
 date
,HA_open  [open]
,HA_high  high
,HA_low   low
,HA_close [close]
,symbol
,'HA values' [results for]
from #for_temp_HA_candlesticks
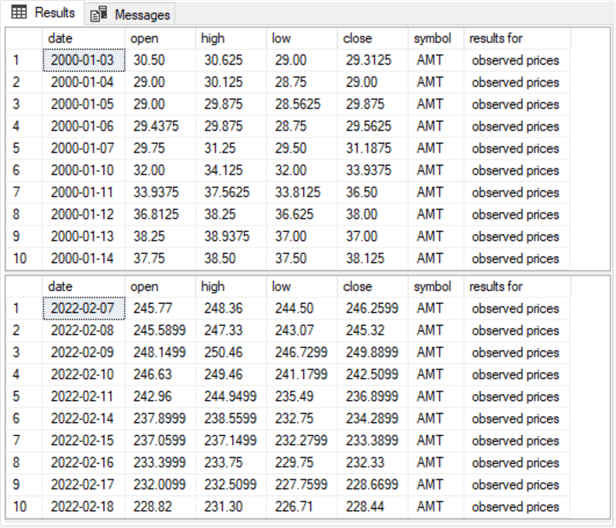
The next screen shot shows the first and last ten rows for the observed prices data type for the AMT ticker; this ticker is for the American Tower Corporation, a global real estate investment trust. The [results for] column values indicates that these data are observed prices. The AMT open price per share grew from the 20’s and 30’s at the beginning of 2000 to as high as 248.15 on February 9, 2022.
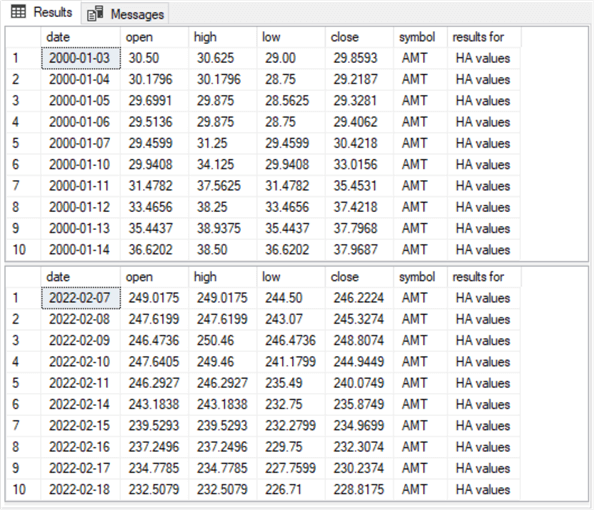
The next screen shot shows comparable results for computed Heikin Ashi values. The [results for] column contains a string value of "HA values". Recall that the Heikin Ashi values are smoothed observed prices. Therefore, the Heikin Ashi open values are similar, but not identical, to the observed open prices. You can get a visualization of how the observed prices contrast with Heikin Ashi computed values from this prior tip Compute and Display Heikin Ashi Charts in SQL Server and Python. In fact, the prior tip visualizes a couple of different approaches for how to use observed prices and Heikin Ashi values to facilitate making decisions about when to buy and sell securities. This tip programmatically implements one of these approaches.
Configure and populate a table for the decision-making model
This section highlights how to configure and populate a SQL Server table in a format that enables the decision-making model presented in the next section. The model decisions are about when to buy and sell a financial security represented by a ticker value. In order to provide some context for the T-SQL code that configures and populates the model’s source data table, this section begins with some commentary about why Heikin Ashi values for the current period can project future underlying time series values.
Computed Heikin Ashi values smooth the underlying data in a way that visually highlights when underlying prices are rising, falling, or staying flat. When Heikin Ashi values are rising, the candlestick bodies displaying smoothed open and close prices are colored green. When Heikin Ashi values are not rising, the candlestick bodies are colored red. To the degree that a succession of candles is mostly green or red, you can use the color for the current candle as an indicator of whether prices are likely to rise or fall in the near term.
- After a candle turns green from a preceding run of red candles or mostly red candles, then it may be a starting point for a run of green candles, which is equivalent to a rising price trend.
- When the candle color switches from green to red, the rising price trend is ending.
- Candle colors are determined by Heikin values.
- If the Heikin Ashi close value is greater than the Heikin Ashi open value, then the candle body color is green. Sometimes, analysts use white or clear instead of green for a candle with a higher close value than an open value.
- Otherwise, the color is red. Sometimes, analysts use a black candle instead of a red one when the open value is greater than a close value.
- Because you cannot know the Heikin Ashi value for a period until the close of a trading day, the model can only issue a buy signal or a sell signal on the period after a color changes.
- Then, on the next trading day the model can execute a buy action or a sell action at the open of trading on the next trading period.
- In order to compute the price change from a buy action through to the next sell action, you can compute the difference in open prices from the buy action date through to the sell action date.
- Open prices are available from the observed prices rowset.
The code to create and populate a table on which the decision-making model in the next section operates has two parts.
- The first part sets up for a succession of passes through a while loop in the second part.
- The second part passes through a while loop for each of eleven ticker symbols for which data are extracted in this tip.
Here is the code for the first part.
- It starts with a use statement that declares a default database (DataScience). You can use any SQL Server default database that you prefer to use instead.
- Next, a drop table if exists statement precedes a create table statement to create a fresh copy of the dbo.retrieved_candlesticks table. This table stores a results set from the dbo.for_retrieved_and_HA_candlesticks_by_type stored procedure for a ticker symbol. This tip generates eleven results sets – one for each pass through a while loop in the second part. Each pass through the loop is for a different ticker symbol.
- Next, a drop table if exists statement precedes a create table statement to create a fresh copy of the dbo.HA_values_w_candle_color_and_open_observed_price table. This table stores the dataset that the model in the next section uses to specify buy and sell actions.
- After creating fresh versions of the two preceding tables, the code issues
a set of declare statements.
- @symbol, @start_date, and @end_date are three local variables that store input parameters for the dbo.for_retrieved_and_HA_candlesticks_by_type stored procedure
- @table_of_symbols is the name for a table variable that stores data for the eleven tickers used in this tip
- @count_of_symbol and @current_row are two local variables to assist
with passes through the while loop in the second part.
- The @count_of_symbol local variable stores the number of ticker symbols in an application of the use case described in this tip. There are eleven ticker symbols for this tip, but you can use more or less tickers depending on your application for the use case.
- The @current_row local variable tracks the symbol_number in the @table_of_symbols table variable for the current pass through the while loop in the second part. The @current_row local variable is initialized to 1.
- The next-to-last statement in the first part populates the rows in the @table_of_symbols table variable.
- The last statement in the first part assigns a computed value to the @count_of_symbol local variable.
use DataScience
go

-- create fresh version of dbo.retrieved_candlesticks
-- for ticker symbols

drop table if exists dbo.retrieved_candlesticks

create table dbo.retrieved_candlesticks(
 date date
,[open] money
,high money
,low money
,[close] money
,symbol nvarchar(10)
,[results for] nvarchar(20)
)

drop table if exists dbo.HA_values_w_candle_color_and_open_observed_price

create table dbo.HA_values_w_candle_color_and_open_observed_price(
 date date
,[open] money
,high money
,low money
,[close] money
,symbol nvarchar(10)
,[results for] nvarchar(20)
,[close - open] money
,candle_color nvarchar(10)
,open_observed_price money
)

-- declare local variables and a table variable
declare @symbol nvarchar(10), @start_date date, @end_date date
declare @table_of_symbols table (symbol_number int,symbol nvarchar(10))
declare @count_of_symbol int, @current_row int = 1

insert into  @table_of_symbols values
 (1, 'AMT')
,(2, 'AMZN')
,(3, 'HON')
,(4, 'JNJ')
,(5, 'JPM')
,(6, 'MSFT')
,(7, 'NEE')
,(8, 'PG')
,(9, 'SHW')
,(10, 'VZ')
,(11, 'XOM')

set @count_of_symbol = (select count(*) from @table_of_symbols)
Here is the code for the second part. The goal for this part is to populate the dbo.HA_values_w_candle_color_and_open_observed_price table, which contains the source data for the model in the next section.
- The first line of code initiates a while loop. The while statement
operates for as long as the value for the @current_row local variable is less
than or equal to the value of the @count_of_symbol local variable.
- A begin…end code block trails the while statement.
- The last line within the code block increments the @current_row local variable by 1.
- Recall that the first part computes the @count_of_symbol local variable value.
- Next, the @symbol, @start_date, and @end_date local variables declared in the first part are assigned values. Then, these local variables are passed as input parameters to the dbo.for_retrieved_and_HA_candlesticks_by_type stored procedure in an exec statement. An insert into statement before the exec statement transfers the results set from the stored procedure to the dbo.retrieved_candlesticks table. Recall that the first part creates a fresh version of the dbo.retrieved_candlesticks table before the start of the while loop.
- Next, any prior version of the dbo.observed_prices table is dropped. Then, the date, open, and symbol columns are extracted from the observed prices rowset in the dbo.retrieved_candlesticks table for rows with a symbol column value equal to the @symbol local variable. The extracted columns are used to populate a fresh version of the dbo.observed_prices table based on values for the current value of @symbol.
- Next, any prior version of the dbo.HA_values_w_candle_color table is dropped.
The into clause within the following select statement populates the dbo.HA_values_w_candle_color
table with values from the "HA values" rowset set where the symbol
column equals the @symbol local variable. The main purpose of the select
statement that populates the dbo.HA_values_w_candle_color table is to assign
values to the candle_color column. A case statement makes the assignment.
As the code shows,
- the candle_color column has the string value of "green" whenever the HA close value is greater than the HA open value
- the candle_color column has the string value of "red" whenever the HA close value is less than or equal to the HA open value
- The final bit of code for populating the dbo.HA_values_w_candle_color_and_open_observed_price table uses an insert into statement trailed by a select statement with an inner join between the dbo.HA_values_w_candle_color table and the dbo.observed_prices table. The inner join is based on the date column from each table. This bit of code successively populates the target table (HA_values_w_candle_color_and_open_observed_price) with rows for the current value of @symbol for each pass through the while loop.
- The final select statement outside the while loop displays all rows for the dbo.HA_values_w_candle_color_and_open_observed_price table for the AMT ticker symbol. A subset of the rows for this ticker are used in a unit test within the next section for decision-making code about when to buy and sell a security based on Heikin Ashi values.
-- loop by symbol for concatenating HA values, candle colors,
-- and open observed prices across dates from @start_date through @end_date
-- in dbo.HA_values_w_candle_color_and_open_observed_price
while @current_row <= @count_of_symbol
begin

-- populate dbo.retrieved_candlesticks
-- from [dbo].[for_retrieved_and_HA_candlesticks_by_type] stored proc
set @symbol = (select symbol from @table_of_symbols where symbol_number = @current_row)
set @start_date = '2000-01-01'
set @end_date = '2022-02-18'

insert into dbo.retrieved_candlesticks
exec [dbo].[for_retrieved_and_HA_candlesticks_by_type] @symbol, @start_date, @end_date

-- populate dbo.observed_prices
-- from dbo.retrieved_candlesticks

drop table if exists dbo.observed_prices

select
 date
,[open] open_observed_price
,symbol
into dbo.observed_prices
from dbo.retrieved_candlesticks
where
 symbol = @symbol and
 [results for] = 'observed prices'

-- optionally echo dbo.observed_prices
-- select * from dbo.observed_prices

-- populate dbo.HA_values_w_candle_color

drop table if exists dbo.HA_values_w_candle_color

select
 date
,[open]
,high
,low
,[close]
,symbol
,[results for]
,([close] - [open]) [close - open]
,
case
 when ([close] - [open]) <= 0 then 'red'
 when ([close] - [open]) > 0 then 'green'
 else null
end candle_color
into dbo.HA_values_w_candle_color
from dbo.retrieved_candlesticks
where
 symbol = @symbol and
 [results for] = 'HA values'

-- optionally echo dbo.HA_values_w_candle_color
-- select * from dbo.HA_values_w_candle_color

-- populate dbo.HA_values_w_candle_color_and_open_observed_price
insert into dbo.HA_values_w_candle_color_and_open_observed_price
select HA_values_w_candle_color.*, observed_prices.open_observed_price
from dbo.HA_values_w_candle_color
inner join dbo.observed_prices
on HA_values_w_candle_color.date =
   observed_prices.date

-- increment @current_row by 1 to get next symbol
-- into dbo.HA_values_w_candle_color_and_open_observed_price
set @current_row = @current_row + 1

end

-- echo dbo.HA_values_w_candle_color_and_open_observed_price
select * from dbo.HA_values_w_candle_color_and_open_observed_price where symbol = 'AMT'
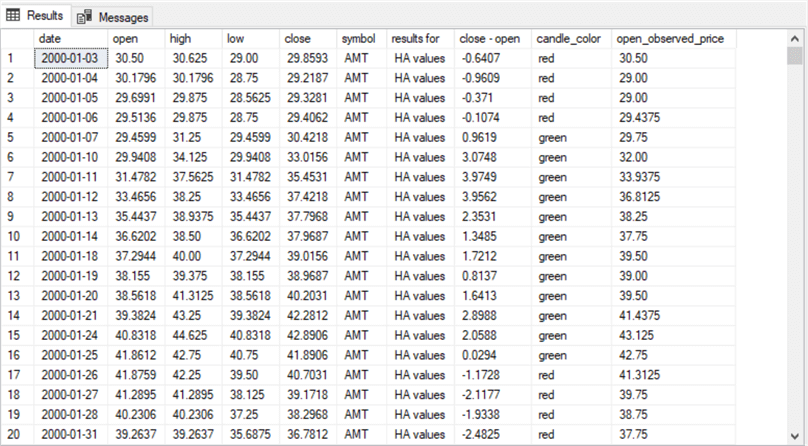
This section closes with a couple of excerpts from the final select statement.
The first excerpt appears below.
- The excerpt is for the trading days in January 2000.
- The rows with a candle_color column value of "green" appears
for dates from 2000-01-07 through 2000-01-25.
- the first green row (row 5) has an open_observed_price of 29.75.
- The last green row (row 16) has an of 42.75.
- The open_observed_price difference demonstrates the tendency for observed prices to rise generally over a contiguous block of green rows.
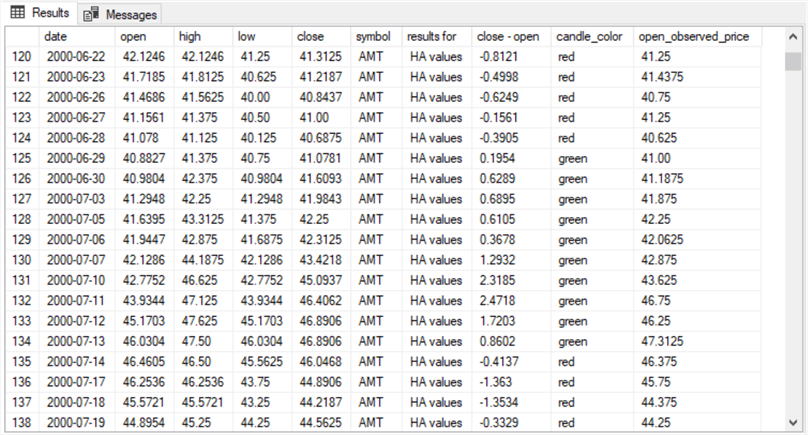
Here’s another example of a block of rows with green candles being associated with rising prices. The overall range of dates in this example is from 2000-06-22 through 2000-07-19.
- The block of rows with green candles is from 2000-06-29 through 2000-07-13.
- From the beginning through the last date in the range of green rows, the open_observed_price value grows from 41.00 dollars per share through 47.3125 dollars per share.
- Again, prices grow over the range of dates with contiguous green candles.
Unit test for decision-making code based on Heikin Ashi values
This section introduces the basics of a simple model for choosing when to buy and sell a security based on Heikin Ashi values. It also describes T-SQL code for implementing the model. A subsequent tip will present results confirming how well the model performs at finding profitable buy-sell cycles as well as how well this Heikin Ashi model performs in comparison to other models for finding profitable buy-sell cycles.
An overview of a simple Heikin Ashi model for buying and selling securities
The model issues four types of elements for each buy-sell cycle.
- The first element is a buy signal. The buy signal reflects the detection of a criterion or criteria, which indicates it is time to buy a security on the next trading date.
- The second element is a buy action. The buy action occurs on the trading date immediately after the buy signal. For the purpose of this tip, buy actions always occur on the opening of the trading date in which they occur. As a result, the buy price is the open price on the buy action date.
- The third element is a sell signal. The sell signal reflects the detection of a criterion or criteria that indicates it is time to sell the security on the next trading date.
- The fourth element is the sell action. The sell action occurs on the trading date immediately after the sell signal. Like buy actions, sell actions also occur at the opening of the trading date in which they occur. As a result, the sell price is the open price on the sell action date.
Within this tip, the buy signal criterion looks back four periods from the current period. The second, third, and fourth look-back periods should be for a red Heikin Ashi candlestick. The first look-back period should be for a green candlestick. This pattern of candlestick colors attempts to ensure that observed prices are trending down before the immediately preceding look-back period when they start to trend up.
The buy action criterion is the occurrence of a buy signal in the prior trading period. The color of prior candlesticks does not affect when a buy action occurs, except through the buy signal. The observed open price on the buy action date is the buy price.
The sell signal occurs on the first trading date after the buy action date in which there is a red candlestick, and the sell action date is always the first trading date after the sell signal date. The sell action does not depend on the color of prior candlesticks, except through the sell signal. If additional red candlesticks occur after the one triggering the sell signal, then selling on the sell action date can preserve prior gains and minimize losses from red candlesticks on subsequent trading dates.
The T-SQL code for calculating buy-signal and buy-action column values in the model results set
The primary objective of the next code block is to populate the buy-signal and buy-action columns in the decision-making model results set.
- The script segment starts with a use statement for a default database. You can use any other database that you prefer, but it needs to contain the dbo.HA_values_w_candle_color_and_open_observed_price table created and populated in the "Configure and populate a table for the decision-making model" section.
- Recall that table has data for eleven ticker symbols. The unit test in this section uses just the AMT ticker for demonstration purposes.
- The first part of the model implementation below creates a table for the
model results set and populates the buy-signal and buy-action columns in the
results set. The columns are populated through three nested queries.
- The inner-most query uses the dbo.HA_values_w_candle_color_and_open_observed_price table as its source and four new columns for lags of the candle_color column. These four lags are for the look-back periods from the current period.
- The middle-level query populates the [3_red_buy_signal] column in the
results set. Rows in this column have the value "buy signal"
or null.
- The value is "buy signal" when the immediately preceding lag candle_color is "green" and the three lags before the immediately preceding lag are "red"
- Else the [3_red_buy_signal] column is null
- The outer-most query populates the [buy_action] column. Rows for
this column have the value of "buy action" or null.
- The value is "buy action" when the preceding period has the value of "buy signal" for the [3_red_buy_signal] column
- Else the [buy action] column is null
- The outer-most query also populates the dbo.HA_values_w_candle_color_and_w_buy_signal_buy_action table from the into clause of its select statement. This table (or a derivative from it) can eventually contain all four elements of the decision-making model.
- After the nested select statements, a couple of alter table statements add two columns to the dbo.HA_values_w_candle_color_and_w_buy_signal_buy_action table. The new column names are [sell_signal] and [sell_action]. The values in these columns are populated in a subsequent code block.
- The final statement in the following script excerpt optionally displays the results set as of that point in the model’s code. It optionally displays the results set because you can comment out the select statement. The select statement is not essential for the execution of the model (as a matter of a fact, the select statement is commented out in this tip’s download).
use DataScience
go

-----------------------------------------------------------------------------------------------
-- add lags for look-back periods and buy-signal and buy-action columns to
-- dbo.HA_values_w_candle_color_and_open_observed_price
-- and populate the added columns for buy-signal and buy-action columns
-- then, add sell-signal and sell-action columns

-- test runs of the model are performed for just 1 symbol
declare @symbol nvarchar(10) = 'AMT'


-- create and populate table for assigning buy signal and buy action columns based
-- on HA candle colors for a symbol, such as AMT, for beginning of each buy-sell cycle

drop table if exists dbo.HA_values_w_candle_color_and_w_buy_signal_buy_action

-- assign buy action to criteria-matching dates
-- criteria are: date after a green candle following 3 red candles
select
 *,
case
 when (lag([3_red_buy_signal],1) over (order by date)) = cast('buy signal' as nvarchar(10))
 then cast('buy action' as nvarchar(10))
else null
end [buy_action]
into dbo.HA_values_w_candle_color_and_w_buy_signal_buy_action
from
(
--*/
-- assign buy signal to criteria-matching dates
-- criteria are: a green candle after 3 preceding red candles
select
 date
,HA_open
,open_observed_price
,HA_close
,symbol
,candle_color
,candle_color_lag_1
,candle_color_lag_2
,candle_color_lag_3
,candle_color_lag_4
,
case
 when
  candle_color_lag_1 = 'green' and
  candle_color_lag_2= 'red' and
  candle_color_lag_3 = 'red' and
  candle_color_lag_4 = 'red'
  then cast('buy signal' as nvarchar(10))
 else null
end [3_red_buy_signal]
from
(
-- dbo.HA_values_w_candle_color_and_open_observed_price and
-- candle_color_lag_1, candle_color_lag_2, candle_color_lag_3, candle_color_lag_4
select
 date date
,[open] HA_open
,[close] HA_close
,symbol
,open_observed_price
,candle_color
,lag(candle_color,1) over (order by date) candle_color_lag_1
,lag(candle_color,2) over (order by date) candle_color_lag_2
,lag(candle_color,3) over (order by date) candle_color_lag_3
,lag(candle_color,4) over (order by date) candle_color_lag_4
from dbo.HA_values_w_candle_color_and_open_observed_price
where symbol = @symbol
) for_buy_signal
) for_buy_action

-- add sell_signal and sell_action columns to
-- dbo.HA_values_w_candle_color_and_w_buy_signal_buy_action
alter table dbo.HA_values_w_candle_color_and_w_buy_signal_buy_action
 add [sell_signal] nvarchar(20);
alter table dbo.HA_values_w_candle_color_and_w_buy_signal_buy_action
 add [sell_action] nvarchar(20);


-- optionally display source data columns for all dates
-- buy-signal, buy-action, sell-signal, and sell-action columns
   select * from dbo.HA_values_w_candle_color_and_w_buy_signal_buy_action
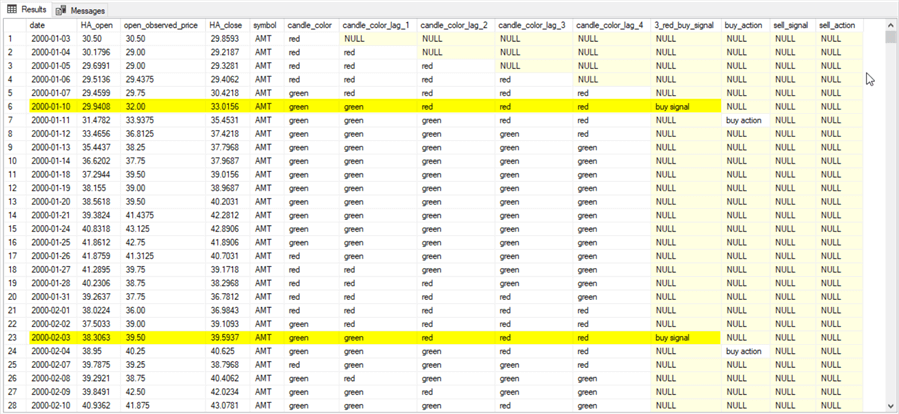
The following screen shot shows the first 28 rows from the results set for the last select statement in the preceding script excerpt.
- A yellow highlight overlays two rows with dates of 2000-01-10 and 2000-02-03. These two rows are, respectively, for the first and second buy signals.
- The candle_color_lag_1, candle_color_lag_2, candle_color_lag_3, and candle_color_lag_4 column values show the candle color name for each set of four preceding look-back periods. On each row, the look-back period colors are green, red, red, and red. These are the criteria for a buy-signal row.
- The rows following the buy-signal rows have a value of "buy action" in their buy_action columns. This is because a "buy action" in the buy action column is dependent on a preceding row with "buy signal" in the [3_red_buy_signal] column.
The T-SQL code for calculating sell-signal and sell-action columns in the model results set
The following code shows an approach for populating sell-signal and sell-action rows that match the buy-signal and buy-action rows from the code in the previous subsection. There are three parts to the code in this subsection. The code for each part is separated from its preceding part by a line of comment markers (--…).
- The first part creates a temp table (#temp) with a subset of rows from the full results set returned by the code in the previous subsection. When the comment marker for the select statement at the end of this part is removed, then the first part can display all rows in the selected subset.
- The second part finds sell-signal and sell-action rows for the first pair of buy-signal and buy-action rows.
- The third part searches for remaining sell-signal and sell-action rows for remaining complete buy-sell cycles. It displays results for all complete buy-sell cycles. Rows for cycles that have buy-signal and buy-action with no matching sell-signal and sell-action rows are deleted from the code’s results set.
The code at the top of the following code excerpt takes a subset of the results set from the previous subsection. The subset is stored in the #temp table; you can think of the #temp table as a derivative of the dbo.HA_values_w_candle_color_and_w_buy_signal_buy_action table. The purpose for this first step is to select source data that ends with buy-signal and buy-action elements that have no matching sell-signal and sell-action elements. When developing models for buy-sell cycles, it is useful to define logic for removing rows at the end of the source data that do not define complete buy-sell cycles. Depending on your selection criteria for underlying source data, you may or may not have this condition in your model results set.
The code for the second part in this subsection includes two update statements. These statements assign "sell signal" and "sell action" values to the sell_signal and sell_action columns in the model results set for the first buy-sell cycle. The first buy-sell cycle in a time series is always different from the remaining buy-sell cycles in that there is no preceding buy-sell cycle to assist in defining the contents of the current buy-sell cycle.
- The sell signal for the first buy-sell cycle depends on a preceding red color candle row that occurs after the preceding first buy-action row.
- The sell action for the first buy-sell cycle occurs at the minimum trading date that is greater than the date for the first sell signal row.
The code for the third part in the subsection iterates through blocks of source data rows with a goto loop that transfers control to a statement with a label of "find_another_sell_action". The goto loop is exited via an if statement that checks for a condition indicating that there are no remaining "sell signal" rows in the source data. There are four top-level statements in the third part.
- The first top-level statement has the "find_another_sell_action"
label.
- This statement is an update statement to denote the next sell-signal row in the model results set.
- This update statement positions the sell-signal relative to the prior buy-signal and buy-action rows.
- The second top-level statement is the if statement that can terminate the
search for additional rows and clean up the end of the model results set.
- When the @@ROWCOUNT global variable equals zero, there are no rows affected by the preceding update statement.
- When there are zero rows affected from the preceding update statement, there are no remaining sell-signal rows (and consequently sell action rows).
- Four second level actions are performed within the begin…end
block nested in the if statement.
- First, a pair of select statements indicate that no more sell-signal rows are available after the last date with a complete buy-sell cycle.
- Second, any row after the last complete buy-sell cycle is deleted from the model results set.
- Third, a results set is displayed for all source data rows belonging to complete buy-sell cycles.
- Fourth, a return statement transfers control out of the current code batch. This causes the script to halt execution.
- The third top-level statement is an update statement for the sell-action row that trails the preceding sell-signal row. The statement implements the model rules for defining a sell-action row.
- The fourth top-level statement is the goto statement that transfers control to the statement with the "find_another_sell_action" label.
-- populate in #temp runs of green HA candles for a symbol for subset of rows
-- through '2000-07-02'
drop table if exists #temp

select *
into #temp
from (
select
 [date]
,[HA_open]
,[open_observed_price]
,[HA_close]
,[symbol]
,[candle_color]
,[candle_color_lag_1]
,[candle_color_lag_2]
,[candle_color_lag_3]
,[candle_color_lag_4]
,[3_red_buy_signal]
,[buy_action]
,[sell_signal]
,[sell_action]
from dbo.HA_values_w_candle_color_and_w_buy_signal_buy_action
where
 date <= '2000-07-02'
 ) for_foo

-- optionally display full subset of rows
-- select * from #temp

-----------------------------------------------------------------------------------------------

-- search for sell_signal (and sell_action) rows for the first buy-sell cycle

-- update for first sell signal
update #temp
 set [sell_signal] = 'sell signal'
where [candle_color_lag_1] = 'red' and
date =
(
-- date for first sell signal
select min(date) next_sell_signal_date
from #temp
where [candle_color_lag_1] = 'red' and
date > (select min(date) from #temp where [buy_action] = 'buy action')
)

-- update for first sell action
update #temp
 set [sell_action] = 'sell action'
where date =
(
-- date first sell action date
select min(date) first_sell_action_date
from #temp
where date >
(
select min(date) next_sell_signal_date
from #temp
where [candle_color_lag_1] = 'red' and
date > (select min(date) from #temp where [buy_action] = 'buy action')
)
)

------------------------------------------------------------------------------------

-- then search for sell_signal (and sell_action) rows
-- for buy-sell cycles after the first buy-sell cycle
-- start with the statement having a label of
-- find_another_sell_action

-- update for next sell signal

find_another_sell_action:
update #temp
 set [sell_signal] = 'sell signal'
where date = (
 -- next sell signal date
select min(date) next_sell_signal_date
from #temp
where [candle_color_lag_1] = 'red' and
date > (
-- current buy_action date
select min(date) [current buy_action date]
from #temp
where [buy_action] = 'buy action' and
 date >
 (-- [prior sell_action date]
 select max(date) [prior sell_action date]
 from #temp
 where [sell_action] = 'sell action')
))

-- if there is no sell_signal row for the prior buy_action row,
-- then the current buy-sell cycle cannot be completed
-- because there is no data with which to complete it
-- inform the user, then delete the current buy-sell cycle
-- with incomplete data and display the buy-sell cycles through
-- the last complete buy-sell cycle
if @@ROWCOUNT = 0
 begin
   -- diagnostic message
   select 'No more sell_signal rows available after:' [diagnostic message];
   select max(date) [last prior sell_action date]
   from #temp
   where [sell_action] = 'sell action';

   -- trim the full results of rows with an incomplete buy-sell cycle
   delete from #temp
   where date >
   (
    select max(date) [last prior sell_action date]
    from #temp
    where [sell_action] = 'sell action'
   );

   -- display results set through the last complete buy-sell cycle
   select * from #temp;

   -- transfer out of batch with goto loop
   return
 end

-- update for next sell action
update #temp
 set [sell_action] = 'sell action'
where date = (
select min(date) [current sell_action date]
from #temp
where date >
(
select max(date) [current sell_signal date]
from #temp
where [sell_signal] = 'sell signal'
)
)

-- continue search for any remaining sell_action rows
   goto find_another_sell_action;
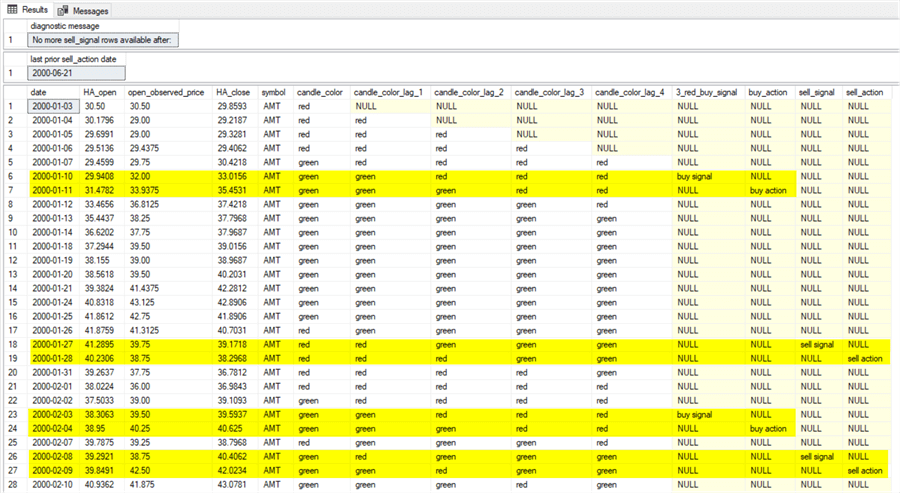
The following screen shot is an excerpt from the results set generated by the select statement in the begin…end block within the if statement in the preceding script. This screen matches and extends the prior screen shot showing the buy-signal and buy-action rows for the first two buy-sell cycles in the model results set. The extension is that the following screen shot adds the sell-signal and sell-action rows for the first two buy-sell cycles in the model results set.
- Both sell-signal rows have a string value of "red" for the preceding candle color (candle_color_lag_1). This is a requirement for a sell-signal row after a preceding buy-action row.
- Also, both sell-action rows have a string value of "sell signal" for the preceding row in the sell_signal column. Recall that this is the requirement for a sell-action row.
This completes the unit test for the script that populates sell_signal and sell_action columns. The code performs according to its specification for these two buy-sell cycles.
Next Steps
The main purpose of this tip is to introduce you to T-SQL coding techniques for choosing a buy date and a sell date based on Heikin Ashi values. One simple model was specified, coded, and unit tested to illustrate how to start modeling buy and sell decisions for a security based on Heikin Ashi values.
The download for this tip equips you to perform the unit test for the Heikin Ashi model in T-SQL for all eleven ticker symbols for which data was prepared in this tip. You can use the contents of the download to duplicate results that appear in the tip as well as extend the results in the tip for other dates and other ticker symbols.
- A csv file provides source data for running the simple model based on Heikin Ashi values with any of eleven tickers for any set of time series starting from January 2000 through February 18, 2022. Import the contents from the csv file into a table named HA_values_w_candle_color_and_w_buy_signal_buy_action in the dbo schema of the DataScience database or whatever other database that contains the SQL Server table with the contents of the csv file.
- The calculate_HA_buy_action_and_sell_action_dates.sql file contains the T-SQL code for running the model with the source data imported from the csv file into a SQL Server table and displaying the model results set.


About the author
 Rick Dobson is an author and an individual trader. He is also a SQL Server professional with decades of T-SQL experience that includes authoring books, running a national seminar practice, working for businesses on finance and healthcare development projects, and serving as a regular contributor to MSSQLTips.com. He has been growing his Python skills for more than the past half decade -- especially for data visualization and ETL tasks with JSON and CSV files. His most recent professional passions include financial time series data and analyses, AI models, and statistics. He believes the proper application of these skills can help traders and investors to make more profitable decisions.
This author pledges the content of this article is based on professional experience and not AI generated.
View all my tips
Article Last Updated: 2022-05-27
