By: Rick Dobson | Comments | Related: > TSQL
Problem
Our stock advisory newsletter has 50-day and 200-day moving averages in a SQL Server database on a set of stocks that we recommend our clients to watch. We want to inform our clients about golden crosses and death crosses for stocks in our recommended watch lists. Please present some T-SQL code samples to help us with this goal as well as some analysis to evaluate the benefit we can expect to deliver to our clients.
Solution
Golden crosses and death crosses are two well-known technical indicators for tracking when it is time to buy and sell stocks. The golden cross denotes a time when an indicator for close prices transitions from a weaker value to a stronger value. A golden cross is often defined by a stock's 50-day moving average moving from below to above its 200-day moving average.
A death cross, in contrast to a golden cross, provides a late signal for when to exit a position in a security. While both the golden cross and the death cross are late signals, the lateness of the indicator is more critical for the death cross. The death cross is typically defined as when the 50-day moving average falls from above to below a stock's 200-day moving average. The death cross is recognized as a late signal because close prices usually falls for a number of periods before the 50-day moving average drops from above to below the 200-day moving average. If the stock's close price has risen substantially from a prior golden cross, this late signal may still represent a profitable exit point from a position.
Technical analysts and traders do not regularly examine whether to use an arithmetic moving average or an exponential moving average when detecting golden crosses and death crosses. However, this tip does make that comparison so that you can have some guidance for which type of moving average is better for detecting profitable golden crosses and death crosses. There are additional types of moving averages that you can consider, but these are outside the scope of this tip.
The tip also includes analysis for the profitability of buying stocks at golden crosses and selling them at death crosses. This will provide some guidance of the practical usefulness of the two technical indicators.
A brief introduction to golden crosses and death crosses
There is not perfect agreement among analysts about how to define golden crosses and death crosses. However, they are typically defined by looking for when a faster moving average rises or falls relative to a slower moving average. Here are some references ( reference 1, reference 2, reference 3, reference 4 ) for you to start researching the topic on your own.
For the purposes of this tip, the faster moving average is a 50-day moving average for a stock's close prices on trading days. The slower moving average is one with a 200-day moving average for a stock's close prices on successive trading days. This tip's focus is on how to use widely available end-of-day price and volume data. When used this way, the more days between the golden cross and the death cross, the greater the opportunity there is for a stock's price to rise relative to its buy price. In general, a trader can buy a stock at or around the close price for a golden cross and sell the stock at or around the close price for a death cross. The period duration can be days, as in this tip, or minutes if you are using the technical indicators for day trading.
When evaluating golden crosses and death crosses as buy and sell signals, respectively, you need to find stocks that exhibit the signals over the period for which you have evaluation data. For example, it is possible, or even common, for a stock's 50-day moving average to rise generally over an evaluation period, but this stock never has to have its 50-day moving average fall below its 200-day moving average. This possibility points to a potential weakness of the golden cross as a buy signal. The signal depends on the existence of a period of stock price weakness preceding a period of stock price strength. Exceptionally strong stocks for which the 50-day moving average never falls below the 200-day moving average are excluded from consideration by the definition for a golden cross.
A potential hazard of buying a stock at a golden cross is that the price can start falling immediately or soon after the 50-day moving average rises above the 200-day moving average. If this trend continues, then the buy signal is faulty, and the death cross can signal an exit for a trade before there is time for any substantial gains to appreciate.
Another potential hazard of buying at a golden cross and selling at a death cross relates to the late signal aspect of a death cross - particularly when price gains from the preceding golden cross were never really substantial. The death cross sell signal can only occur after price has fallen from a higher level so that the 50-day moving average falls from above to below the 200-day moving average. If the peak price associated with the 50-day moving average is not sufficiently large, then the fall from the peak close price to the death cross price can fully deplete any appreciated price gains or even result in a loss.
You can help to mitigate both potential hazards by monitoring on a daily basis the percentage price change of the current date's close price to the buy date close price. When the percentage change drops to an unacceptably low value, you can exit a position to preserve gains or minimize losses. A demonstration of this kind of strategy was presented in a prior tip for the Relative Strength Indicator (url not available; tip is in queue). A demonstration of this strategy for golden/death cross cycles is out of scope for this tip. However, I expect this series on programming technical indicators with T-SQL to revisit the topic of strategies for preserving gains between recommended buy and sell dates from traditional technical indicators.
This tip will examine the profitability of detecting golden crosses and death crosses based on either arithmetic moving averages or exponential moving averages. Both kinds of moving averages are widely used in technical analysis, and it is known that exponential moving averages fit more recent data points better than arithmetic moving averages; for example, a prior tip confirmed this outcome. However, is this exponential moving average feature a benefit or a disadvantage when detecting golden crosses as buy signals and death crosses as sell signals? Again, additional T-SQL queries research beyond the scope this tip can generate results to help answer this question.
Picking stocks for golden/death cross detection
The stocks for this examination of golden crosses and death crosses are derived from the AllNasdaqTickerPricesfrom2014into2017 database. This database is especially well suited for this purpose for two key reasons. First, all stock symbols in the database have separate tables of values with both arithmetic and exponential moving averages for close prices. Second, all stock symbols were derived from stocks whose shares are traded on the NASDAQ. Therefore, the results are generally representative of some known universe of stocks - namely, shares listed on the NASDAQ stock exchange.
The code for pulling historical price and volume data for the database from the Yahoo Finance site is available from this tip. This next tip includes a link for downloading a backup file for the database. The database contains tables with historical price and volume data for NASDAQ listed stock symbols as well as arithmetic moving for close prices. You can download from this third tip a script for computing and saving exponential moving averages for the historical close price data in the database. Running the code for computing exponential moving averages will equip your copy of the AllNasdaqTickerPricesfrom2014into2017 database with a table of exponential moving averages for close prices that can be compared to the arithmetic moving averages for close prices that you get with the restored database from the backup file.
There are 3266 distinct stock symbols in the database, but only a small sample of these symbols are suitable for this investigation of golden crosses and death crosses. First, a set of four criteria reduced the available stock symbols to just 245. Second, we searched these stock symbols for those with at least one matched pair of golden and death crosses. Many, but not all, of the symbols with at least one matched pair of a golden cross and a death cross were selected for inclusion in this tip. Therefore, you will be able to practice augmenting the list of stock symbols in the study by finding and including fresh stock symbols with one or more golden/death cross cycles.
The four criteria for discovering symbols that are investment grade stock symbols include the following.
- Each stock symbol was required to have a minimum number of daily traded shares of 100,000. This requirement is to ensure that selected stocks are easily traded.
- Each stock was required to have data for a minimum of 900 trading days. This ensured that each stock symbol had plenty of data for which to detect golden crosses as well as sufficient trading days for each golden cross/death cross cycle to run its course. Some of the golden cross/death cross pairs with the largest stock price gains were for cycles that extended over 200 to 400 trading days. Additionally, you cannot start detecting golden crosses based on arithmetic moving averages until at least 200 days of history is available for a stock.
- All stock symbols must have their most recent trading day on either November 7 or 8, 2017. The data were collected from Yahoo Finance while updates for the current day of trading (November 8, 2017) were still in progress. So, the last trading day could be November 7 or 8, 2018. If a stock did not have data for one of these two days, then it was not regularly traded on a daily basis, and the stock was excluded from consideration for this tip.
- The minimum close price for a stock symbol must be at least $5. Institutional investors, which control the bulk of share transactions, tend to avoid stocks with a share price below $5.
Two hundred forty-five stocks met the above criteria. The vast majority of these stock symbols did not have even one golden/death cross cycle. Twenty-seven stock symbols were ultimately selected for inclusion in this tip's examination of golden/death cross cycles. The following script adds these stock symbols to the ##symbol table and then displays the list of stocks populating the global temporary table.
-- specify symbols used for evaluation

begin try
drop table ##symbol
end try
begin catch
print '##symbol not available to drop'
end catch

select *
into ##symbol
from
(
select 'AAOI' symbol
union
select 'GOOGL' symbol
union
select 'SIVB' symbol
union
select 'ISRG' symbol
union
select 'MSFT' symbol
union
select 'NFLX' symbol
union
select 'PAYX' symbol
union
select 'PLCE' symbol
union
select 'ROST' symbol
union
select 'SANM' symbol
union
select 'SGEN' symbol
union
select 'STLD' symbol
union
select 'TMUS' symbol
union
select 'AMZN' symbol
union
select 'AAXN' symbol
union
select 'ATVI' symbol
union
select 'CINF' symbol
union
select 'CSOD' symbol
union
select 'EGHT' symbol
union
select 'ENDP' symbol
union
select 'INCY' symbol
union
select 'MASI' symbol
union
select 'MIDD' symbol
union
select 'NTRS' symbol
union
select 'PENN' symbol
union
select 'PZZA' symbol
union
select 'SLM' symbol
) for_##symbol

select * from ##symbol
Detecting golden/death cross cycles based on arithmetic moving averages
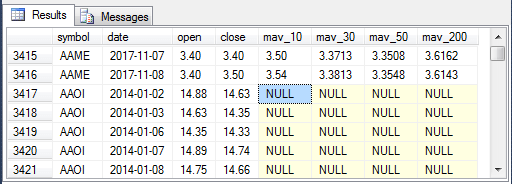
The data in the mav_10_30_50_200 table from the AllNasdaqTickerPricesfrom2014into2017 database contains the input necessary for detecting golden cross and death cross pairs based on arithmetic moving averages of close prices. For each stock symbol in the database, this table contains critical fields, such as: symbol, date, close price, mav_50 for the 50-day moving average of close price, and mav_200 for the 200-day moving average of close price. The mav_10_30_50_200 table concatenates the column value sets for successive symbols one after the other.
The following four screen shots give you an empirical perspective for the layout of the data in the mav_10_30_50_200 table.
- The first screen displays a selection of rows which display the last two rows of data for one stock symbol (AAME) and the first five rows for another symbol (AAOI).
- The moving average columns (mav_10, mav_30, mav_50, and mav_200) are populated with values for the last two rows of data for the AAME symbol, but the moving average columns are all null for the first five rows of the AAOI symbol. Arithmetic moving averages are not defined until sufficient data are available to fill all the periods in the initial moving average. For example, a 50-day moving average is null until the fiftieth period in the time series.
- Because the data for one symbol starts immediately after another in the mav_10_30_50_200 table, you must partition table rows by symbol in order to avoid mixing rows from different symbols when detecting golden crosses and death crosses. Prior MSSQLTips.com tips ( here and here ) demonstrated how to handle partitioning the data by symbol with the help of a while loop that passes through a list of symbols. This tip demonstrates the use of the partition by clause that is available for nearly all T-SQL functions. The partition by clause offers the potential of running faster as the size of the source data scales up.
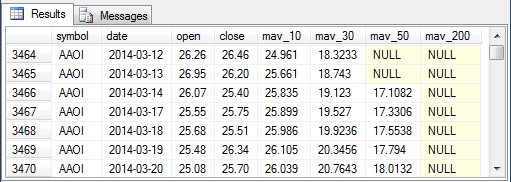
- The second screen shot shows the forty-eighth through the fifty-fourth rows for the AAOI symbol.
- The forty-eighth and forty-ninth rows have null mav_50 column values because the 50-day arithmetic moving average is not defined for these rows.
- The fiftieth through the fifty-fourth rows all have their mav_50 column values populated. Each of these rows has at least fifty preceding close price values.
- The mav_200 column values are null for all rows in the second screen because the 200-day arithmetic moving average is not defined for these rows.
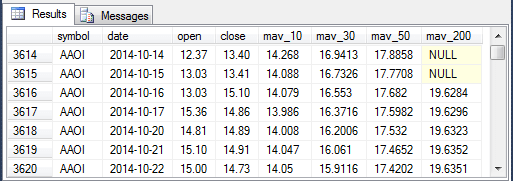
- The third screen shot shows the one hundred ninety-eighth through the two
hundredth fourth rows for the AAOI symbol.
- The first two rows have null mav_200 column values because 200-day moving average values are not defined until the two-hundredth row.
- The remaining mav_200 column values are populated.
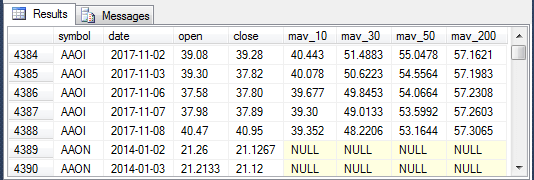
- The fourth screen shot shows the last five rows for the AAOI symbol and
the first two rows for the AAON symbol.
- All mav_50 and mav_200 column values are populated for the AAOI symbol.
- Notice that the lag 1 value for the symbol column in the first row for the AAON symbol points at the AAOI symbol column value for the last row of AAOI data.
The code for detecting matching golden crosses and death crosses from the mav_10_30_50_200 table resides in two separate scripts. These two scripts appear in the following code window.
- The first script focuses on extracting matching golden cross and death cross rows. The script has three nested queries.
- The innermost query, named for_gc_dc_list_by_symbol, assigns values of "gc" to golden cross rows and "dc" to death cross rows.
- Each row is identified with extracted column values for symbol, date, close price, mav_50, and mav_200.
- Next, a pair of case statements computes values for the mav_50_lag_1 and mav_200_lag_1 column values within the innermost query; these two sets of column values are useful for verifying comparisons to the current column values for mav_50 and mav_200 in detecting golden crosses and death crosses.
- The case statement for the row_type column value explicitly assigns values of "gc" for golden cross rows and "dc" for death cross rows; null values are assigned to the row_type column value when the row is for neither a golden cross nor a death cross.
- The second level query, named for_marked_rows_to_delete, marks for deletion selected rows from the result set from the innermost query.
- If the first row for a symbol has a row_type value of "dc", then it is marked for deletion because a golden/death cross cycle cannot start with a death cross. The series of one or more golden/death cross cycles for a symbol must start with a golden cross.
- Similarly, if the last row for a symbol has a row_type value of "gc", then it is marked for deletion. Each row with a "gc" row_type value must be followed by a "dc" row_type value for the end of the golden/death cross cycle to be denoted.
- The where clause for the second level query also limits the result set to just those with symbol column values matching one of the symbols in the ##symbol table.
- The outermost query works in combination with a try…catch block to freshly populate the values in the ##clean_gc_dc_rows table based on the output from the for_marked_rows_to_delete query.
- The where clause for the outer query restricts rows to just those with row_type column values of "gc" or "dc".
- Each golden/death cross cycle is represented by two rows - one to denote the golden cross and a second to denote the death cross.
- The order by clause arranges the rows in an order for proper processing by the second script
- The primary role of the second script is to collapse the two rows per golden/death cross cycle into one row per cycle.
- This operation aims to make data available in a format that facilitates processing the collection of golden/death cross cycles.
- The output from this second script populates the ##clean_gc_dc_single_rows table.
- An inner query in the script named for_single_rows uses lead functions to intermingle the dc_date and dc_close column values from rows with a row_type value of "dc" from the ##clean_gc_dc_rows table with column values from rows with a "gc" row_type value.
- The script saves "gc" row_type rows with selected column values from "dc" rows in the ##clean_gc_dc_single_rows table.
begin try
drop table ##clean_gc_dc_rows
end try
begin catch
print '##clean_gc_dc_rows not available to drop'
end catch

-- get clean set of gc/dc rows
-- excluding leading dc and trailing gc rows
-- based on mav for symbols in ##symbol
select
symbol
,date
,[close]
,mav_50
,mav_200
,mav_50_lag_1
,mav_200_lag_1
,row_type
,min_date
,max_date
,marked_row_to_delete
into ##clean_gc_dc_rows
from
(
-- marked_row_to_delete identifies leading dc and trailing gc rows
select
symbol
,date
,[close]
,mav_50
,mav_200
,mav_50_lag_1
,mav_200_lag_1
,row_type
,min(date) over (partition by symbol order by symbol) min_date
,max(date) over (partition by symbol order by symbol) max_date
,
case
	when min(date) over (partition by symbol order by symbol) = date
		and row_type = 'dc' then 'delete'
	when max(date) over (partition by symbol order by symbol) = date
		and row_type = 'gc' then 'delete'
end marked_row_to_delete
from
(
-- gc and dc partitioned by symbol
select
symbol
,date
,[close]
,mav_50
,mav_200
,
case
	when
		symbol = lag(symbol,1) over (partition by symbol order by symbol)
		then
		lag(mav_50,1) over (partition by symbol order by date)
end mav_50_lag_1
,
case
	when
		symbol = lag(symbol,1) over (partition by symbol order by symbol)
		then
		lag(mav_200,1) over (partition by symbol order by date)
end mav_200_lag_1
,case
	when
		symbol = lag(symbol,1) over (partition by symbol order by symbol)
		and
		lag(mav_50,1) over (partition by symbol order by date) <= lag(mav_200,1) over (partition by symbol order by date)
		and
		mav_50 > mav_200 then 'gc'
	when
		symbol = lag(symbol,1) over (partition by symbol order by symbol)
		and
		lag(mav_50,1) over (partition by symbol order by date) >= lag(mav_200,1) over (partition by symbol order by date)
		and
		mav_50 < mav_200 then 'dc'
		else null
end row_type
from mav_10_30_50_200
) for_gc_dc_list_by_symbol
where row_type is not null
and symbol in
(
select symbol from ##symbol)
) for_marked_rows_to_delete

where marked_row_to_delete is null

order by symbol, date

begin try
drop table ##clean_gc_dc_single_rows
end try
begin catch
print '##clean_gc_dc_single_rows not available to drop'
end catch

select
gc_dc_symbol
,gc_date
,dc_date
,gc_close
,dc_close
,row_type
into ##clean_gc_dc_single_rows
from
(
select
[symbol] gc_dc_symbol
,date gc_date
,lead(date,1) over (order by symbol,date) dc_date
,[close] gc_close
,lead([close],1) over (order by symbol, date) dc_close
,row_type
from ##clean_gc_dc_rows
) for_single_rows
where row_type = 'gc'
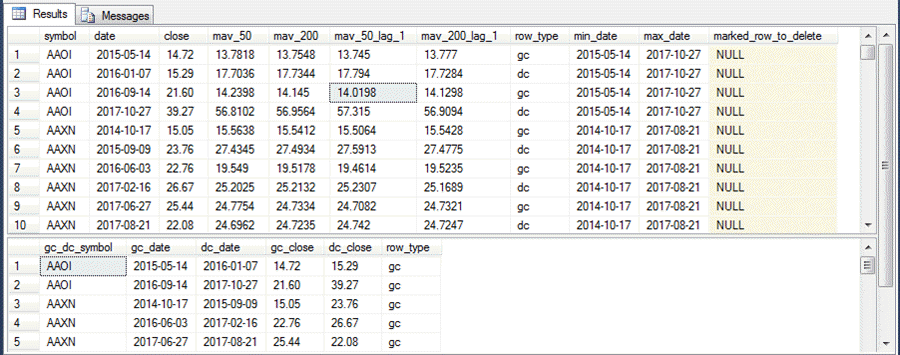
The following Results tab excerpt displays selected output from the preceding two scripts. The first four rows in the top Results pane map to the first two rows in the second Results pane.
- The AAOI symbol has two golden/death cross cycles.
- The death cross close date for the first cycle is 2016-01-07; the dc close value for the first cycle is 15.29.
- Similarly, the death cross close date for the second cycle is 2017-10-27; the dc close value for the second cycle is 39.27.
- The AAXN symbol has three golden/death cross cycles.
- Its rows from the bottom six rows in the top Results pane are collapsed into three rows in bottom Results pane.
- The arrangement of values is dictated by the same rules for the AAOI symbol.
Analyzing golden/death cross cycles based on arithmetic moving averages
There are fifty-five rows in the ##clean_gc_dc_single_rows table. This means that there are fifty-five golden/death cross cycles based on arithmetic moving averages. If the data are sorted on a value, such as percentage change from golden cross close price through to death cross close price, then the twenty-eighth value denotes the median value. This is consistent with the definition of the median as the midpoint value of a distribution of values. You can learn more about medians and other measures of central tendency from this tip.
The following script computes the close price change amount and percentage change for each golden/death cross cycle based on arithmetic moving averages. Additionally, the script finds the maximum close price within each golden/death cross cycle. The change amount difference and percentage change between the maximum close price and the golden cross close price is also tabulated in the output from the script.
The script provides output by golden/death cross cycle. A golden/death cross cycle is defined in terms of five column values within the script.
- Stock symbol
- Golden cross date
- Death cross date
- Golden cross close price
- Death cross close price
Other column values for each row of output from the script provide metrics for the golden/death cross cycle on each row, such as the change amount between the golden cross close price and the death cross close price. Before examining the output from the script, lets review the script's design to see how it generates its output.
- Two inner queries named single_row_source and max_close are left joined together.
- The single_row_source query is on the left side of the join. This query has one row per golden/death cross cycle with output matching the five defining columns for each cycle.
- The max_close query returns a set of rows for each golden/death cross cycle based on stock symbol value, golden cross date, and death cross date. Each row in a set contains a symbol's close price for a date within a golden/death cross cycle.
- As a consequence, the left joined result set of the single_row_source and max_close queries contains a row for each date within each golden/death cross cycle.
- An outer query consolidates the result set values from the left joined result set so that just one row per golden/death cross cycle exists.
- The output is grouped by the five columns defining a golden/death cross cycle.
- The first five columns of output are from the ##clean_gc_dc_single_rows table source to the script. These columns identify a cycle by its five defining column values.
- The remaining columns are computed for various analytical purposes.
- The max_close column value is the maximum close price within golden/death cross cycle. The close prices within a cycle start at the golden cross close price, typically rise to a maximum close price within the cycle, and then decline to a death cross close price at the end of the cycle.
- The days_in_trade column value denotes the number of trading days within a cycle.
- The dc_gc_change_amt is the change in close price from the golden cross through to the death cross.
- The max_gc_change_amt is the change in close price from the golden cross through to the max_close column value.
- The dc_gc_change_percent is the ratio of the dc_gc_change_amt to the golden cross close price expressed as a percentage.
- The max_gc_change_percent is the ratio of the max_gc_change_amt to the golden cross close price expressed as a percentage.
- There are several informative sort orders for the output from this script; three are listed at the end of the script, and one of the three is uncommented because the output from this sort order will be discussed later.
- The first sort order is by symbol and golden cross date. These two attributes can uniquely identify cycles. This sort order is commented.
- The second sort order is by dc_gc_change_percent; this sort order displays rows in ascending order by the percentage change of the dc_gc_change_amt relative to the golden cross close price for each cycle. The median value for column is the median percentage change across all golden/death cross cycles. This sort order is not commented.
- The third sort order is by max_gc_change_percent. This sort order ranks the cycles by the percentage change of the max_close column value relative to the golden cross close value. The values in this sort order show how much percentage gain could be achieved if it were possible to sell at the peak close value after buying at the golden cross close value.
-- tabulate change amount and change amount percent
-- for gc_close versus dc_close and and gc_close versus max_close
select single_row_source.*
,max(max_close.for_max_close) max_close
,count(*) days_in_trade
,dc_close - gc_close dc_gc_change_amt
,max(max_close.for_max_close) - gc_close max_gc_change_amt
,((dc_close - gc_close)/gc_close*100) dc_gc_change_percent
,(max(max_close.for_max_close) - gc_close)/gc_close*100 max_gc_change_percent
from
(
select
 gc_dc_symbol gc_dc_symbol
,gc_date
,dc_date
,gc_close
,dc_close
from ##clean_gc_dc_single_rows
) single_row_source
left join
(
select symbol, date, [close] for_max_close from mav_10_30_50_200
) max_close
on
single_row_source.gc_dc_symbol = max_close.symbol
and max_close.date >= single_row_source.gc_date
and max_close.date <= single_row_source.dc_date

group by
 single_row_source.gc_dc_symbol
,single_row_source.gc_date
,single_row_source.dc_date
,single_row_source.gc_close
,single_row_source.dc_close

-- default sort order
-- order by gc_dc_symbol,gc_date

-- median dc_gc change percent change is 12
order by ((dc_close - gc_close)/gc_close*100)

-- median max_gc_change_percent is 34
-- order by (max(max_close.for_max_close) - gc_close)/gc_close*100
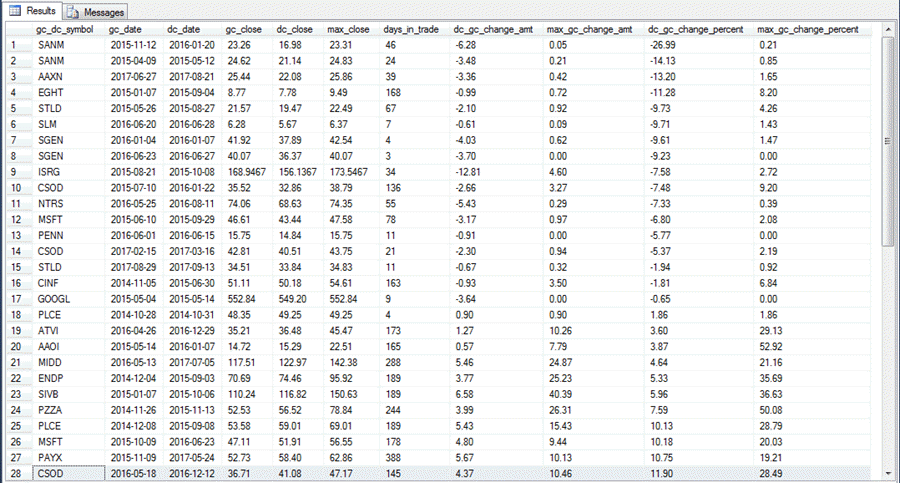
The following screen shot shows the first twenty-eight rows from the result for the preceding script in the dc_gc_change_percent sort order. As noted above, the twenty-eighth row denotes the median value for a column's sort order because there are fifty-five rows in the table. Therefore, the median percentage change rounds to 12 percent. This result is obtained for the stock with the CSOD symbol value.
Another interesting point from the following screen shot is the relationship of the max_gc_change_percent column values to the dc_gc_change_percent column values. The max_gc_change_percent column value is always greater, except when the max_close value equals the gc_close value. Furthermore, the size of the difference is often substantial. This is empirical confirmation that there is frequently a positive percentage change that is reached within a golden/death cross cycle that is well above the percentage change from the golden cross close price to the death cross close price. There are likely multiple ways to retain a large portion of the substantial difference between max_gc_change_percent and the dc_gc_change_percent. However, a proper evaluation of these ways is beyond the scope of this tip. It is likely that some of these ways will be covered in future tips on technical indicators.
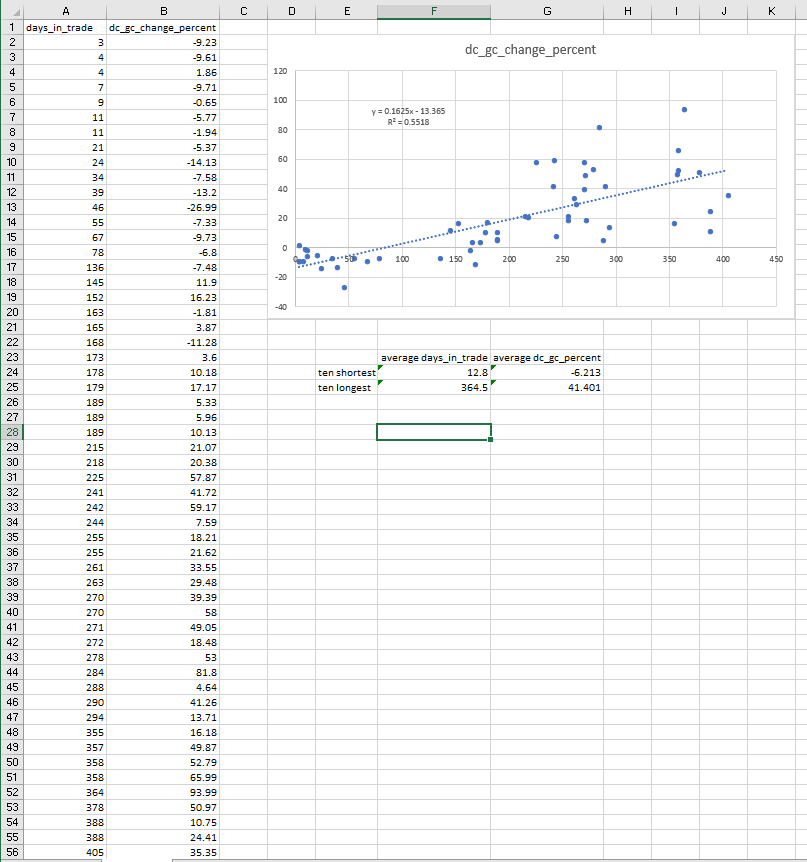
Yet another interesting feature of the result set is that the percentage change amount grows as the number of days between the golden cross through the death cross grows. The following excerpt from an Excel workbook has the days_in_trade and dc_gc_change_percent columns from the output for the preceding script. The coefficient of determination (R squared) is .55, which means that fifty-five percent of the variance of the dc_gc_change_percent column values are explained by days_in_trade column values.
The workbook also indicates that the average dc_gc_change_percent value for the first ten rows is -6.2. This means that on average the ten shortest cycles had a death cross close value that was below their golden cross value. On the other hand, the average dc_gc_change_percent value for the last ten rows is 41.4. This means that for the ten longest golden/death cross cycles the change amount is slightly more than forty-one percent higher at the death cross than the golden cross.
Another way to assess the potential value of golden/death cross cycles to enhance the net worth of investors is to consider the percent of trading days in a cycle when there is a positive percentage gain or a gain of more than a certain percentage, such as ten percent. The following script re-analyzes the ##clean_gc_dc_single_rows and mav_10_30_50_200 tables to derive the percent of trading days in a cycle when there is a positive percentage gain or a gain of more than ten percent.
The overall design of the following script is like the preceding one with a couple of key changes. The main objectives of the new script are to count the number of up trading days or up trading days by more than ten percent. Up trading days are always determined relative to the golden cross close price for a cycle.
- The case statement for the close_is_up computed values counts the number of trading days in which a close price within a golden/death cross cycle exceeds the golden cross close price.
- The case statement for the close_is_up_10_percent computed values counts the number of trading days in which a close price within a golden/death cross cycle exceeds the golden cross close price by more than ten percent.
- Compare_trading_days computed value gives the total number of days for which there is a possible comparison between a close price and the golden cross close price.
- The ratios expressed as percentages between the close_is_up computed values and the compare_trading_days as well as the close_is_up_10_percent computed values and the compare_trading_days compute the two percentages that we seek for comparison purposes.
- The two order by clauses at the bottom of the script enable sorting the results by either of the two percentages.
Comments in the script report the median percentage for each sort order. The median number of trading days for a cycle with more than ten percent gain during a day is seventy-one percent for the SGEN stock symbol with a golden cross date of 2015-04-24 and a death cross date of 2015-11-27. You can confirm the stock symbol, dates, and other values referenced below by examining the result set from the following script.
- For this cycle, the close price gain was up by more than ten percent on one hundred seven out of one hundred fifty-one comparison dates.
- Furthermore, the percent of days for this cycle with close prices greater than the golden cross close price is ninety-five percent. In other words, you could lose money on only five percent of the possible trading days!
The main point of these comparisons is not to show how profitable the trades based on golden/death cross cycles are. Instead, our objective is to show how you can use T-SQL code to assess the profitability of the trades according to any of several different criteria. The best criterion to use depends on the purpose for an analysis.
-- tabulate up_10_percent_days_percent
-- across 55 trades
select
 gc_dc_symbol gc_dc_symbol
,gc_date
,dc_date
,gc_close
,dc_close
,count(close_is_up)-1 compare_trading_days
,sum(close_is_up) up_trading_days
,round(cast(sum(close_is_up) as real)/cast((count(close_is_up)-1) as real)*100,2) up_trading_days_10_percent
,sum(close_is_up_10_percent) up_10_percent_trading_days
,round(cast(sum(close_is_up_10_percent) as real)/cast((count(close_is_up_10_percent)-1) as real)*100,2) up_10_percent_trading_days_percent
from
(
select
single_row_source.*
,for_is_close_up.for_is_close_up
,
case
	when for_is_close_up.for_is_close_up > gc_close then 1
	else 0
end close_is_up
,
case
	when for_is_close_up.for_is_close_up > 1.1*gc_close then 1
	else 0
end close_is_up_10_percent
from
(
select
 gc_dc_symbol gc_dc_symbol
,gc_date
,dc_date
,gc_close
,dc_close
from ##clean_gc_dc_single_rows) single_row_source
left join
(
select
symbol
,date
,[close] for_is_close_up
from mav_10_30_50_200
) for_is_close_up
on
single_row_source.gc_dc_symbol = for_is_close_up.symbol
and for_is_close_up.date >= single_row_source.gc_date
and for_is_close_up.date <= single_row_source.dc_date
) for_many_up
group by
 gc_dc_symbol
,gc_date
,dc_date
,gc_close
,dc_close

-- median percent of days up more than 10% is 71
order by round(cast(sum(close_is_up_10_percent) as real)/cast((count(close_is_up_10_percent)-1) as real)*100,2) desc

-- median percent of days up relative to gc_close is 92
-- order by round(cast(sum(close_is_up) as real)/cast((count(close_is_up)-1) as real)*100,2)
Detecting golden/death cross cycles based on exponential moving averages
While the exponential moving average and the arithmetic moving average are both instances of a moving average, their computational guidelines are different in multiple ways.
- The arithmetic moving average passes a window over the data with a length equal to the number of periods for the moving average; the time series values in the window change with each successive period. In contrast, the exponential moving average is always based on all available prior time series values.
- The arithmetic moving average defines all moving average as null until the number of historical time series values equals the period length for a moving average. On the other hand, exponential moving average computational guidelines require that only the first moving average be null.
- The weighting for time series values in computing an exponential moving average puts more emphasis on the most recent data points than does an arithmetic moving average, which has the same weight for all-time series values within its computation window. Consequently, exponential moving averages are likely to fit the most recent time series values better than arithmetic moving averages.
- See this link for more detail on exponential moving averages, and this other link for more detail on arithmetic moving averages.
The data in the ewma_10_30_50_200 table from the AllNasdaqTickerPricesfrom2014into2017 database contains the input necessary for detecting golden cross and death cross pairs based on exponential moving average values. For each stock symbol in the database, this table contains critical fields, such as: symbol, date, close price, ewma_50 for the 50-day exponential moving average of close price, and ewma_200 for the 200-day exponential moving average of close price. The ewma_10_30_50_200 table concatenates the column values sets for successive symbols one after the other.
You can use essentially the same code for partitioning data by symbol based on exponential moving averages as for partitioning data by symbol based on arithmetic moving averages. The main difference is to use the ewma_10_30_50_200 table instead of the mav_10_30_50_200 table.
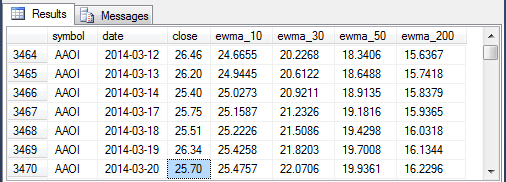
The following four screen shots give you a feel for the layout of the data in the ewma_10_30_50_200 table. You can also compare these screen shots to those for arithmetic moving average values in the mav_10_30_50_200 table to reinforce your understanding of empirical differences between the two types of moving averages for close prices.
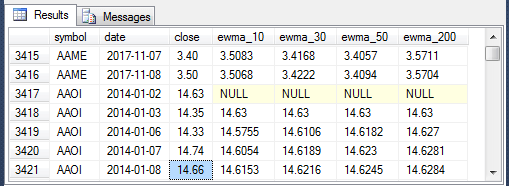
- The first screen displays a selection of rows which display the last two rows of data for one stock symbol (AAME) and the first five rows for another symbol (AAOI).
- The moving average columns (ewma_10, ewma_30, ewma_50, and ewma_200) are populated with values for the last two rows of data for the AAME symbol, but the moving average column values are null for the first row of the AAOI moving averages. Exponential moving averages are not defined for at least the first row. There is some variation among authors in how many rows beyond the first row to leave null before estimating the first exponential moving average.
- The second row of AAOI exponential moving averages equals the first time series value for close price. Again, this is by definition within the context of this tip.
- The third and subsequent AAOI exponential moving average rows are the result of a weighted average between the prior-row moving average value and the current-row time series close price. The weights change based on the period length and the number of prior-row periods.
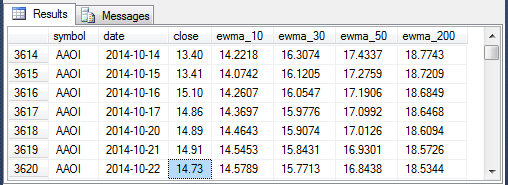
- The second screen shot shows the forty-eighth through the fifty-fourth rows for the AAOI symbol in the ewma_10_30_50_200 table.
- None of the exponential moving averages are null.
- This is because exponential moving averages are computed based on just
two distinct row values. Both of the row values are available for all rows
from the forty-eighth through the fifty-fourth rows.
- The exponential moving average for the immediately prior date is one of these values.
- The close price for the current row is the other row value required for an exponential moving average of close prices.
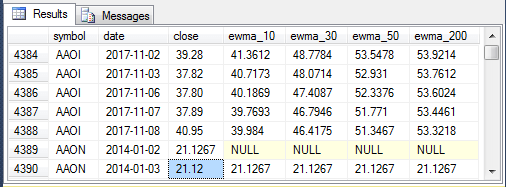
- The third screen shot shows the one hundred ninety-eighth through the two hundredth fourth rows for the AAOI symbol.
- Again, there are no null values in the display. At a top line level, the exponential moving average computational expression is the same as for the preceding screen shot.
- Computed moving average values are simply the weighted average of the prior-row exponential moving average and the current-row close price.
- The fourth screen shot shows the last five rows for the AAOI symbol and the first two rows for the AAON symbol.
- All ewma_50 and ewma_200 column values are populated for the AAOI symbol.
- Notice that the lag 1 value for the symbol column in the first row for the AAON symbol does not match the symbol column value for the last row for the AAOI symbol.
With one key exception, the T-SQL code for detecting golden/death cross cycles based on exponential moving averages is the same as for detecting golden/death cross cycles based on exponential moving averages. The key exception is to replace all mav strings with ewma strings.
- For example, the ewma_10_30_50_200 table replaces the mav_10_30_50_200 table.
- Also, references to selected columns with mav in their name are replaced by references to corresponding columns with ewma in their name, such as replacing a reference to a column named mav_50 with a reference to column named ewma_50.
There are still two scripts in the T-SQL code for detecting golden/death cross cycles.
- The first script populates a table named ##clean_gc_dc_rows. Some columns in this table have names that denote the type of moving average, such as ewma_50 instead of mav_50.
- The second script populates another table named ##clean_gc_dc_single_rows. The columns in this table have generic names that do not reference a type of moving average. The column names in this second table are as follows
- gc_dc_symbol
- gc_date
- dc_date
- gc_close
- dc_close
- row_type
The code listings for generating the ##clean_gc_dc_rows and ##clean_gc_dc_single_rows tables based on exponential moving averages are available in the download files for this tip.
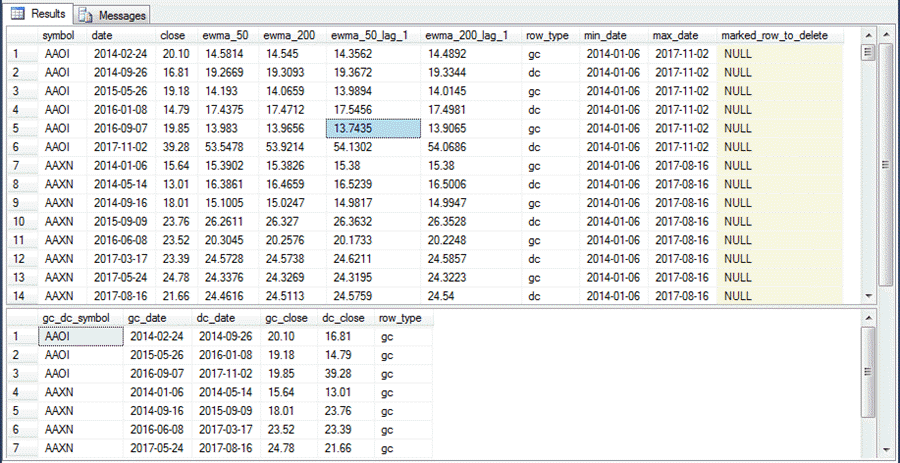
The output from the ##clean_gc_dc_rows and ##clean_gc_dc_single_rows tables for the AAOI and AAXN symbols appear in the following screen shot. You can compare this output based on exponential moving averages to output for the same two symbols based on arithmetic moving averages. Examine the prior section named "Detecting golden/death cross cycles based on arithmetic moving averages" for the screen shot with comparable data for arithmetic moving averages.
Here are some points to help you with your own comparison of the two screen shots.
- Both the AAOI and AAXN symbols each have an extra golden/death cross cycle in the output based on exponential moving averages that is missing from the output based on arithmetic moving averages.
- The extra cycles in the output from exponential moving averages both start and end in 2014.
- Recall that golden crosses based on arithmetic moving averages could not start until 200 trading days after the start of 2014. On the other hand, exponential moving averages require only one null row. This difference is what enables the extra golden/death cross cycles when they are detected based on exponential moving averages.
- While the gc_date and dc_date column values for the remaining golden/death cross cycles do not align perfectly, you can see these remaining cycles start and end at around the same dates. The different computational guidelines for exponential versus arithmetic moving averages likely account for these differences.
Comparing golden/death cross cycles for exponential versus arithmetic moving averages
The "Analyzing golden/death cross cycles based on arithmetic moving averages" section presents two scripts and four metrics for analyzing golden/death cross cycles based on arithmetic moving averages. The analysis scripts require adjustments for migration from working with arithmetic moving averages to processing data for exponential moving averages. For each of the two analysis scripts, there is a single reference to a table of moving averages. The table name is mav_10_30_50_200 when the analysis is for arithmetic moving averages; the table name changes to ewma_10_30_50_200 when the analysis is for exponential moving averages. The updated scripts for analyzing golden/death cross cycles based on exponential moving averages are available in the download files with this tip.
Recall that each analysis script reports about two metrics for the set of golden/death cross cycles.
- Change percent in close price from golden cross through to death cross (dc_gc_change_percent); this metric is derived from the first script.
- Change percent in close price from golden cross through to maximum close price (max_gc_change_percent); this metric is derived from the first script.
- Percent of trading days with a close price above the golden cross close price (up_trading_days_percent); this metric is derived from the second script.
- Percent of trading days with a close price that is more than ten percent above the golden cross close price (up_10_percent_trading_days_percent); this metric is derived from the second script.
One of the key objectives of this tip is to contrast the performance of golden/death cross cycles based on arithmetic versus exponential moving averages. The following table shows the side-by-side comparison of the cycles for each of the four metrics referenced above. The numeric values in the table show the median percent for a metric across the golden/death cross cycles based on an exponential moving average in the first column of numeric values and based on an arithmetic moving average in the second column of numeric values.
- Overall, the metrics are clearly superior for golden/death cross cycles based on arithmetic moving averages versus exponential moving averages.
- Here are two especially striking contrasts.
- The median percent change is 12% for death cross close prices versus golden cross close prices based on arithmetic moving averages, but the same metric value is -5% when the detection of golden/death cross cycles is based on exponential moving averages.
- Similarly, the median percent of trading days with more than a ten percent gain is 71 for cycles based on arithmetic moving averages, but the median percent for greater than ten percent gain trading days is just 7 percent for cycles based on exponential moving averages.
| Metric name | Based on exponential ma | Based on arithmetic ma |
|---|---|---|
| dc_gc_change_percent | -5 | 12 |
| max_gc_change_percent | 13 | 34 |
| up_trading_days_percent | 65 | 92 |
| up_10_percent_trading_days_percent | 7 | 71 |
Next Steps
There are three steps necessary for trying out the scripts from this tip.
First, you need to download the AllNasdaqTickerPricesfrom2014into2017 database from this tip. The backup file from the tip includes NASDAQ historical price and volume data as well as arithmetic moving averages for historical close prices in the mav_10_30_50_200 table.
Next, you need to download and run a script file from this other prior tip on how to create and populate the ewma_10_30_50_200 table for all stocks in the database.
The third step is to download the files for this tip from this link. The link will let you download the two T-SQL script files each of with contains four key scripts - two for detecting golden/death cross cycles and two more for analyzing the detected cycles. One T-SQL file focuses on arithmetic moving averages, and the other T-SQL file focuses on exponential moving averages. The download files also include an Excel workbook file from which excerpts are shown in the tip.
After you confirm the code works as described in the tip, you can search for additional golden/death cross cycles beyond those reported for the twenty-seven stock symbols used in this tip. A commented script at top of the gc_dc_buy_sell_mav.sql file can help you examine the AllNasdaqTickerPricesfrom2014into2017 database for additional stock symbols beyond the twenty-seven reported on in this tip. Recall that most symbols do not have golden/death cross cycles so after you select several additional symbols, you should check them with the code for detecting golden/death cross cycles to confirm that the new symbols you select have cycles on which to report results.
Finally, I close by indicating that this tip is not recommending any particular stocks, including those for which results are reported in this tip nor is it recommending any specific trading rules. The stocks reported on in this tip were selected based on precise business rules and the goals of the tip. At the time that I submitted this tip to MSSQLTips.com, I and my family members held positions in a subset of these stocks. I do occasionally use selected technical indicators, including golden/death cross cycles, in making decisions about which stocks to buy and when to sell them, but I do not routinely use the precise trading rules covered in this tip.


About the author
 Rick Dobson is an author and an individual trader. He is also a SQL Server professional with decades of T-SQL experience that includes authoring books, running a national seminar practice, working for businesses on finance and healthcare development projects, and serving as a regular contributor to MSSQLTips.com. He has been growing his Python skills for more than the past half decade -- especially for data visualization and ETL tasks with JSON and CSV files. His most recent professional passions include financial time series data and analyses, AI models, and statistics. He believes the proper application of these skills can help traders and investors to make more profitable decisions.
This author pledges the content of this article is based on professional experience and not AI generated.
View all my tips
